



Enterprises today face a growing number of emergency risks—fire incidents, medical emergencies, cyber threats, power outages, earthquakes, and severe weather events. Managing these situations effectively requires accurate data, financial control, risk visibility, and fast decision-making. However, when emergency records are scattered across emails, registers, or disconnected spreadsheets, response efficiency drops and risks escalate.
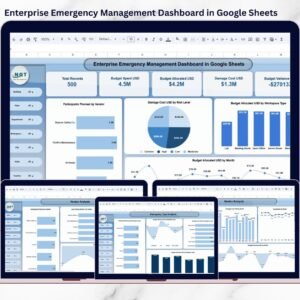
The Enterprise Emergency Management Dashboard in Google Sheets is a ready-to-use, interactive solution designed to centralize emergency data, monitor preparedness, track budgets, and analyze risks—all in one powerful dashboard.
Built entirely in Google Sheets, this dashboard transforms raw emergency data into clear KPIs, visual insights, and actionable intelligence. As a result, organizations move from reactive firefighting to proactive emergency planning and control—without complex tools or heavy IT dependency.

🚀 Key Features of Enterprise Emergency Management Dashboard in Google Sheets
🚨 Centralized Emergency Tracking – Manage all emergency incidents in one unified dashboard
📊 Executive-Level Overview KPIs – Monitor records, budgets, damage cost, and variance instantly
💰 Budget Allocation & Variance Analysis – Track allocated vs spent budgets with clarity
⚠️ Risk & Severity Visibility – Identify high-risk emergency types and locations early
🏢 Multi-Dimensional Filtering – Slice data by building, department, city, vendor, and emergency type
📈 Trend & Monthly Analysis – Detect seasonal patterns and recurring issues
🤝 Vendor Performance Analysis – Evaluate training participation, scores, and cost efficiency
🔎 Search-Enabled Data Table – Instantly find specific emergency records
☁️ Google Sheets Based – Real-time collaboration and cloud access from anywhere
📦 What’s Inside the Enterprise Emergency Management Dashboard
This digital product includes a professionally designed Google Sheets dashboard with multiple analytical sections.
🔹 Overview Page
Total emergency records
Budget allocated vs budget spent
Damage cost and budget variance
Interactive slicers for:
Building, floor, department
Workspace type
City, state, country
Emergency type and severity
Provides instant executive-level visibility.
🔹 Vendor Analysis Page
Participants planned vs attended by vendor
Average training score by vendor
Budget variance by vendor
Helps improve vendor accountability and cost control.
🔹 Emergency Type Analysis Page
Budget allocation and variance by emergency type
Damage cost by emergency category
Participation analysis by emergency type
Identifies high-impact emergencies quickly.
🔹 Department Analysis Page
Budget, damage cost, and variance by department
Participation metrics by department
Supports targeted preparedness planning.
🔹 Monthly Analysis Page
Injury count by month
Damage cost by month
Budget variance trends
Reveals time-based risk patterns.
🔹 Search & Data Table Section
Keyword-based search
Column-level filtering
Instant record count
Ideal for audits, reviews, and investigations.
🧭 How to Use the Enterprise Emergency Management Dashboard
Using this dashboard is straightforward and efficient:
1️⃣ Enter emergency data into the structured data table
2️⃣ Use slicers to filter by location, department, or emergency type
3️⃣ Review KPI cards for quick insights
4️⃣ Analyze budgets, risks, and outcomes visually
5️⃣ Use monthly trends to identify recurring issues
6️⃣ Search records instantly during audits or reviews
No dashboards to build. No coding required. Just clear emergency intelligence.
🎯 Who Can Benefit from This Enterprise Emergency Management Dashboard?
This dashboard is ideal for:
✔ Emergency Management Teams – Track incidents and preparedness
✔ Safety & Compliance Officers – Monitor risk exposure
✔ Facility & Operations Managers – Analyze location-based emergencies
✔ Risk Management Teams – Identify high-risk patterns early
✔ Finance & Leadership Teams – Control emergency budgets and costs
It is designed specifically for large enterprises with complex operations.
🔗 Click here to read the Detailed blog post
▶ Visit our YouTube channel to learn step-by-step video tutorials
Compatibility and Requirements
- Works in Google Sheets. You need a free Google account and a web browser.
- Because it runs in Google Sheets, several people can work in the same file at the same time. Google explains the basics in Get started with Google Sheets.
Frequently Asked Questions
Which pages does the dashboard include?
Five analysis pages plus a search section: Overview, Vendor Analysis, Emergency Type Analysis, Department Analysis and Monthly Analysis. The search and data table section sits alongside them.
What can I filter by?
The Overview page has slicers for building, floor, department, workspace type, city, state, country, emergency type and severity.
Does it track budgets?
Yes. It shows budget allocated against budget spent, damage cost and budget variance. You can see them by emergency type, department, vendor and month.
Can I find a single emergency record?
Yes. The data table section has keyword search, column-level filtering and an instant record count, which helps during audits and reviews.
Is there an Excel or Power BI version?
Yes. See the Emergency Management Dashboard in Excel and the Emergency Management Dashboard in Power BI.
Related Emergency and Enterprise Templates
- Emergency Management Dashboard in Excel: the same topic in Excel
- Emergency Management Dashboard in Power BI: the Power BI edition
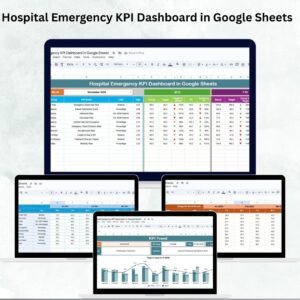
- Hospital Emergency KPI Dashboard in Google Sheets: emergency KPIs for hospitals
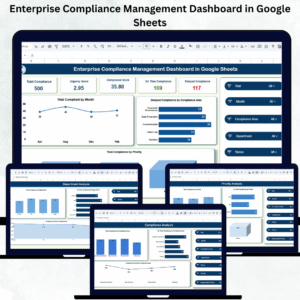
- Enterprise Compliance Management Dashboard in Google Sheets: a compliance view for enterprises
- Emergency Response Plan Checklist in Google Sheets: a checklist for response planning
Browse all Google Sheets dashboards.

















Reviews
There are no reviews yet.