



Electricity tenders involve high bid values, long-term commitments, strict compliance, and intense competition. A small delay, calculation error, or missed insight can directly impact profitability. However, many organizations still rely on static Excel files, manual summaries, and fragmented reports, which slow down decision-making and increase risk.
That is exactly why the Electricity Tender Dashboard in Power BI becomes a powerful and modern analytics solution.
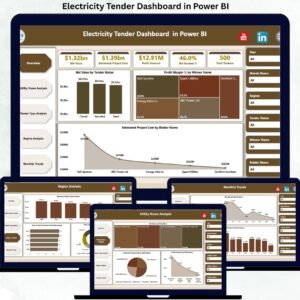
This ready-to-use Power BI dashboard transforms raw electricity tender data into interactive KPIs, insightful charts, and clear performance trends. Instead of manually reviewing hundreds of tender records, tender managers, finance teams, and leadership gain real-time visibility into bid values, costs, profits, success rates, and trends—all in one professional dashboard. As a result, organizations shift from reactive tender tracking to data-driven bidding strategy.
🔑 Key Features of Electricity Tender Dashboard in Power BI
⚡ Centralized Tender Analytics
Monitor all electricity tenders from one interactive Power BI dashboard.
📊 Real-Time KPI Cards
Track Bid Value, Estimated Project Cost, Profit Amount, Bid Success %, and Total Tenders instantly.
🎯 Bid Success & Profitability Analysis
Identify which tenders, utilities, and tender types deliver better margins.
🏢 Utility-Wise & Tender-Type Insights
Analyze performance by utility name and tender category.
🌍 Region-Based Analysis
Understand regional cost exposure, contract duration, and tender volumes.
📅 Monthly Trend Tracking
Spot seasonality, bidding cycles, and profitability patterns over time.
🧭 Interactive Slicers & Cross-Filtering
Filter insights dynamically by utility, region, tender type, and month.
⚙️ Power BI Performance & Scalability
Handles large datasets with fast refresh and smooth visuals.
📦 What’s Inside the Electricity Tender Dashboard in Power BI
This professionally designed dashboard includes 5 analytical pages, each answering a critical business question:
📊 Overview Page
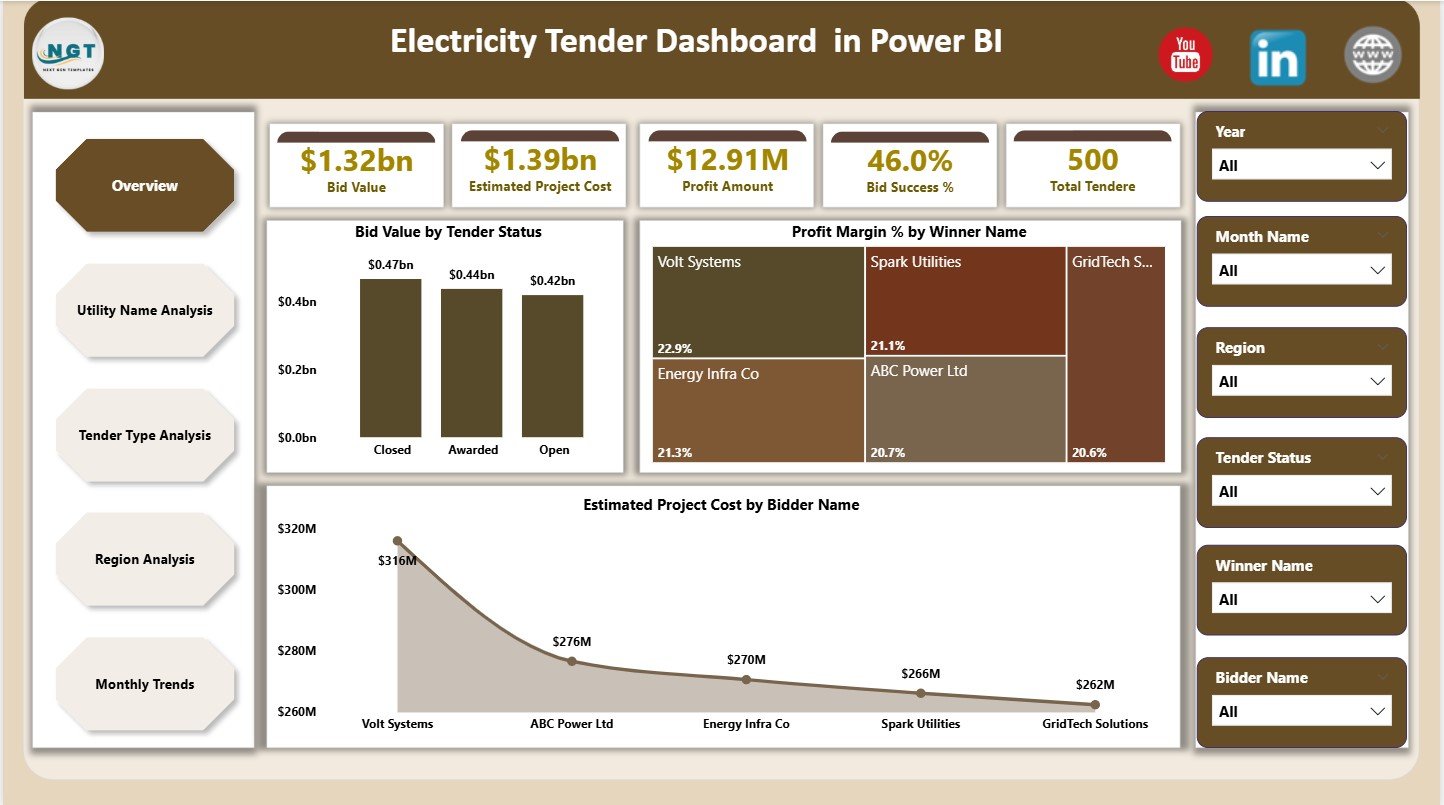
The executive summary showing KPI cards for:
Bid Value
Estimated Project Cost
Profit Amount
Bid Success %
Total Tenders
Includes charts for:
Bid Value by Tender Status
Profit Margin % by Winner Name
Estimated Project Cost by Bidder Name
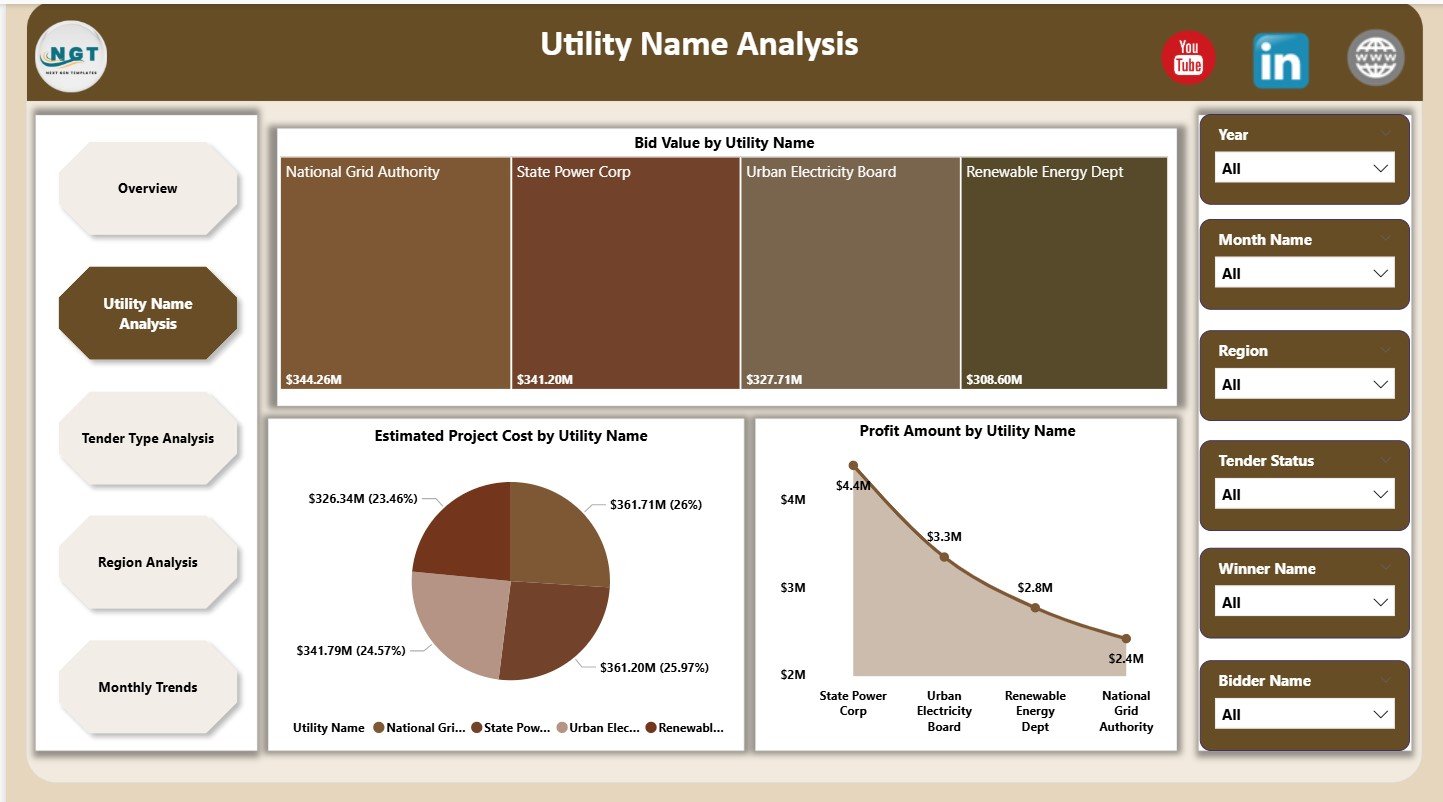
🏢 Utility Name Analysis Page
Utility-wise performance insights using:
Bid Value by Utility Name
Estimated Project Cost by Utility Name
Profit Amount by Utility Name
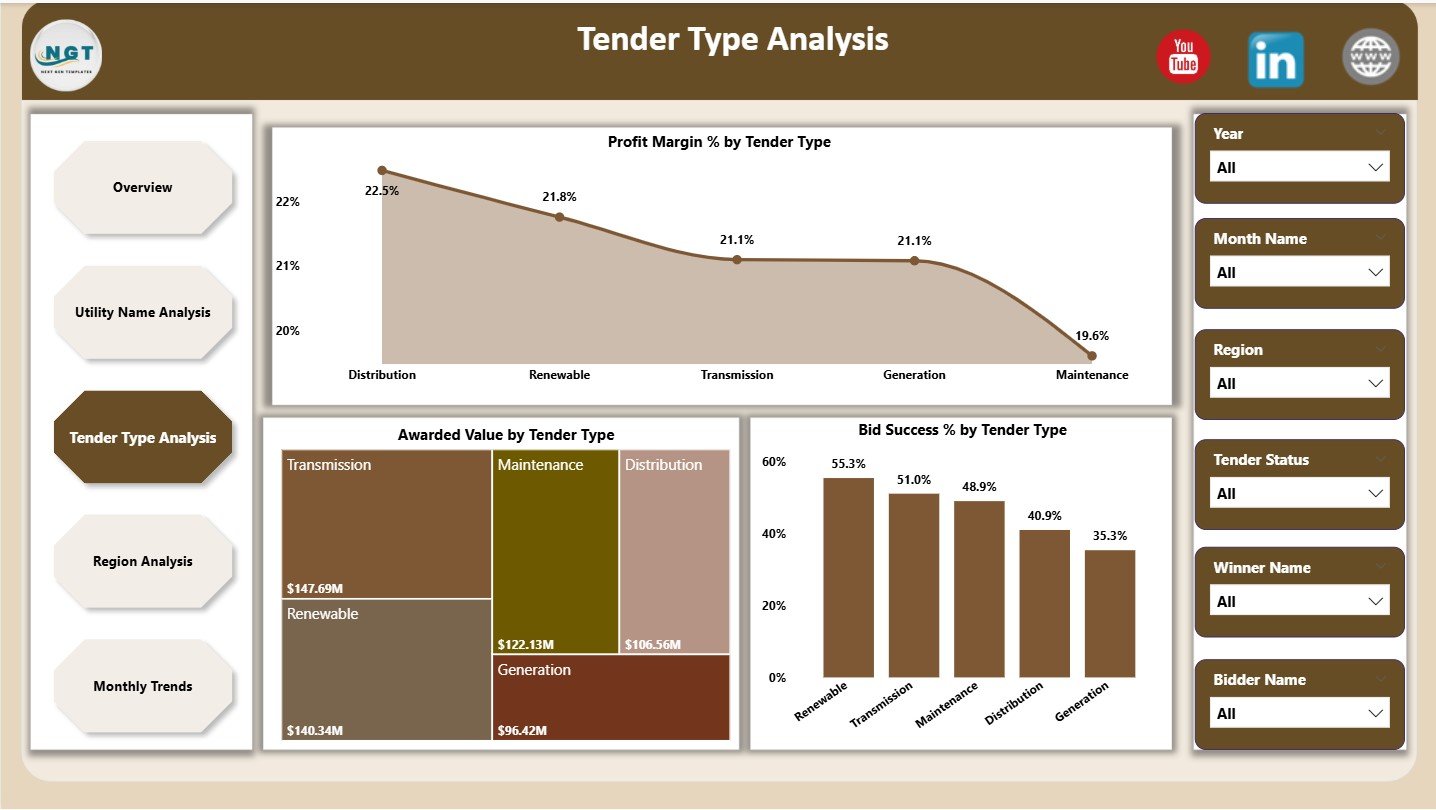
📑 Tender Type Analysis Page
Tender category performance using:
Profit Margin % by Tender Type
Awarded Value by Tender Type
Bid Success % by Tender Type
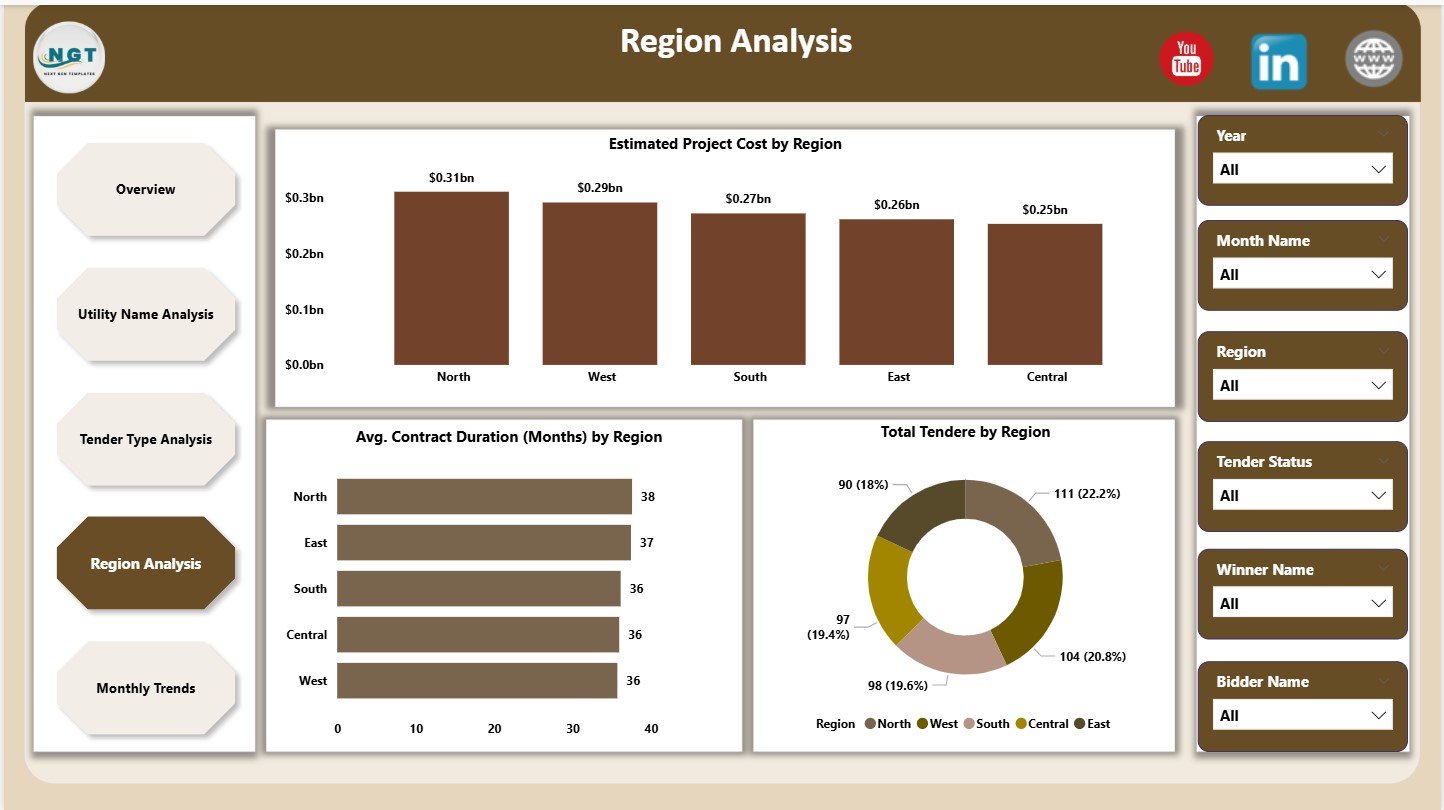
🌍 Region Analysis Page
Geographic insights using:
Estimated Project Cost by Region
Average Contract Duration (Months) by Region
Total Tenders by Region
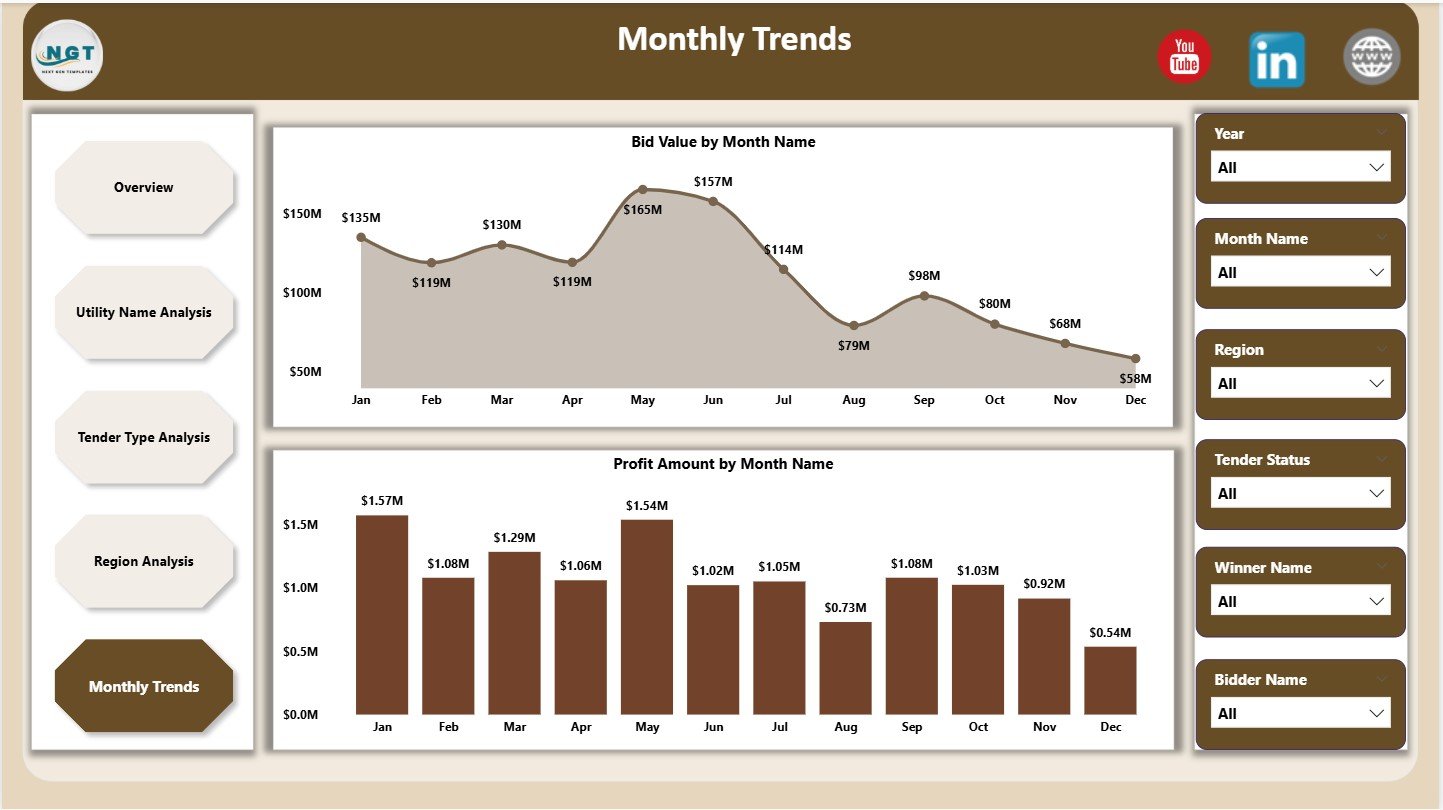
📅 Monthly Trends Page
Time-based analysis using:
Bid Value by Month
Profit Amount by Month
Each page works together to deliver complete tender visibility.
▶️ How to Use the Electricity Tender Dashboard in Power BI
Using the dashboard is simple and business-friendly:
1️⃣ Capture tender data in Excel or a structured data source
2️⃣ Connect or refresh the data in Power BI
3️⃣ Use slicers to filter by utility, region, tender type, or month
4️⃣ Review KPIs on the Overview Page
5️⃣ Analyze profitability, success rates, and risks
6️⃣ Track trends and seasonality
7️⃣ Make faster, data-driven tender decisions
No advanced Power BI expertise is required.
🎯 Who Can Benefit from This Electricity Tender Dashboard in Power BI
⚡ Electricity Distribution Companies – Improve bid evaluation and planning
🏗️ Power & EPC Contractors – Focus on high-margin tenders
🏛️ Government Procurement Teams – Increase transparency and control
💼 Tender & Bid Management Teams – Track success rates effectively
💰 Finance & Strategy Teams – Analyze cost and profit drivers
📊 Energy Consultants – Deliver professional tender insights to clients
This dashboard supports both operational execution and strategic decision-making.
👉 Click here to read the Detailed Blog Post
🔔 Visit our YouTube channel to learn step-by-step video tutorials
👉 YouTube.com/@PKAnExcelExpert
Watch the step-by-step video tutorial:
Compatibility and Requirements
- Open the .pbix file in Power BI Desktop, which is free to download from Microsoft.
- Microsoft’s guide Get Power BI Desktop shows how to install it.
Frequently Asked Questions
Which pages are in the dashboard?
Five: Overview, Utility Name Analysis, Tender Type Analysis, Region Analysis and Monthly Trends.
Which KPI cards are on the Overview page?
Bid Value, Estimated Project Cost, Profit Amount, Bid Success % and Total Tenders.
What can I filter by?
Slicers filter the report by utility, region, tender type and month.
Where does the data come from?
Keep your tender records in Excel or another structured source, then connect or refresh the data in Power BI.
Related Electricity and Tender Templates
- Electricity Tender Dashboard in Excel: the same tender dashboard in Excel
- Electricity Tender KPI Dashboard in Excel: track electricity tender KPIs in Excel
- Electricity Procurement Dashboard in Power BI: an electricity procurement dashboard in Power BI
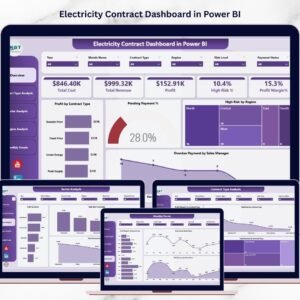
- Electricity Contract Dashboard in Power BI: an electricity contract dashboard in Power BI
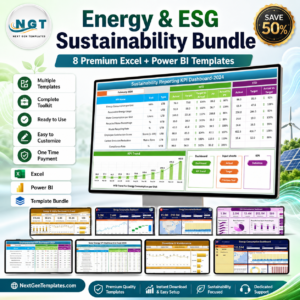
- Energy & ESG Sustainability Bundle: energy and sustainability templates in one bundle
Browse all Power BI dashboards or the Power BI KPI dashboards.






























Reviews
There are no reviews yet.