


Electricity procurement is no longer just a purchasing activity—it is a strategic cost-control function. Utilities, manufacturing plants, commercial facilities, and public sector organizations spend millions every year on electricity. Even a small inefficiency in procurement, tax handling, or supplier selection can lead to significant financial leakage.
Electricity Procurement Dashboard in Power BI However, many organizations still manage electricity procurement using scattered Excel sheets, invoices, contracts, and manual summaries. As a result, cost transparency disappears, tax impact remains unclear, and supplier performance becomes difficult to measure.
Electricity Procurement Dashboard in Power BI That is exactly where the Electricity Procurement Dashboard in Power BI becomes a game-changing analytics solution.
This professionally designed Power BI dashboard converts raw electricity procurement data into interactive KPIs, supplier comparisons, contract insights, energy-source analysis, and monthly trends. Instead of reacting to cost overruns after they occur, decision-makers gain real-time visibility and proactive control over electricity procurement performance.
Because it is built using Microsoft Power BI, this dashboard delivers speed, scalability, security, and advanced interactivity, making it ideal for modern energy procurement teams.
⚡ Real-Time Procurement Cost Visibility
Monitor electricity procurement costs dynamically with live Power BI visuals.
💰 Gross vs Net Cost Transparency
Track gross cost, net procurement cost, tax amount, and transmission charges clearly.
📊 Executive KPI Cards
Instant snapshot of procurement health using dynamic KPI cards.
🏭 Utility Supplier Performance Analysis
Compare suppliers by cost, volume, and net impact.
📄 Contract Type Cost Evaluation
Identify cost-efficient and tax-optimized contract structures.
🌱 Energy Source Cost & Sustainability Insights
Analyze procurement by coal, solar, wind, hydro, and other energy sources.
📅 Monthly Cost & Tax Trends
Detect seasonal patterns, spikes, and budgeting risks early.
🎯 Interactive Slicers & Filters
Analyze procurement data by supplier, contract, energy source, region, and time.
🔐 Enterprise-Ready Power BI Platform
Scalable, secure, and ideal for large electricity procurement datasets.
📦 What’s Inside the Electricity Procurement Dashboard in Power BI
This ready-to-use dashboard includes five powerful analytical pages, each designed to answer a critical electricity procurement question.
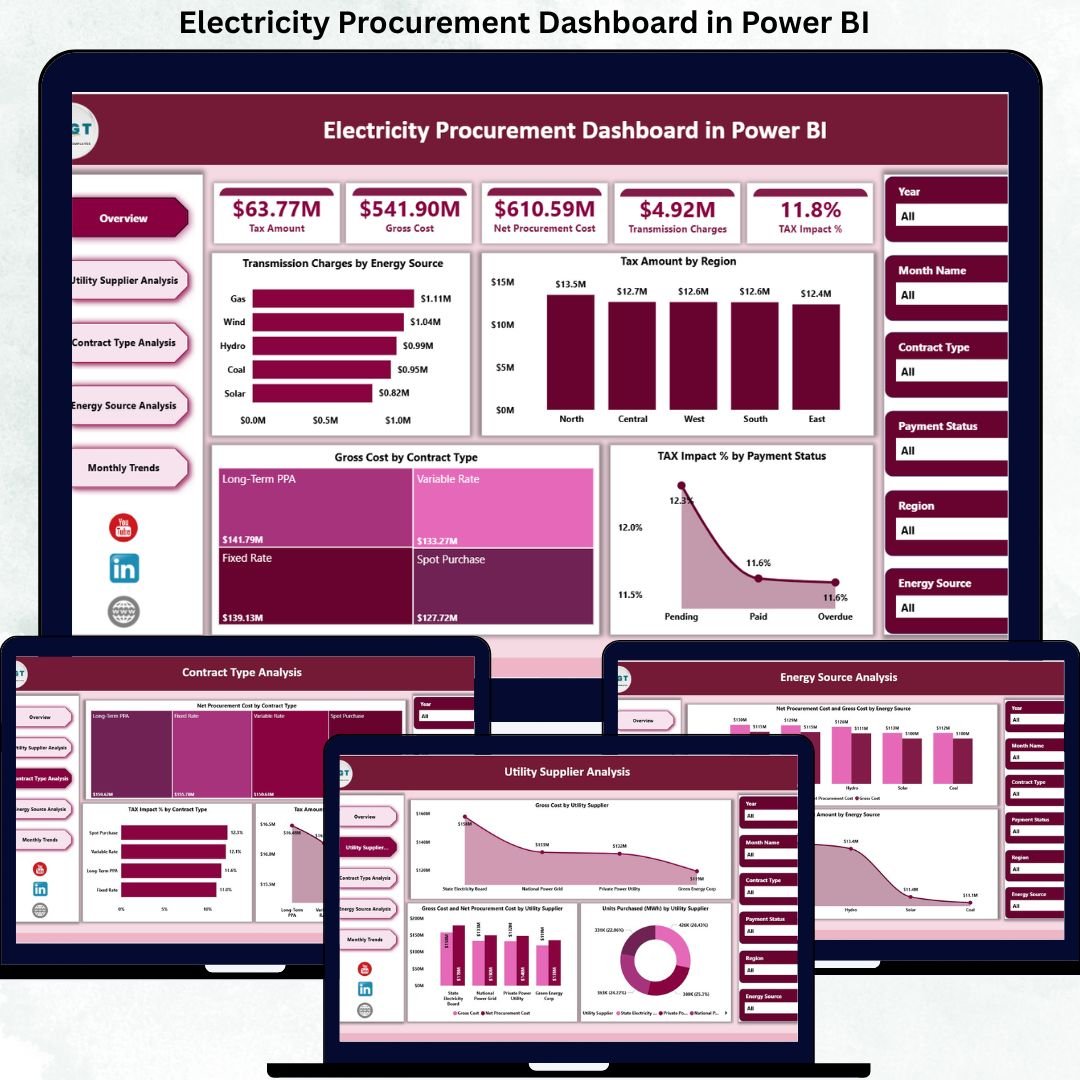
📊 Overview Page – Overall Electricity Procurement Performance
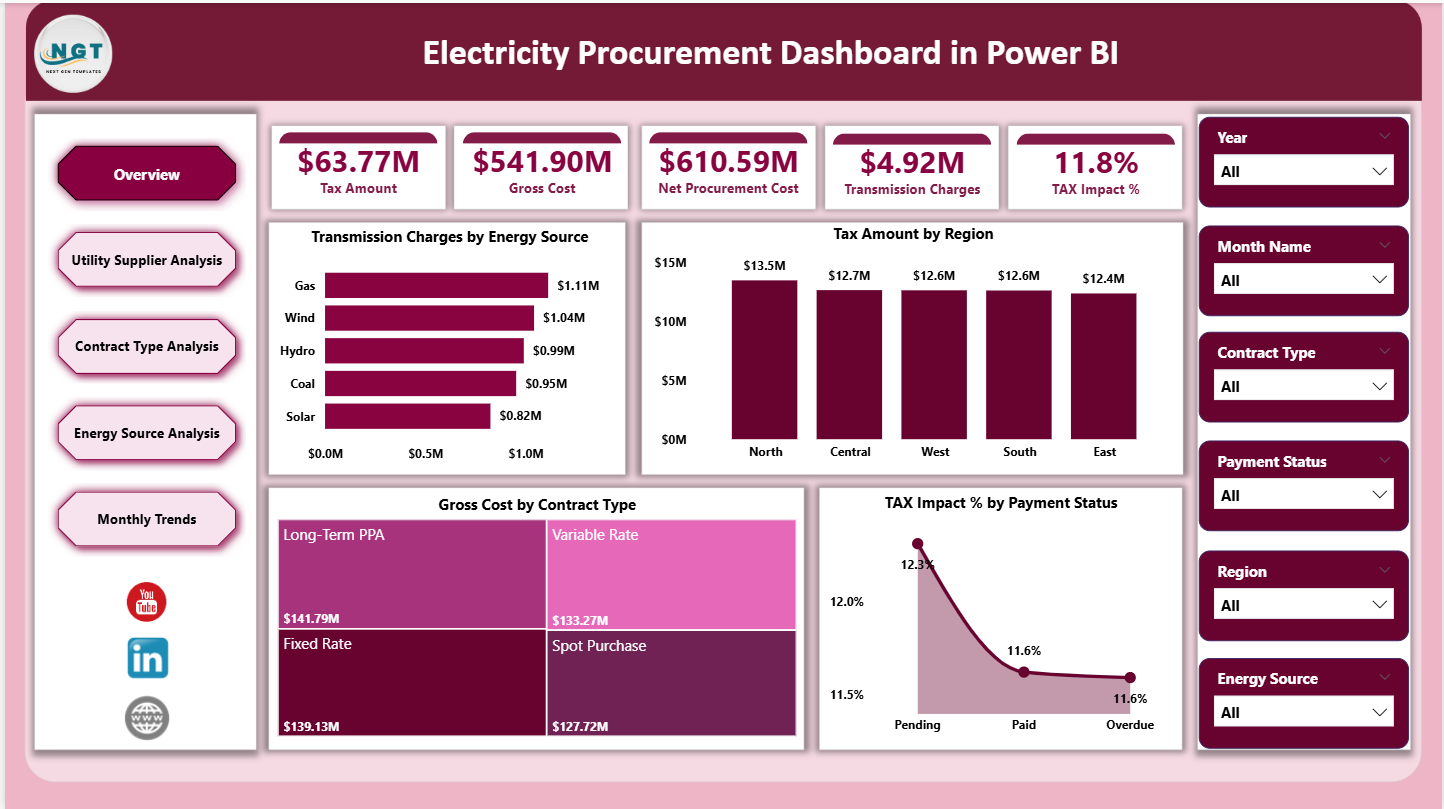
The Overview Page acts as the executive control panel.
KPI Cards Display:
Tax Amount
Gross Cost
Net Procurement Cost
Transmission Charge
Tax Impact %
Charts Included:
Transmission Charges by Energy
Tax Amount by Region
Gross Cost by Contract Type
Tax Impact % by Payment Status
This page delivers instant clarity on total procurement cost and tax exposure.
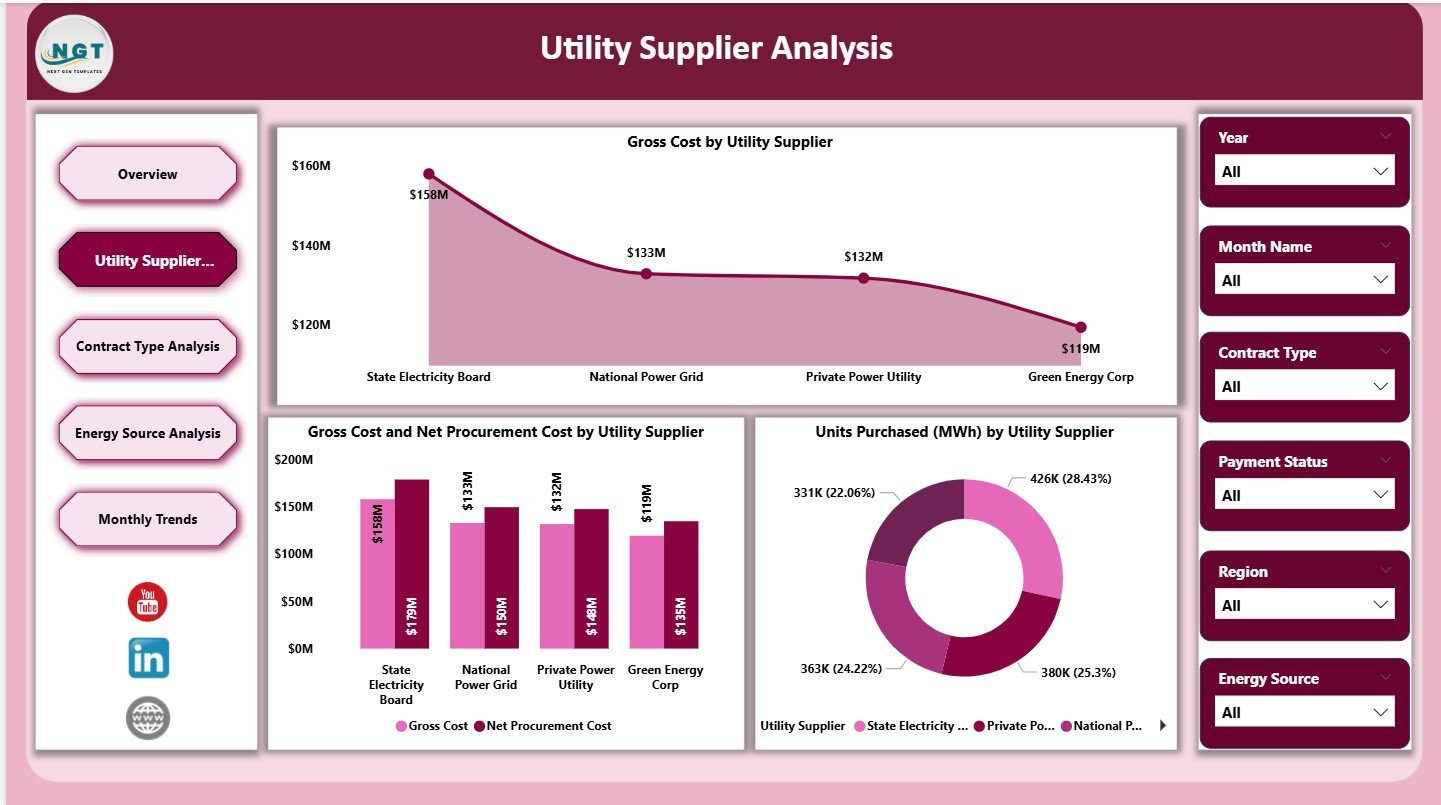
🏭 Utility Supplier Analysis – Which Suppliers Cost the Most?
This page focuses on supplier-wise electricity procurement performance.
Charts Included:
Gross Cost by Utility Supplier
Gross Cost vs Net Procurement Cost by Utility Supplier
Units Purchased (MWh) by Utility Supplier
Helps procurement teams negotiate better rates and eliminate high-cost suppliers.
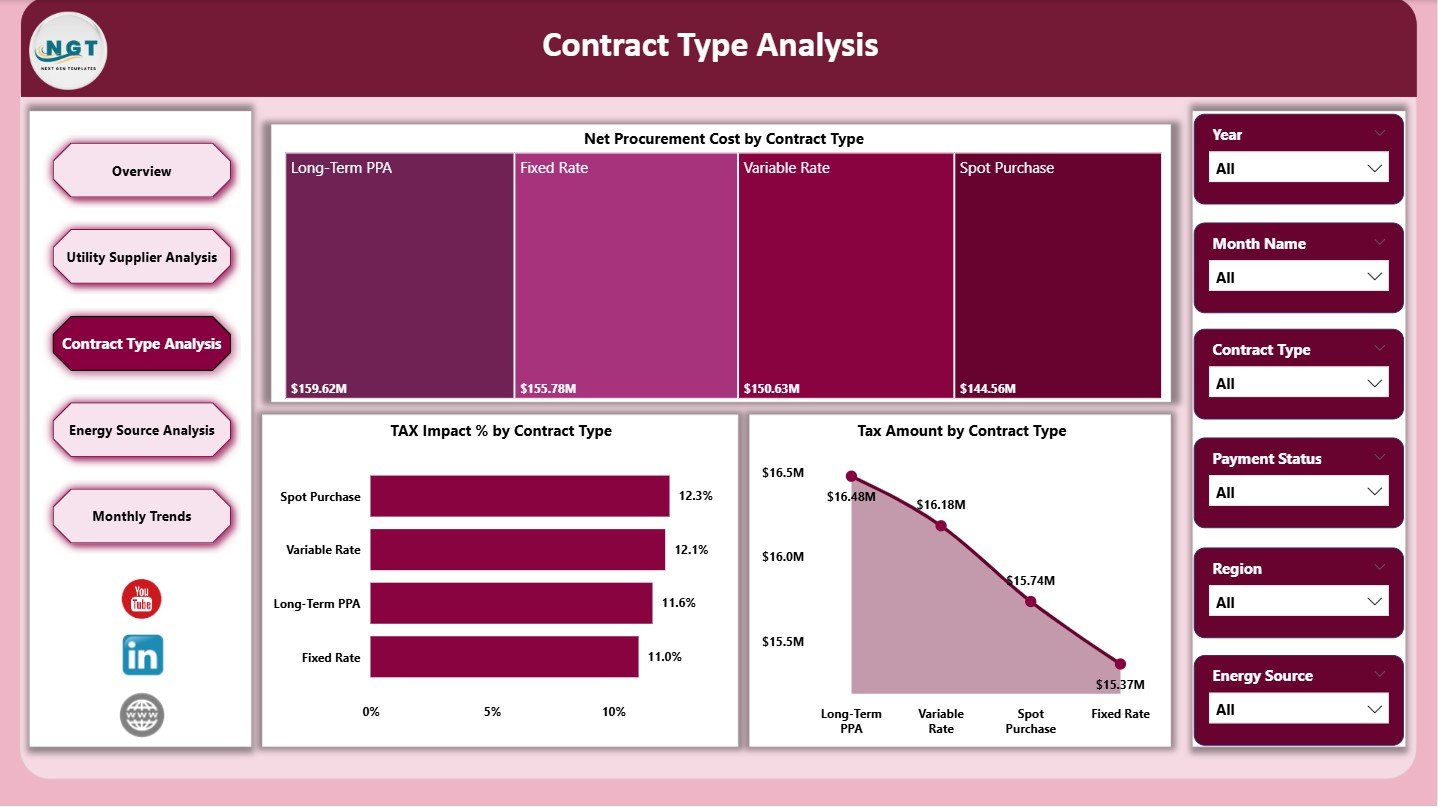
📄 Contract Type Analysis – Which Contracts Are Cost-Efficient?
Different electricity contracts behave differently.
Charts Included:
Net Procurement Cost by Contract Type
Tax Impact % by Contract Type
Tax Amount by Contract Type
Supports smarter contract selection and reduced tax exposure.
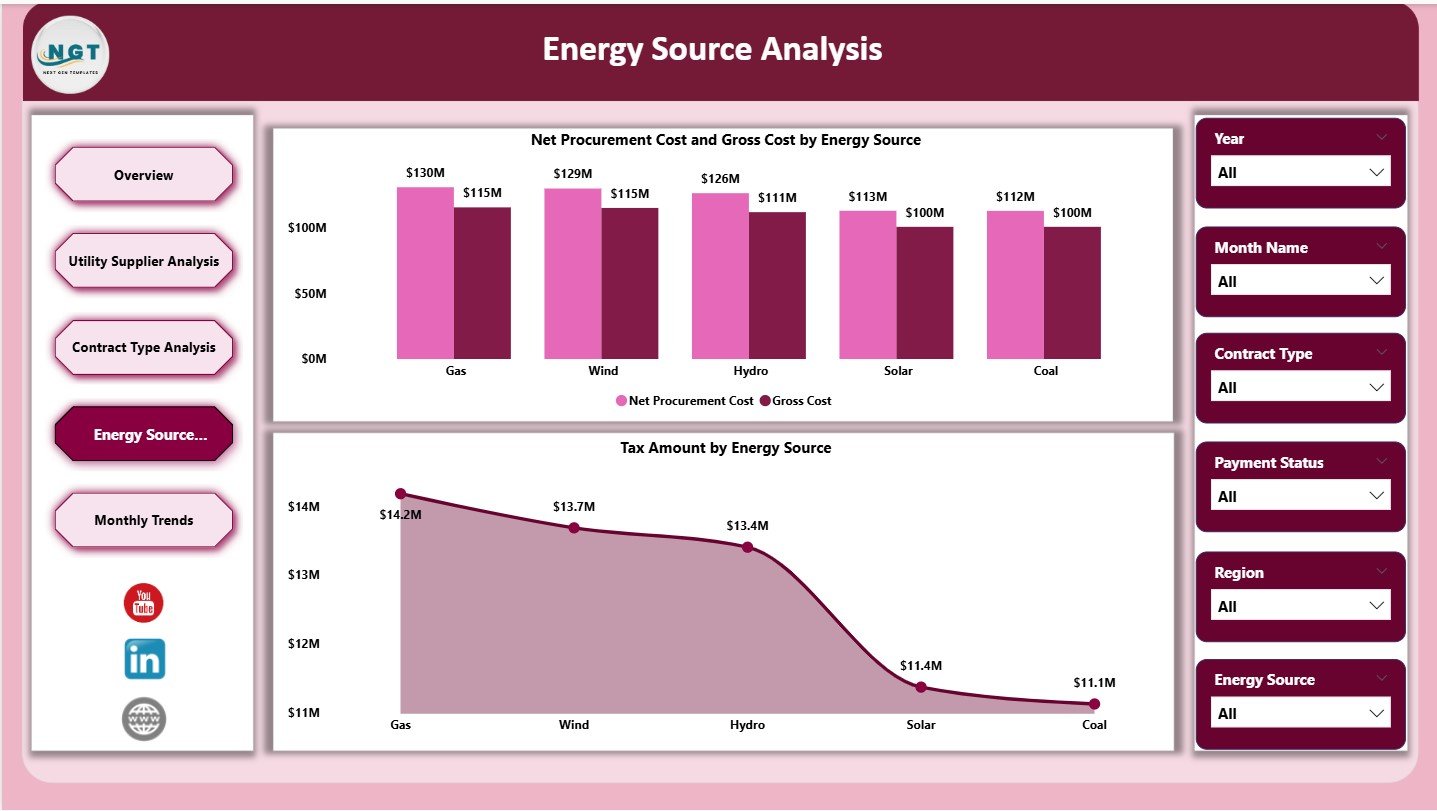
🌱 Energy Source Analysis – How Does Energy Mix Impact Cost?
This page evaluates cost and sustainability together.
Charts Included:
Net Procurement Cost vs Gross Cost by Energy Source
Tax Amount by Energy Source
Ideal for renewable planning and ESG-aligned procurement decisions.
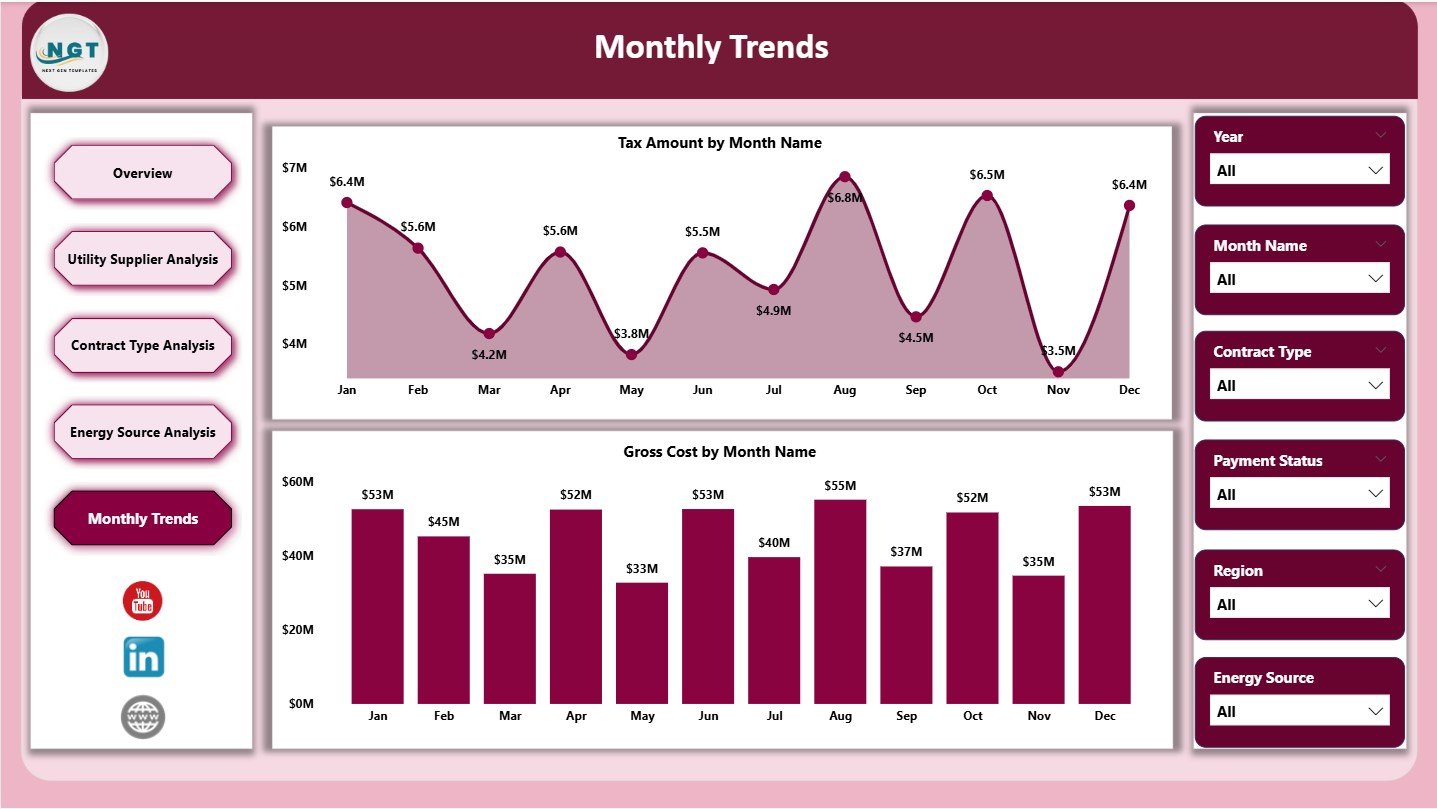
📅 Monthly Trends – How Do Procurement Costs Change Over Time?
Time-based insights help prevent surprises.
Charts Included:
Tax Amount by Month
Gross Cost by Month
Supports budgeting, forecasting, and cost-control planning.
▶️ How to Use the Electricity Procurement Dashboard in Power BI
1️⃣ Load electricity procurement data from Excel, ERP, or database
2️⃣ Refresh the Power BI dataset
3️⃣ Review KPIs on the Overview Page
4️⃣ Analyze suppliers, contracts, and energy sources
5️⃣ Track tax and transmission impact
6️⃣ Monitor monthly cost trends
7️⃣ Share insights securely with stakeholders
No advanced Power BI expertise required for end users.
🎯 Who Can Benefit from This Dashboard
⚡ Electricity & Energy Procurement Teams
📦 Utility & Supplier Management Teams
💰 Finance & Accounting Departments
🌱 Sustainability & ESG Teams
🏭 Operations & Plant Managers
👔 Senior Management & Executives
Perfect for organizations that want full visibility and control over electricity procurement.
👉 Click here to read the Detailed Blog Post
🔔 Visit our YouTube channel to learn step-by-step Power BI tutorials
👉 https://www.youtube.com/@PKAnExcelExpert































Reviews
There are no reviews yet.