Adventure Tourism Dashboard has rapidly emerged as one of the most exciting segments of the global travel industry. Today’s travelers look beyond traditional sightseeing and seek thrilling outdoor experiences such as trekking, rafting, mountain biking, paragliding, wildlife safaris, scuba diving, and other adventure activities. Because of this rising demand, tourism businesses must effectively manage bookings, customer feedback, seasonal demand, and revenue performance.
However, as the adventure tourism industry grows, companies must handle massive amounts of operational data. Tour operators manage multiple destinations, adventure activities, tour packages, and booking channels simultaneously. When businesses rely on scattered spreadsheets or manual reports, it becomes extremely difficult to understand booking trends, evaluate customer satisfaction, or identify profitable packages.
This is where the Adventure Tourism Dashboard in Power BI becomes extremely valuable.
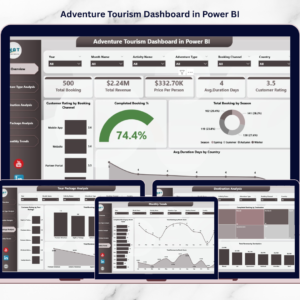
This ready-to-use Power BI dashboard transforms tourism data into interactive visual insights. Instead of reviewing multiple reports, managers can monitor bookings, analyze revenue patterns, track customer ratings, and evaluate tour package performance from a single interactive dashboard.
Because Power BI provides dynamic visuals, interactive slicers, and real-time analytics, tourism companies can easily identify trends, optimize operations, and make better strategic decisions.
🌍 Key Feature of Adventure Tourism Dashboard in Power BI
This Power BI dashboard provides powerful analytical capabilities designed specifically for tourism performance monitoring.
📊 Centralized Tourism Analytics Dashboard – Monitor bookings, revenue, ratings, and performance metrics in one interactive dashboard.
📈 Booking Performance Monitoring – Analyze total bookings and completed booking percentages.
⭐ Customer Satisfaction Tracking – Evaluate customer ratings across booking channels, activities, and packages.
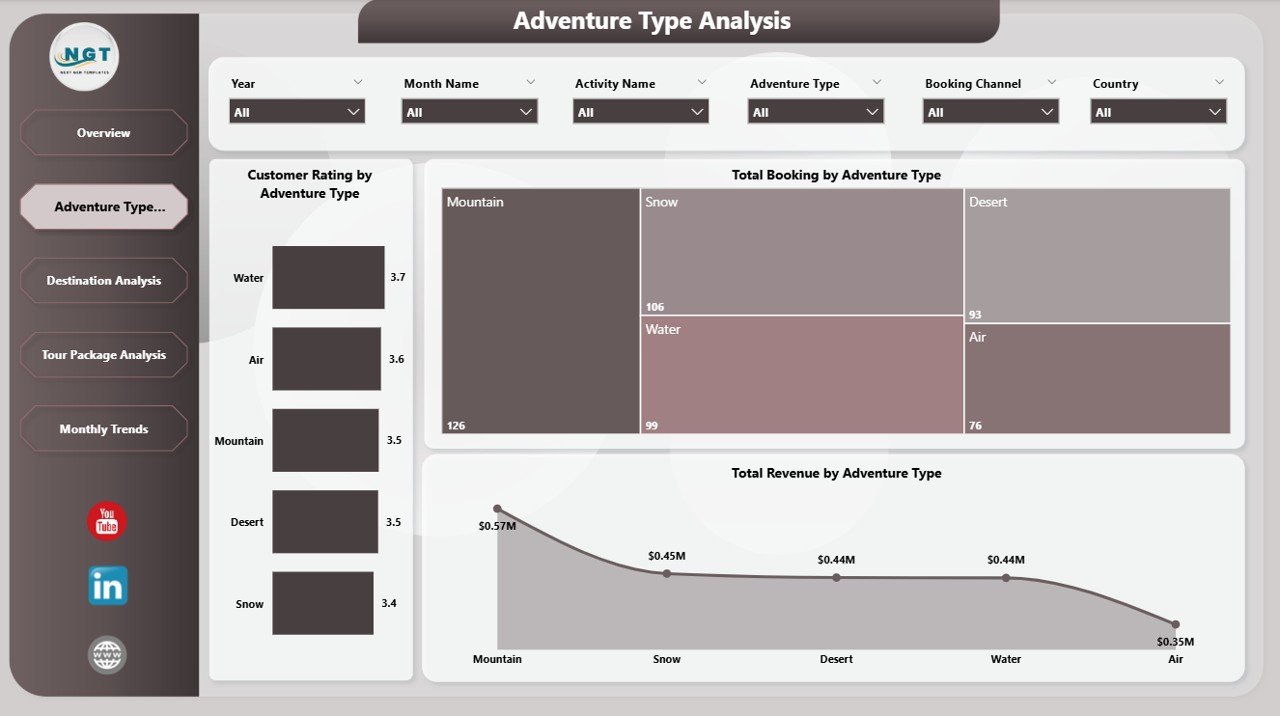
🏔 Adventure Type Performance Analysis – Compare bookings, revenue, and ratings for different adventure activities.
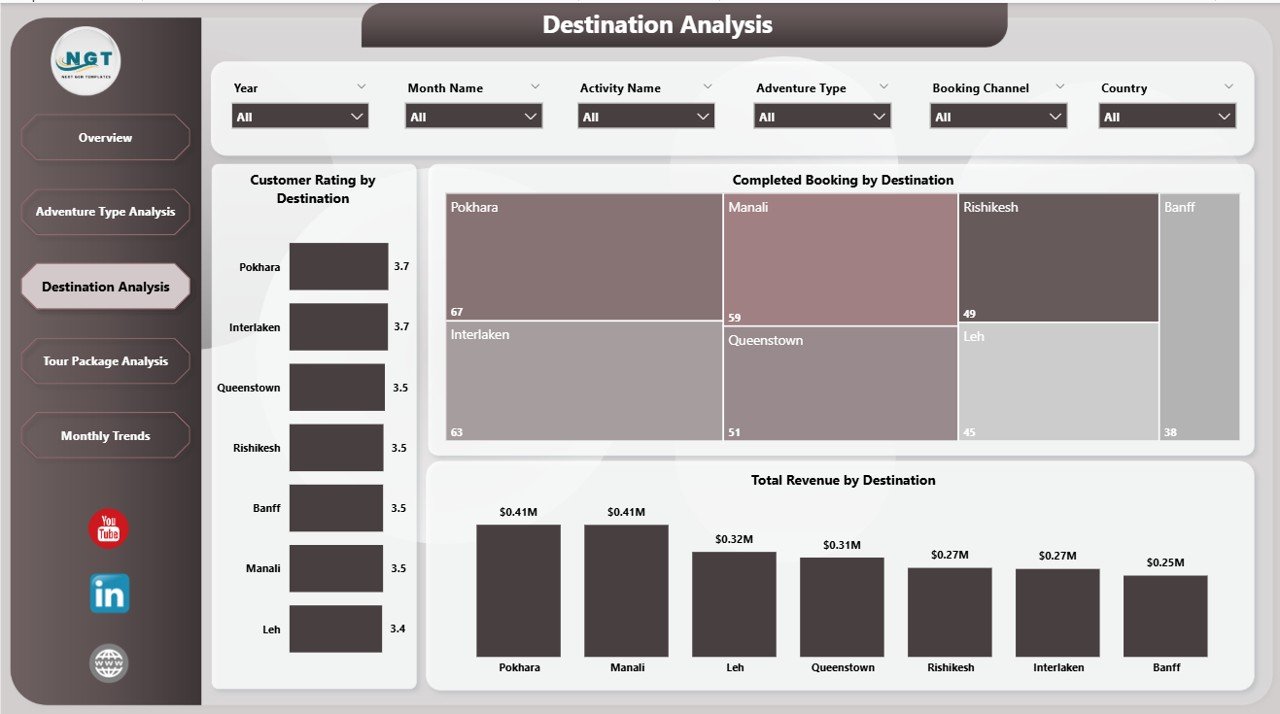
🌍 Destination Performance Insights – Identify top-performing travel destinations and monitor customer experience.
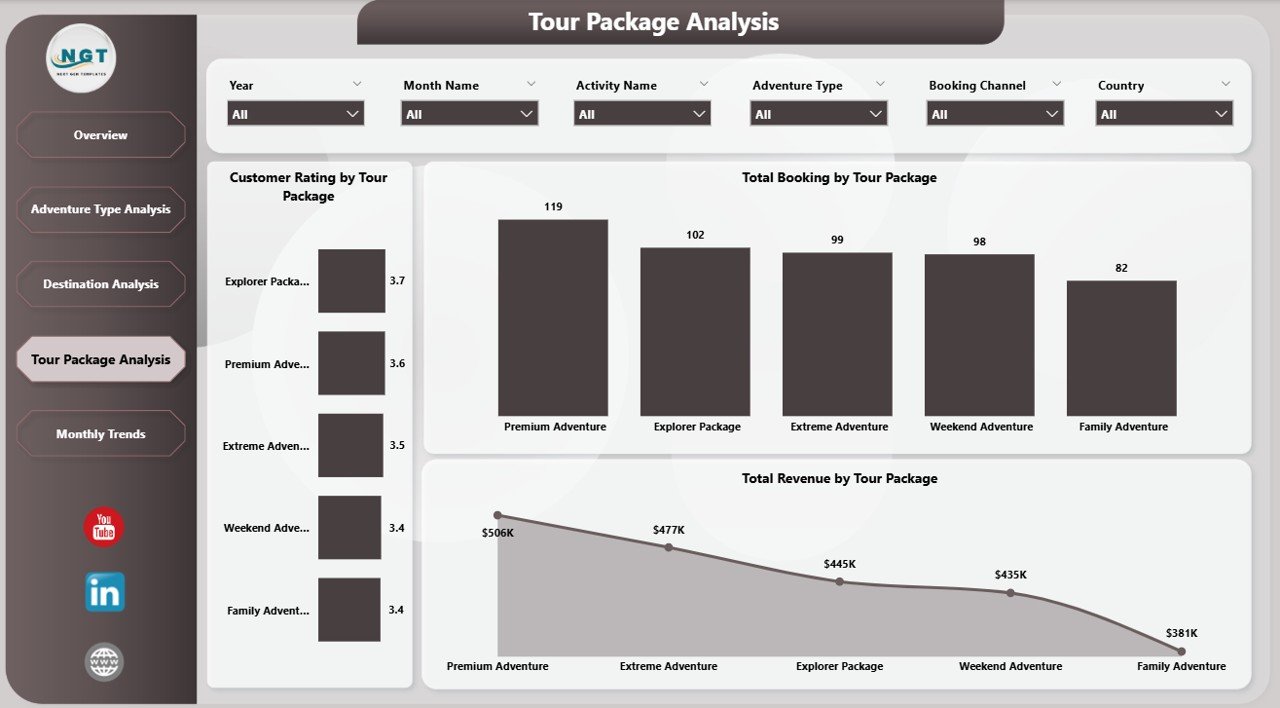
🎒 Tour Package Performance Monitoring – Track revenue and popularity of different adventure tour packages.
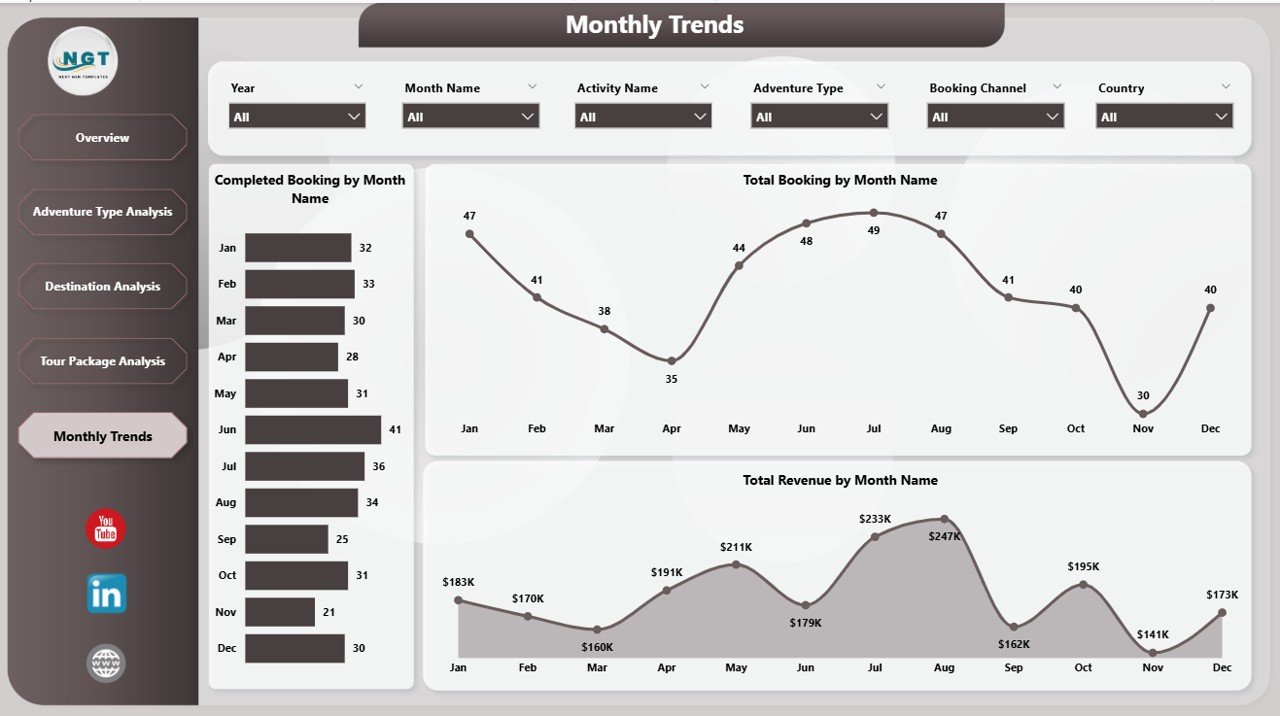
📅 Monthly Tourism Trend Analysis – Understand booking demand and revenue patterns throughout the year.
🔎 Interactive Filters and Slicers – Explore tourism data dynamically using Power BI filtering options.
📊 Seasonal Demand Analysis – Monitor booking performance across different tourism seasons.
📉 Revenue Optimization Insights – Identify profitable activities, destinations, and packages.
Because of these features, tourism managers gain complete visibility into adventure tourism operations.
📦 What’s Inside the Adventure Tourism Dashboard in Power BI
This Power BI dashboard includes five analytical pages designed to analyze tourism performance from multiple perspectives.
Inside the dashboard you will find:
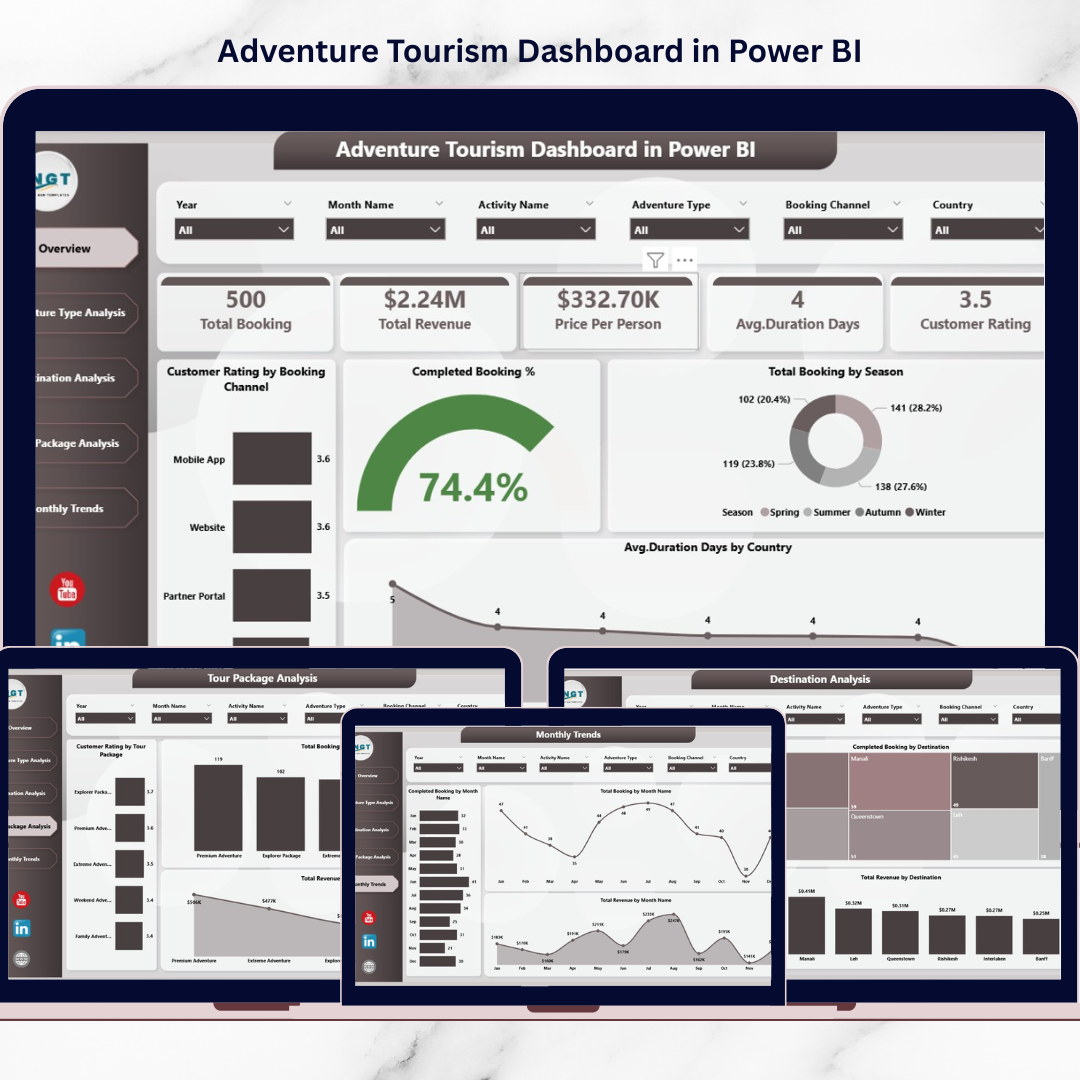
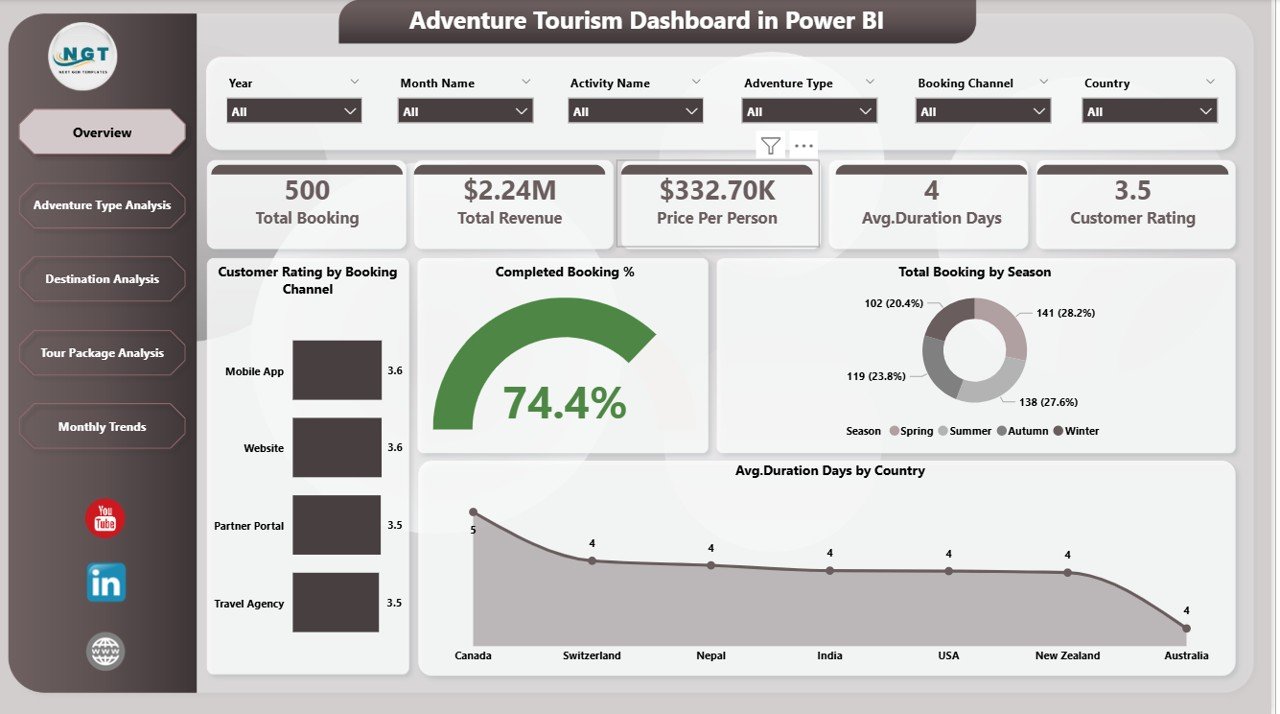
✅ Overview Page – High-level tourism performance monitoring
✅ Adventure Type Analysis Page – Adventure activity performance insights
✅ Destination Analysis Page – Destination-level tourism analytics
✅ Tour Package Analysis Page – Tour package performance evaluation
✅ Month Analysis Page – Monthly tourism demand and revenue trends
The dashboard tracks important tourism KPIs such as:
Total Bookings
Completed Booking %
Customer Ratings
Total Revenue
Average Trip Duration
Destination Performance
Adventure Activity Performance
Tour Package Popularity
Seasonal Booking Trends
Because the dashboard visualizes these metrics clearly, tourism managers can quickly understand operational performance and identify growth opportunities.
⚙️ How to Use the Adventure Tourism Dashboard in Power BI
Using this dashboard is simple and highly effective.
1️⃣ Connect tourism data sources such as booking systems, CRM platforms, or Excel files.
2️⃣ Import tourism datasets into Power BI.
3️⃣ Refresh the dashboard to update visuals automatically.
4️⃣ Use slicers to filter data by destination, adventure type, package, or month.
5️⃣ Analyze charts and KPIs to evaluate tourism performance.
Once data updates, Power BI automatically refreshes the visual insights.
This allows tourism managers to monitor performance continuously and make faster decisions.
👥 Who Can Benefit from This Adventure Tourism Dashboard
This dashboard is designed for professionals involved in tourism management and travel analytics.
It is especially useful for:
🌍 Travel Agencies
🏕 Adventure Tour Operators
📊 Tourism Analysts
🏞 Destination Management Companies
🎒 Adventure Activity Providers
📈 Tourism Business Owners
Because the dashboard combines operational metrics, customer insights, and financial performance data, multiple teams can benefit from using it.
💡 Why Tourism Companies Use Adventure Tourism Dashboards
✔ Centralized tourism performance monitoring
✔ Faster identification of profitable destinations and packages
✔ Better understanding of customer behavior and preferences
✔ Improved booking and revenue tracking
✔ Enhanced customer satisfaction analysis
✔ Data-driven marketing and pricing strategies
✔ Better seasonal demand forecasting
✔ Improved operational planning
Instead of relying on manual reporting, tourism businesses can use interactive analytics to drive growth and efficiency.
This dashboard converts tourism data into actionable insights, enabling companies to improve customer experiences and increase profitability.
### Click here to read the Detailed blog post
Visit our YouTube channel to learn step-by-step video tutorials
Youtube.com/@PKAnExcelExpert