



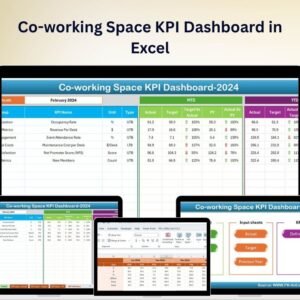
The Co-working Space KPI Dashboard in Excel is an essential tool for managers and operators of co-working spaces to monitor key performance indicators (KPIs) that drive the success of shared workspaces. Whether you’re managing a small start-up hub or a large multi-location coworking space, this Excel-based dashboard allows you to track important metrics like occupancy rates, membership growth, revenue, and customer satisfaction, helping you optimize operations and improve profitability.
With its customizable design, this dashboard helps co-working space operators make data-driven decisions, improve operational efficiency, and ensure a seamless experience for members.

Key Features of the Co-working Space KPI Dashboard in Excel:
🏢 Occupancy and Membership Tracking
Monitor membership numbers, the occupancy rate of available workspaces, and trends over time to identify growth opportunities and optimize space utilization.
💰 Revenue and Profitability Monitoring
Track revenue from membership fees, add-ons, and other services, and measure profitability to ensure financial sustainability.
📊 Customer Satisfaction and Retention
Monitor customer feedback, satisfaction scores, and membership renewals to ensure high satisfaction levels and increase member retention.
🔄 Operational Efficiency
Track key operational metrics like staff hours, maintenance requests, and facility usage to streamline operations and reduce overhead costs.
📅 Event and Community Engagement
Monitor engagement with community events, networking opportunities, and member events to build a thriving community atmosphere and encourage member participation.
🚀 Why You’ll Love the Co-working Space KPI Dashboard in Excel:
✅ Track Occupancy and Membership – Monitor membership growth, occupancy rates, and turnover to identify patterns and optimize space utilization.
✅ Ensure Financial Health – Track revenue, membership fees, and profit margins to ensure that your co-working space remains financially sustainable.
✅ Boost Customer Satisfaction – Track member feedback and satisfaction ratings to ensure a high-quality experience for all members.
✅ Optimize Operations – Streamline day-to-day operations by tracking staff productivity, facility usage, and maintenance requests.
✅ Enhance Community Engagement – Measure the effectiveness of community-building events and networking opportunities to create a vibrant, supportive workspace.
✅ Fully Customizable and Interactive – Tailor the dashboard to meet the specific needs of your co-working space, with interactive features for real-time tracking.
What’s Inside the Co-working Space KPI Dashboard in Excel:
Membership Tracking: Monitor membership numbers, occupancy rates, and membership growth trends to optimize space and predict future demand.
Revenue Tracking: Track revenue from various services such as memberships, private office rentals, and additional services like printing or event space rentals.
Customer Satisfaction: Analyze customer satisfaction scores, feedback, and renewal rates to ensure high member retention and an excellent experience.
Operational Efficiency: Monitor facility usage, staff hours, and maintenance requests to ensure that operations run smoothly and cost-effectively.
Community Engagement: Track the number and types of events, member participation, and community engagement activities to foster a strong community.
Custom Reports: Generate custom reports summarizing key metrics such as occupancy, revenue, and satisfaction levels to inform your business strategy.
How to Use the Co-working Space KPI Dashboard in Excel:
1️⃣ Download the Template – Instantly access your Excel file upon purchase.
2️⃣ Input Data – Enter membership, revenue, customer satisfaction, and operational data to start tracking KPIs.
3️⃣ Monitor Key Metrics – Use the dashboard to track occupancy, revenue, customer satisfaction, and community engagement in real-time.
4️⃣ Analyze Financials – Track revenue, profit margins, and membership growth to ensure the financial health of your co-working space.
5️⃣ Generate Reports – Create custom reports summarizing key metrics for strategic decision-making and business growth.
Who Can Benefit from the Co-working Space KPI Dashboard in Excel:
Co-working Space Owners and Managers
Community Managers
Sales and Marketing Teams
Financial Analysts in Co-working Spaces
Operations Teams
Customer Service Managers
Business Analysts
Event Planners and Community Engagement Teams
The Co-working Space KPI Dashboard in Excel is the ideal tool for optimizing the operations, growth, and financial performance of your shared workspace. By tracking essential metrics like occupancy, revenue, customer satisfaction, and operational efficiency, this dashboard ensures that your co-working space is running at its full potential.
Click here to read the Detailed blog post
https://www.pk-anexcelexpert.com/co-working-space-kpi-dashboard-in-excel/
Visit our YouTube channel to learn step-by-step video tutorials
Youtube.com/@PKAnExcelExpert
Compatibility and Requirements
- Works in Microsoft Excel desktop (Excel 2016 or later, or Microsoft 365).
- Charts and KPI calculations are built into the workbook, so there is nothing else to install.
- New to Excel charts? Microsoft explains the basics in Create a chart from start to finish.
Frequently Asked Questions
Which co-working KPIs does it track?
Occupancy rate, membership numbers and growth, revenue, customer satisfaction and renewals, staff hours, maintenance requests, facility usage and event participation.
Can I track revenue by service?
Yes. Revenue can be tracked from memberships, private office rentals and extra services such as printing or event space rentals.
What data do I enter?
Membership, revenue, customer satisfaction and operational data. The dashboard tracks the KPIs from those entries.
Is there a Power BI or Google Sheets version?
Yes. See the Power BI edition and the Google Sheets edition.
Related Co-working Templates
- Co-working Space KPI Dashboard in Power BI: the same KPIs in Power BI
- Co-working Space KPI Dashboard in Google Sheets: the online edition
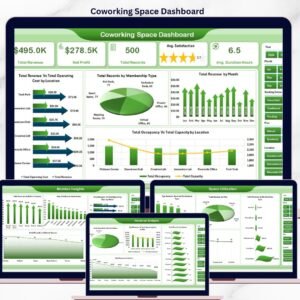
- Coworking Space Dashboard in Excel: a chart dashboard for bookings and revenue
- Co-working Space Booking Management System Web App: take and manage bookings
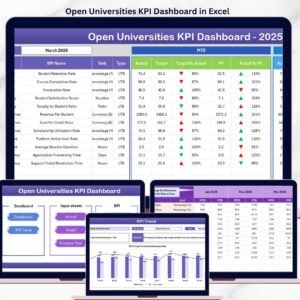
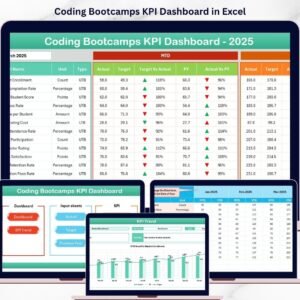
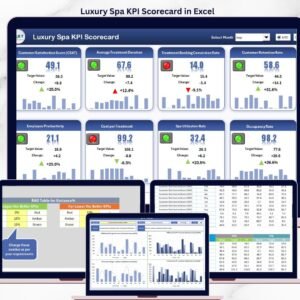
- KPI Dashboard Library (Excel): 15 Excel KPI dashboards in one download
Browse all Excel KPI dashboards or the Excel dashboards.



























Reviews
There are no reviews yet.