

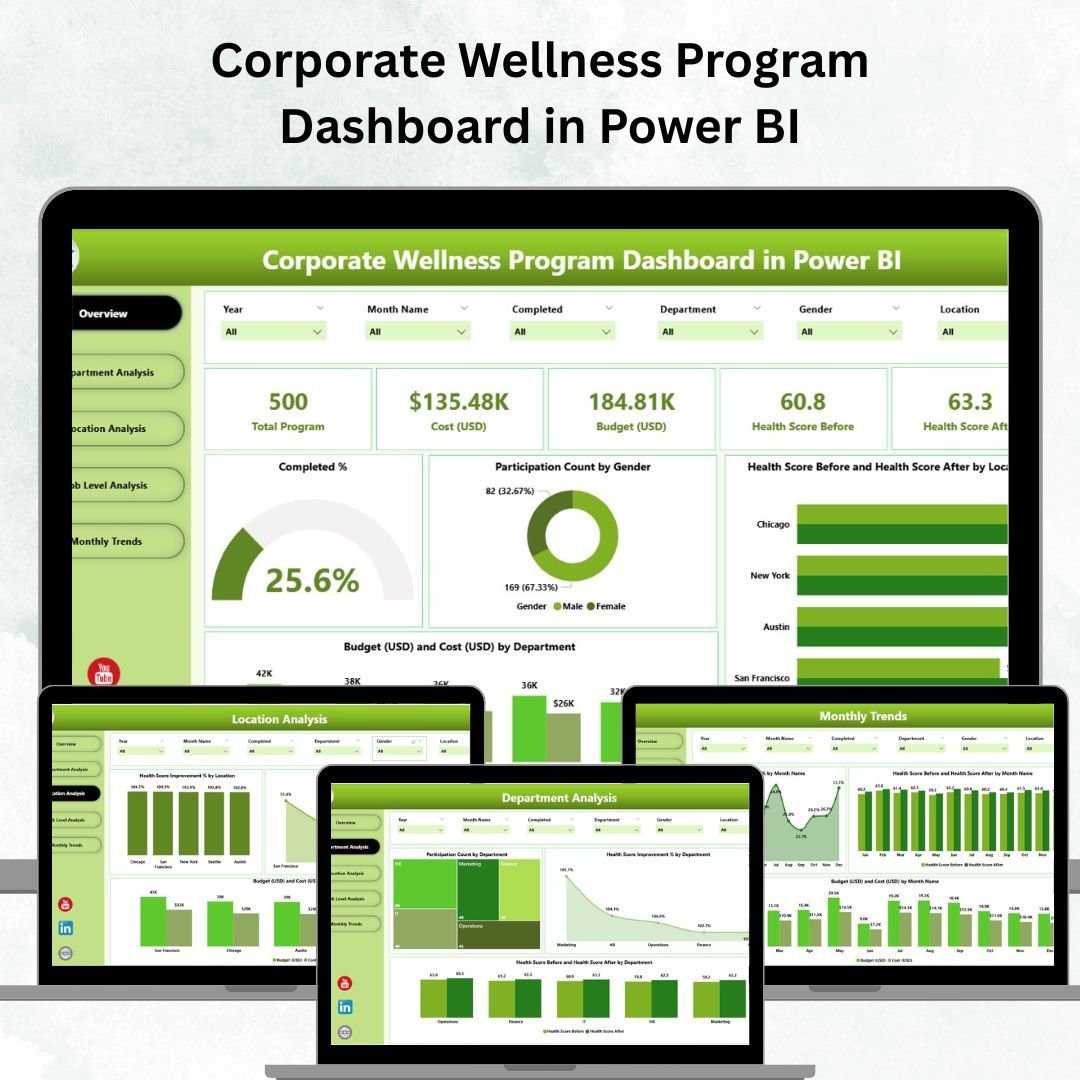

In a world where workplace stress, burnout, and absenteeism are rising, the Corporate Wellness Program Dashboard in Power BI offers a transformative way to track, analyze, and enhance employee well-being.
This ready-to-use Power BI dashboard empowers HR leaders, wellness managers, and executives to visualize participation rates, health score improvements, and program efficiency — all in one interactive, data-driven platform.
It’s not just a dashboard; it’s your organization’s health pulse monitor, designed to turn data into actionable wellness insights.
⚙️ Key Features of the Corporate Wellness Program Dashboard in Power BI
📊 Five Dynamic Pages — Overview, Department Analysis, Location Analysis, Job Level Analysis, and Monthly Trends.
💡 Real-Time Wellness Insights — Track participation %, completion rates, health score improvements, and budget vs cost data.
🧩 Interactive Slicers & Filters — Instantly filter by department, location, or job level to uncover trends.
💰 Budget vs Cost Visualization — Compare planned and actual program spending.
📈 Health Score Tracking — View “before vs after” health improvement metrics across departments and regions.
👥 Participation Analysis — Understand who’s engaging most — by gender, job level, or department.
🌍 Location-Based Comparisons — Analyze performance and participation across branches or countries.
⚡ Drill-Down Capability — Move from a big-picture overview to detailed departmental or role-level insights.
🔄 Automated Updates — Connects to Excel or HR systems for real-time data refresh.
🛠 Customizable Structure — Modify visuals, KPIs, and slicers easily to match your wellness strategy.
📂 What’s Inside the Corporate Wellness Program Dashboard
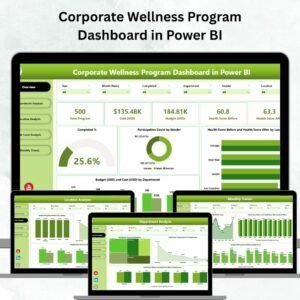
This dashboard template includes five well-structured analytical pages, each serving a unique purpose:
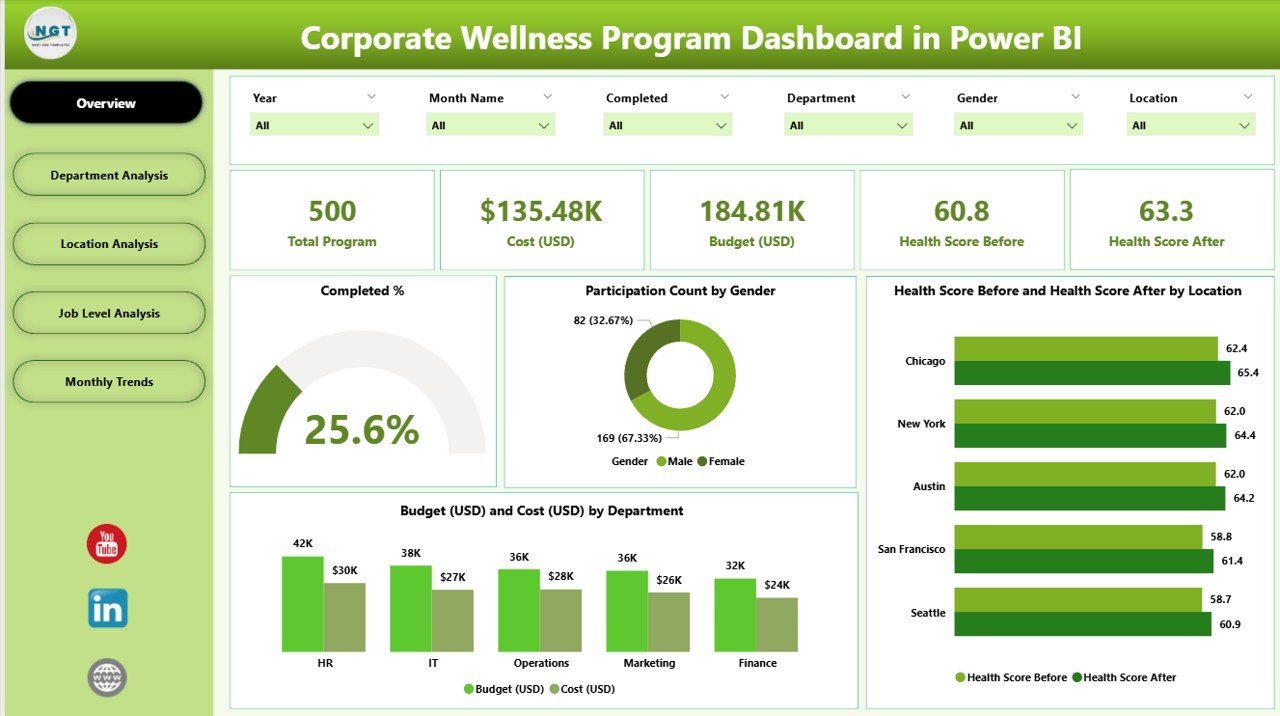
1️⃣ Overview Page
The central hub for leadership and HR teams.
Displays key KPIs like Completion %, Participation Rate, Average Health Score, Total Budget, and Total Cost.
Charts include Completed %, Participation by Gender, Health Score Improvement by Location, and Budget vs Cost by Department.
Get a snapshot of company-wide wellness performance at a glance.
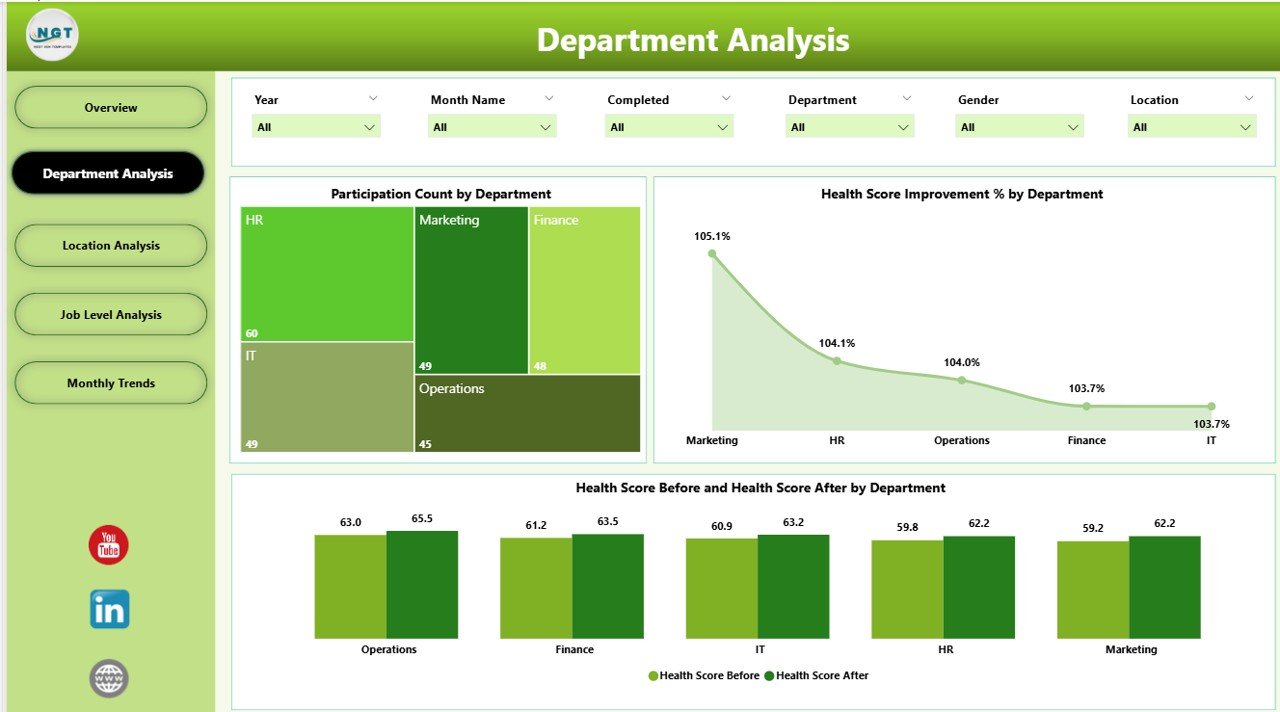
2️⃣ Department Analysis Page
Gain insights into how each department participates and benefits.
Charts include Participation Count, Health Score Improvement %, and Health Score Before vs After by Department.
Identify departments that need more motivation or support to improve engagement.
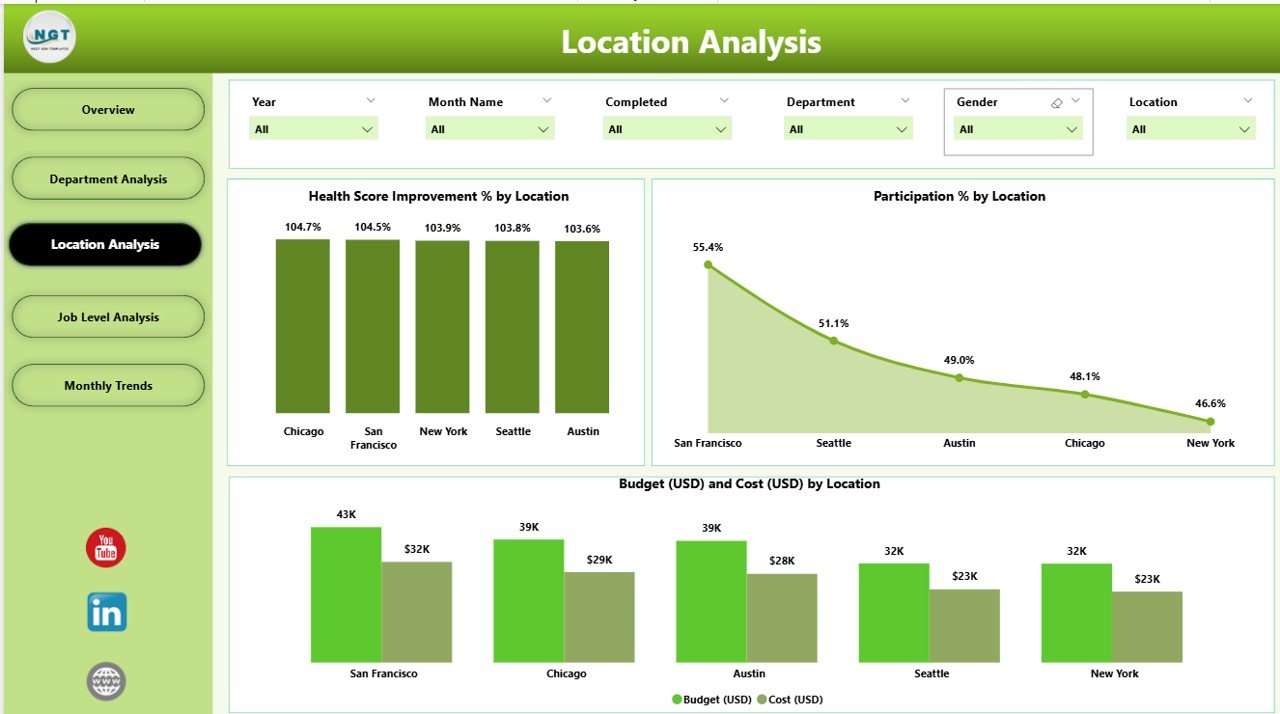
3️⃣ Location Analysis Page
Track how wellness varies across offices or regions.
Visuals display Health Score Improvement %, Participation %, and Budget vs Cost by Location.
Ideal for multi-branch organizations aiming for uniform wellness outcomes.
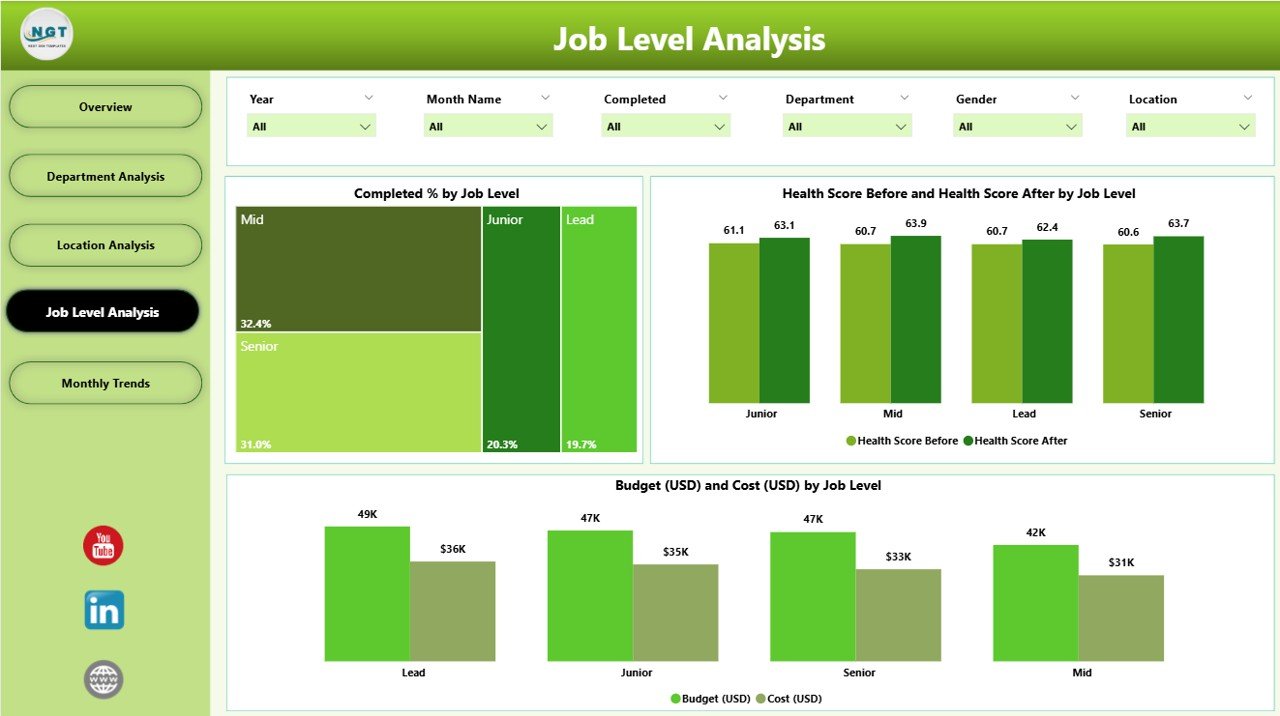
4️⃣ Job Level Analysis Page
Understand wellness engagement across job hierarchies.
Charts: Completed % by Job Level, Health Score Before vs After, and Budget vs Cost.
Perfect for identifying participation gaps between executives, managers, and staff.
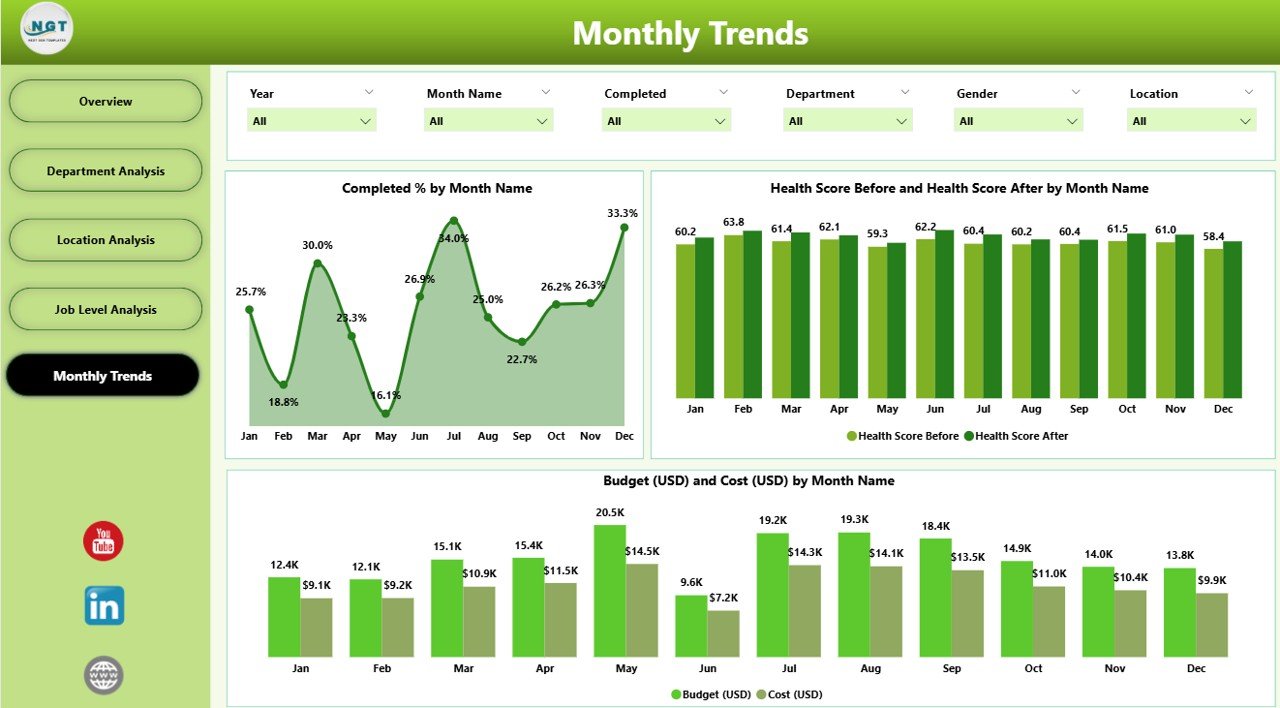
5️⃣ Monthly Trends Page
Discover time-based insights for strategic planning.
Charts include Completed % by Month, Health Score by Month, and Budget vs Cost Trends.
Detect seasonal dips, forecast program performance, and track consistency.
🧠 How to Use the Dashboard
Connect Data: Link your Excel or HR wellness data to the Power BI file.
Refresh & Update: Power BI automatically updates visuals with the latest records.
Analyze: Use slicers to view performance by department, location, or job level.
Drill Down: Click visuals for deeper insights on participation and health scores.
Share Results: Export visuals to PowerPoint, PDF, or share the dashboard securely via Power BI Service.
👥 Who Can Benefit from This Dashboard
🧑💼 HR Departments: Track participation, completion, and engagement metrics.
🧘♀️ Wellness Teams: Evaluate program impact and identify improvement areas.
💰 Finance Teams: Compare budget vs actual costs for ROI analysis.
👩💻 Executives: Monitor overall employee well-being for strategic planning.
🧑🔬 Health Consultants: Measure the success of wellness campaigns across different demographics.
Whether you manage a small office or a global workforce, this dashboard simplifies wellness tracking for every team.
🚀 Why Choose This Dashboard
✅ All-in-one visualization of employee well-being
✅ Real-time data monitoring
✅ Easy to customize and share
✅ Reduces reporting effort and manual analysis
✅ Drives data-backed wellness decisions
With this dashboard, your wellness program becomes more transparent, measurable, and impactful — ensuring that every initiative adds value to your people and your organization.
📖 Click here to read the Detailed blog post
👉 Visit our YouTube channel to learn step-by-step video tutorials
Watch the step-by-step video tutorial:
Compatibility and Requirements
- Works in Power BI Desktop, which is free to download. Microsoft explains how to get it in Get Power BI Desktop.
- You connect your own Excel or HR wellness data to the file, and the five pages update when you refresh.
- Sharing through the Power BI Service is optional. You can also export visuals to PowerPoint or PDF.
Frequently Asked Questions
How many pages does the dashboard have?
Five pages: Overview, Department Analysis, Location Analysis, Job Level Analysis and Monthly Trends.
Which KPIs does the Overview page show?
Completion %, Participation Rate, Average Health Score, Total Budget and Total Cost. Its charts show Completed %, Participation by Gender, Health Score Improvement by Location and Budget vs Cost by Department.
Can I filter the data by department or location?
Yes. Slicers let you filter by department, location or job level, and you can click a visual to drill down.
Can I compare planned and actual wellness spending?
Yes. Budget vs Cost charts appear on the Overview, Department Analysis, Location Analysis, Job Level Analysis and Monthly Trends pages.
Is there an Excel or Google Sheets version?
Yes. See the Corporate Wellness Program Dashboard in Excel and the Corporate Wellness Program Dashboard in Google Sheets.
Related Wellness and Corporate Templates
- Corporate Wellness Program Dashboard in Excel: the same dashboard in Excel
- Corporate Wellness Program Dashboard in Google Sheets: the Google Sheets edition
- Corporate Wellness Program Report in Excel: a report view of the program
- Employee Wellness Program Enrolment Tracker in Excel: track who enrolls in the program
- HR & Workforce Analytics Bundle: 10 HR templates in one download
Browse all Power BI dashboards.



























Reviews
There are no reviews yet.