



Employee well-being is no longer a “nice-to-have”—it is a strategic business priority. Organizations investing in wellness programs expect improved engagement, healthier employees, reduced absenteeism, and better productivity. However, many HR teams still track wellness initiatives across scattered spreadsheets, emails, and reports. As a result, participation trends remain unclear, costs become hard to justify, and leadership struggles to measure real impact.
That is exactly why the Corporate Wellness Program Dashboard in Google Sheets becomes a powerful and practical solution.
This ready-to-use dashboard converts raw wellness data into clear, interactive, and actionable insights. It helps HR teams, wellness managers, and leadership track participation, budgets, costs, and health score improvements across departments, locations, job levels, and time periods—all from one centralized Google Sheets dashboard.
Because the dashboard is built entirely in Google Sheets, it is cloud-based, collaborative, easy to customize, and cost-effective—without the need for expensive BI or HR analytics tools.

✨ Key Features of the Corporate Wellness Program Dashboard in Google Sheets
💚 1. Centralized Wellness Performance Tracking
Monitor all wellness KPIs in one place instead of juggling multiple reports.
📊 2. Budget vs Cost Visibility
Clearly track wellness program spending and compare it against allocated budgets.
📈 3. Health Score Improvement Analysis
Measure employee health improvement using Before vs After health score comparisons.
🧑🤝🧑 4. Participation Insights Across the Organization
Analyze participation by department, location, job level, gender, and time period.
🤝 5. Google Sheets-Based Collaboration
HR teams and leadership can access and review insights in real time with controlled sharing.
📦 What’s Inside the Corporate Wellness Program Dashboard
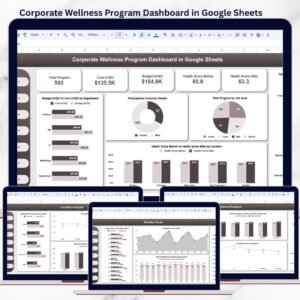
🖥️ Overview Page – Wellness Program Snapshot
This is the main dashboard view designed for leadership reviews.
📌 Key Metrics Displayed
Total Programs Conducted
Total Cost vs Budget
Health Score (Before vs After)
Participation by Department
🎛️ Interactive Slicers
Filter data instantly by:
Year
Month
Job Level
Gender
Department
Location
Participation Status
This allows instant, focused analysis without manual work.
🏢 Department Analysis Page
This page compares wellness performance across departments using:
Budget vs Cost by Department
Health Score Improvement by Department
Participation Count by Department
It quickly highlights which departments gain the most benefit from wellness initiatives and where engagement needs improvement.
📍 Location Analysis Page
Designed for multi-location organizations, this page shows:
Budget vs Cost by Location
Participation Count by Location
Health Score Improvement by Location
It helps HR teams identify regional trends, gaps, and opportunities.
🧑💼 Job Level Analysis Page
This section evaluates wellness reach across organizational hierarchy:
Participation Count by Job Level
Budget vs Cost by Job Level
Health Score Before vs After by Job Level
It ensures wellness programs support employees at every level—not just selected groups.
📅 Monthly Trends Page
Track how wellness performance evolves over time:
Budget vs Cost by Month
Participation Trend by Month
Health Score Improvement Trend
This page supports proactive planning and continuous improvement.
🎯 Why Organizations Need This Wellness Dashboard
Without structured analytics, wellness programs rely on assumptions. This dashboard helps organizations:
Measure wellness participation accurately
Justify wellness budgets with data
Track health improvement outcomes
Identify engagement gaps early
Communicate impact clearly to leadership
A single dashboard replaces guesswork with clarity.
🎯 Who Can Benefit from This Corporate Wellness Program Dashboard
👥 HR & People Operations Teams
Track wellness initiatives and participation easily.
💚 Corporate Wellness Managers
Measure program effectiveness and ROI.
📊 HR Analysts & Business Partners
Analyze trends and outcomes with confidence.
👔 Leadership Teams
Review wellness impact at a glance.
🏢 Organizations Running Wellness Programs
Scale reporting without complexity.
### Click here to read the Detailed blog post
Watch the step-by-step video tutorial:
Visit our YouTube channel to learn step-by-step video tutorials — Youtube.com/@NeotechNavigators
Compatibility and Requirements
- Works in Google Sheets. You need a free Google account and a web browser.
- You filter the dashboard with slicers for year, month, job level, gender, department, location and participation status. Google explains charts in Add and edit a chart or graph.
Frequently Asked Questions
Which pages does the dashboard have?
An Overview page, plus Department Analysis, Location Analysis, Job Level Analysis and Monthly Trends pages.
What can I filter by?
Year, month, job level, gender, department, location and participation status. The slicers filter the data instantly.
Does it track budget and cost?
Yes. It compares budget against cost overall and by department, location, job level and month.
Can I measure health improvement?
Yes. It shows health scores before and after the programs, by department, location, job level and over time.
Is there an Excel or Power BI version?
Yes. See the Corporate Wellness Program Dashboard in Excel and the Corporate Wellness Program Dashboard in Power BI.
Related Wellness and HR Templates
- Corporate Wellness Program Dashboard in Excel: the same dashboard in Excel
- Corporate Wellness Program Dashboard in Power BI: the Power BI edition
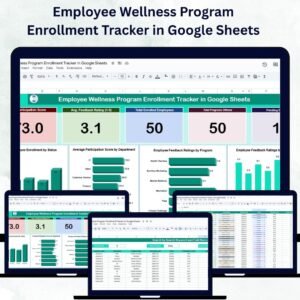
- Employee Wellness Program Enrollment Tracker in Google Sheets: track who enrolls in each program
- Corporate Wellness Program Report in Excel: a report format for wellness results
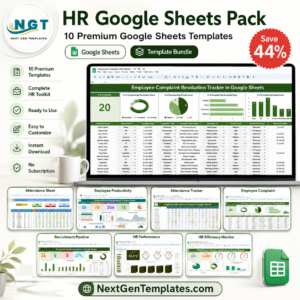
- HR Google Sheets Pack: 10 HR templates in one download
Browse all Google Sheets dashboards.





Reviews
There are no reviews yet.