Pricing countryPrices follow your selected country; checkout uses your billing country.
Construction and Real Estate Inventory Management KPI Dashboard in Excel
₹1,999.00Original price was: ₹1,999.00.₹1,299.00Current price is: ₹1,299.00.
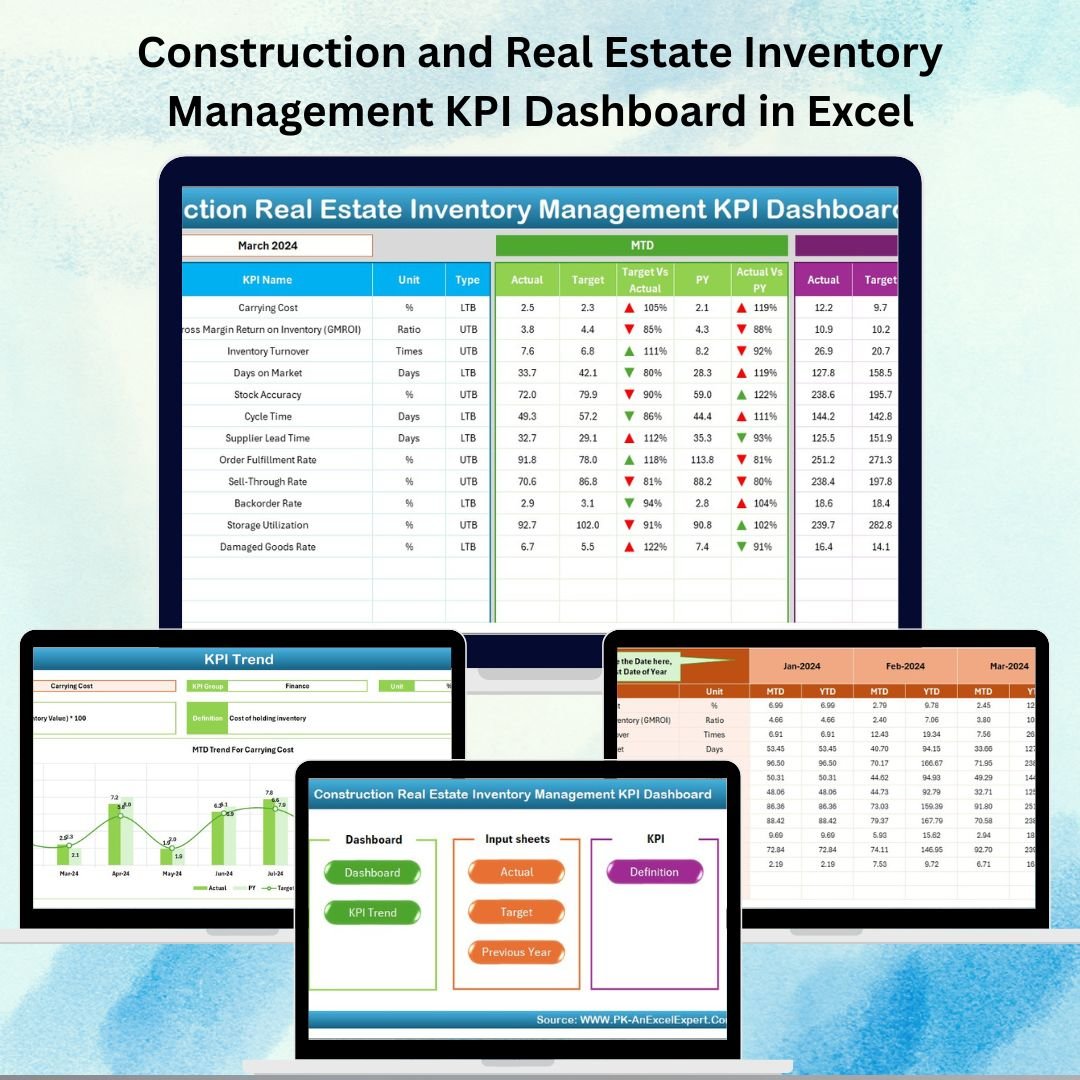
📊 Construction & Real Estate Inventory Management KPI Dashboard in Excel – Your all-in-one tool for tracking, analyzing, and optimizing inventory! Perfect for project managers, finance teams, and procurement specialists.
✨ Features:
🖱️ Easy Navigation – Clickable buttons for quick access.
📈 MTD & YTD KPI Tracking – Compare against targets & last year.
🎯 Target vs Actual Analysis – Color-coded variances with arrows.
📂 Centralized Data – All actual, target, and historical data in one place.
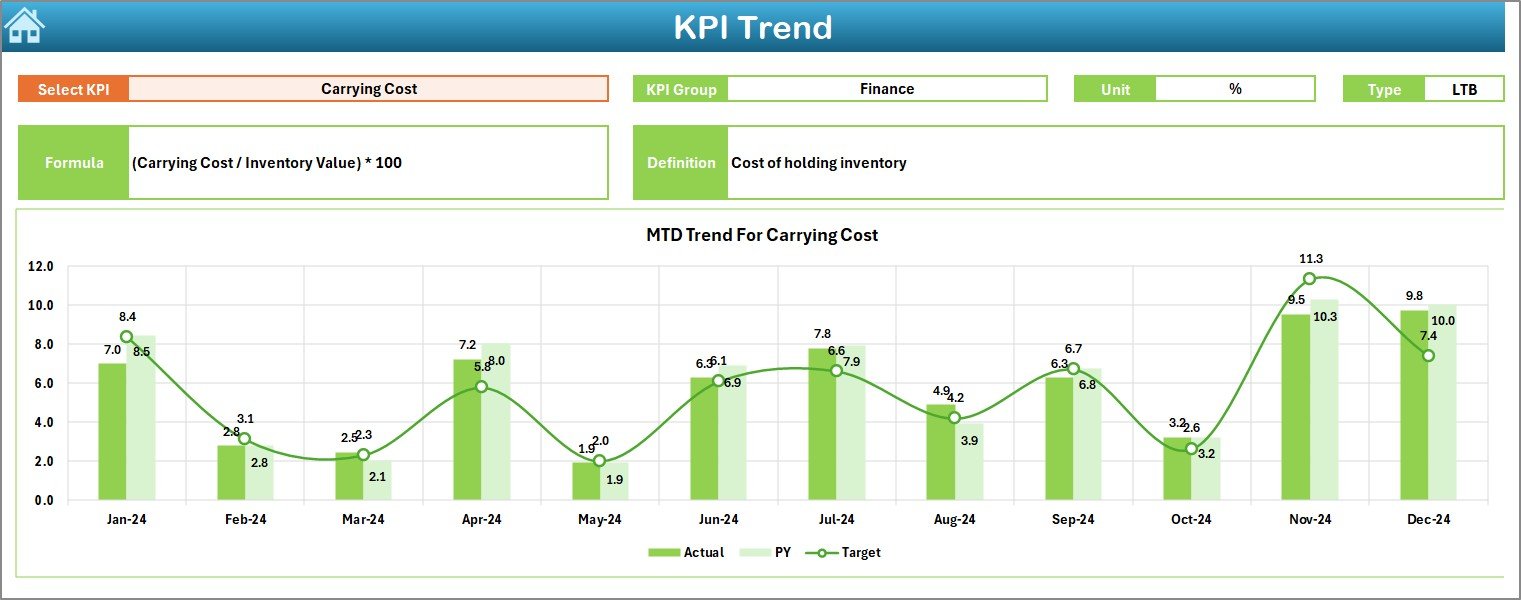
📊 Trend Analysis – Detailed KPI charts for insights.
💡 Customizable – Modify KPIs to suit your project needs.
📅 Historical Comparison – Year-on-year tracking for better forecasting.
🏗️ Project-Ready – Designed for construction & real estate teams.
Managing inventory in the construction and real estate sector has never been easier! 🏗️🏢 Whether you’re handling multiple projects, tracking stock, or managing supplier deliveries, the Construction and Real Estate Inventory Management KPI Dashboard in Excel is your all-in-one solution. Designed for project managers, inventory controllers, procurement teams, and business owners, this tool helps you track key metrics, optimize stock levels, and avoid costly delays — all without the need for complex software.
Key Features of the Construction and Real Estate Inventory Management KPI Dashboard 🔑
📊 Comprehensive KPI Tracking – Monitor inventory turnover, stock-out rates, material usage, and delivery performance with ease.
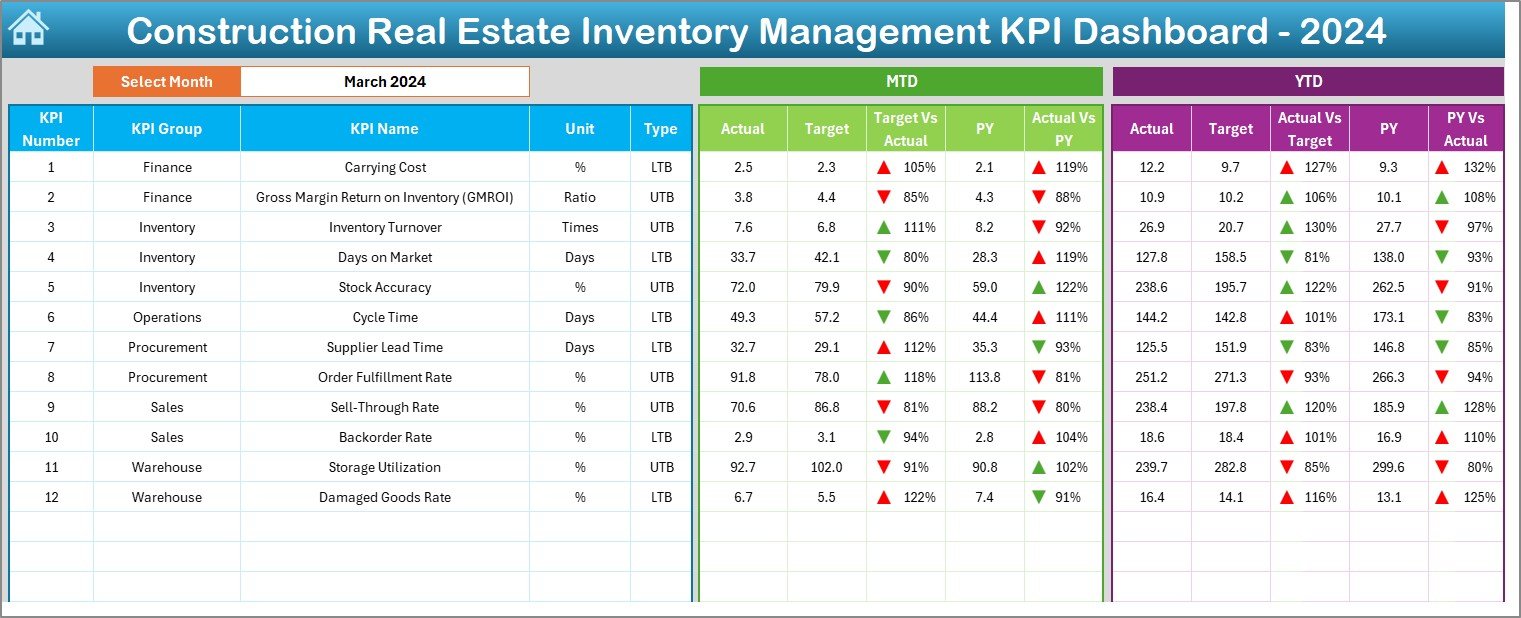
📈 Real-Time Performance Insights – Compare Month-to-Date (MTD) and Year-to-Date (YTD) data against targets and previous year values.
📂 Centralized Data Management – Store all your actual numbers, targets, and past data in one organized file.
🎯 Target vs Actual Analysis – Conditional formatting highlights variances instantly with intuitive up/down arrows.
🖱️ Easy Navigation – A Home Sheet with clickable buttons takes you directly to your desired section.
📅 Historical Data Comparison – Keep track of progress and trends using previous year’s data.
💡 Fully Customizable – Modify KPIs, layouts, and formats to match your specific project needs.
What’s Inside the Construction and Real Estate Inventory Management KPI Dashboard 📦
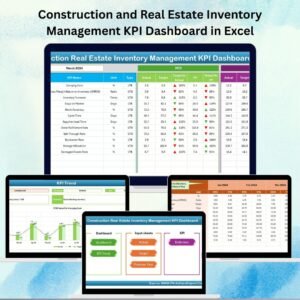
Construction and Real Estate Inventory Management KPI Dashboard
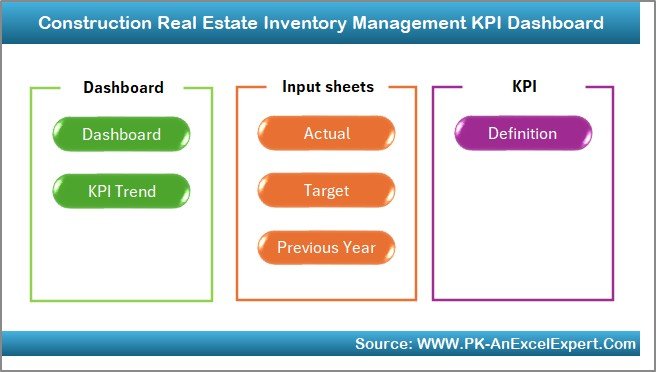
This Excel template includes seven powerful worksheets:
Home Sheet – Acts as your dashboard control center for quick navigation.
Dashboard Sheet – Displays all key metrics with MTD and YTD analysis.
KPI Trend Sheet – Allows in-depth analysis for any selected KPI with charts.
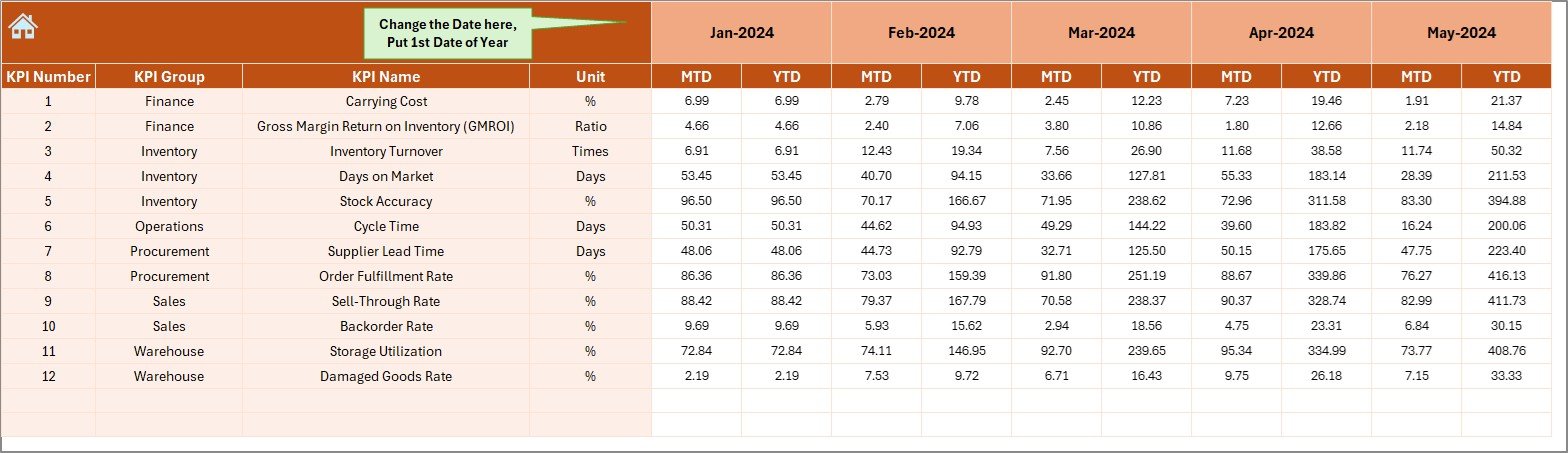
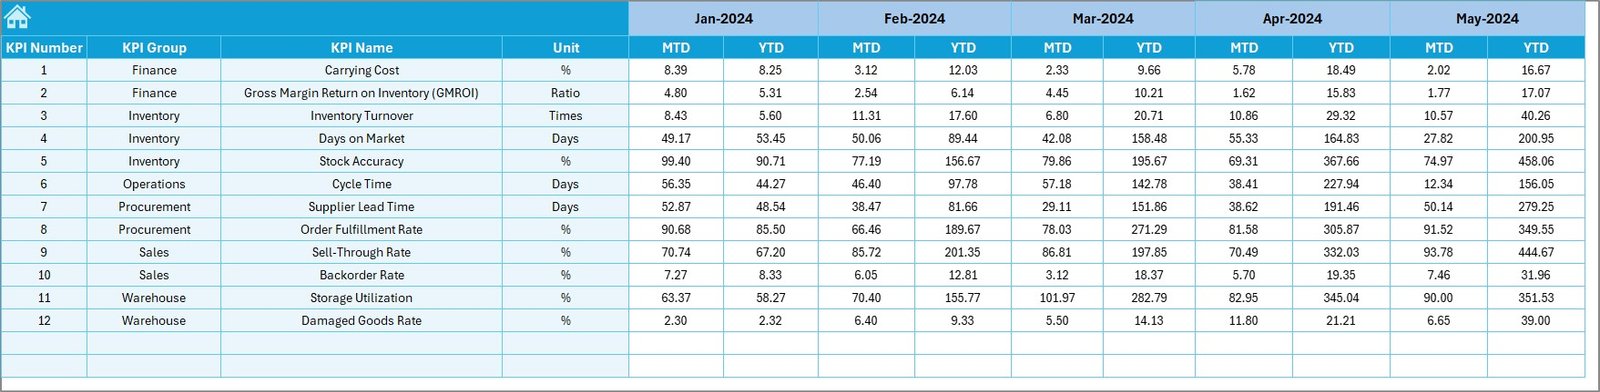
Actual Numbers Input – For entering monthly performance data.
Target Sheet – Stores MTD and YTD target values for each KPI.
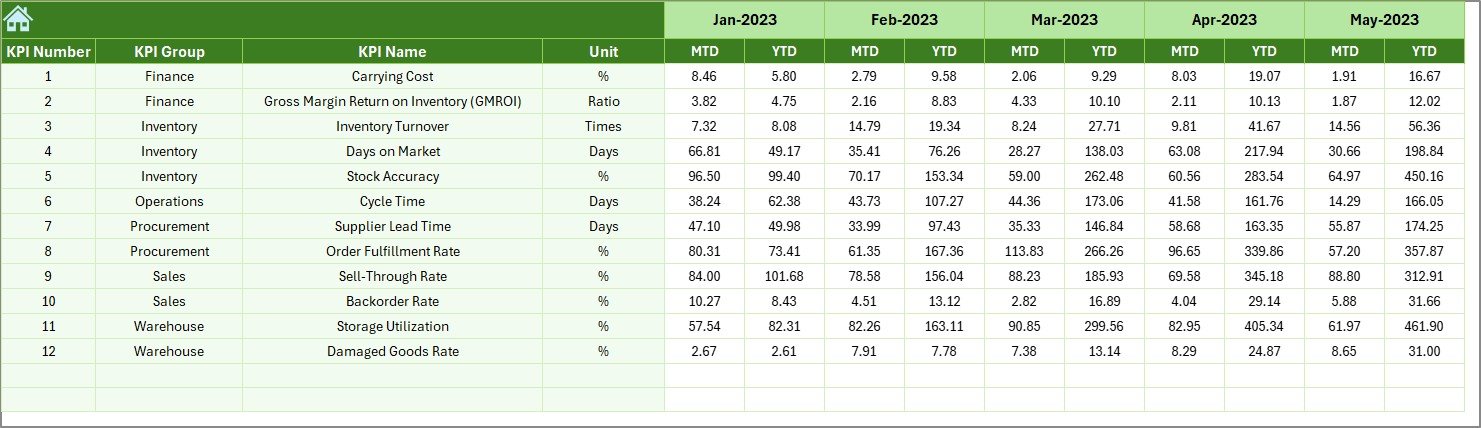
Previous Year Numbers – Keeps historical data for comparison.
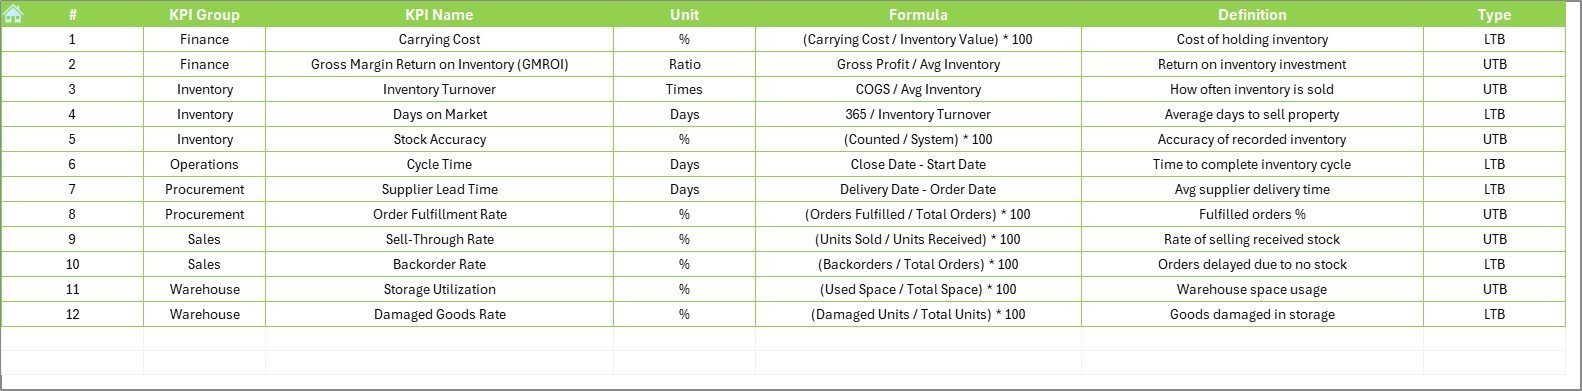
KPI Definition Sheet – Documents KPI formulas, units, and definitions for team clarity.
How to Use the Construction and Real Estate Inventory Management KPI Dashboard 🛠️
Start at the Home Sheet – Use the clickable buttons to access each section.
Enter Actual Data – Record monthly numbers in the Actual Numbers Input sheet.
Set Your Targets – Add MTD and YTD goals in the Target Sheet.
Add Previous Year Data – Fill in historical data for trend comparison.
View the Dashboard – Select your desired month from the drop-down menu to see live updates.
Analyze KPI Trends – Use the KPI Trend Sheet for deeper insights.
Take Action – Adjust purchasing, stock levels, or supplier schedules as needed.
Who Can Benefit from This Dashboard 👥
🏗️ Project Managers – Identify shortages before they delay timelines.
📦 Inventory Controllers – Track material usage and maintain optimal stock.
💰 Finance Teams – Compare inventory value against budget in real-time.
📑 Procurement Teams – Monitor supplier delivery performance.
🏢 Business Owners – Get a quick, visual overview of inventory health and costs.






























Reviews
There are no reviews yet.