

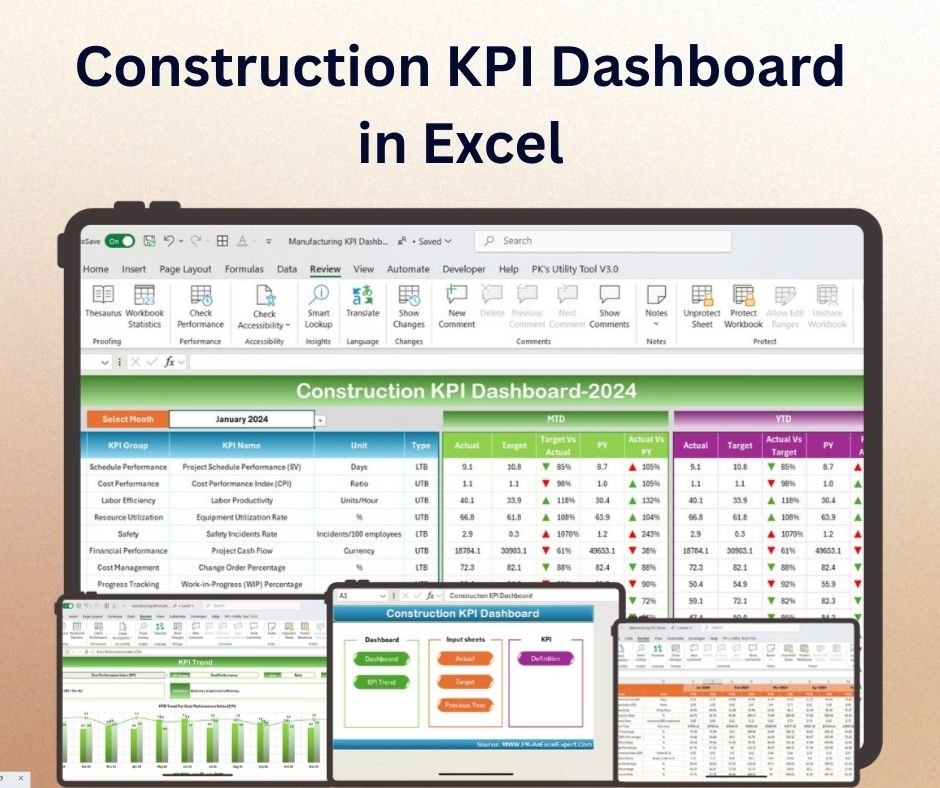



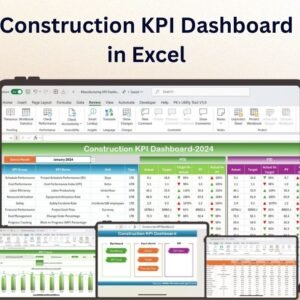
The Construction KPI Dashboard in Excel is an essential tool designed for construction managers, project leads, and executives to monitor and track the performance of various construction projects. This interactive Excel dashboard provides a clear and comprehensive view of critical construction KPIs (Key Performance Indicators), including project timelines, budget utilization, labor productivity, safety metrics, and resource management.
With easy-to-use visualizations, this dashboard allows you to stay on top of project performance, identify risks, and make informed decisions to keep projects on schedule and within budget. Whether you’re overseeing a single project or managing multiple construction sites, this tool helps you ensure that your resources are being utilized efficiently, safety standards are met, and project milestones are achieved. The customizable design allows you to tailor the dashboard to reflect the specific KPIs and goals of your construction projects.

Key Features of the Construction KPI Dashboard in Excel:
📊 Comprehensive KPI Tracking
Track essential construction project KPIs, including project progress, budget vs. actual costs, labor productivity, safety incidents, and more.
📅 Timeline Monitoring
Monitor project timelines and milestones, ensuring that each phase is completed on schedule and identifying any delays early on.
💰 Budget and Cost Tracking
Keep a close eye on your project’s budget by comparing planned vs. actual costs to ensure that the project stays within financial constraints.
👷♂️ Labor and Safety Metrics
Track labor efficiency and monitor safety incidents to ensure the well-being of workers and the timely completion of the project.
🎨 Customizable Layout
Easily customize the dashboard to suit your specific construction project, team, and key performance indicators, ensuring it meets your unique business needs.
Why You’ll Love the Construction KPI Dashboard in Excel:
✅ Centralized Project Monitoring – Keep track of all project-related KPIs in one dashboard, making it easy to manage and monitor progress across all aspects of your construction projects. ✅ Real-Time Data Updates – The dashboard updates in real-time, providing you with up-to-date insights into your project performance as new data is entered. ✅ Customizable for Your Project Needs – Tailor the dashboard to track specific KPIs relevant to your project’s goals, whether it’s budget, safety, labor, or timeline tracking. ✅ Clear Visual Insights – Use dynamic charts, graphs, and progress indicators to visualize key data points, making it easier to analyze project performance and spot any potential issues. ✅ Easy Setup and Use – The intuitive design ensures that even those with basic Excel knowledge can set up and use the dashboard to track their construction KPIs effectively.
What’s Inside the Construction KPI Dashboard in Excel:
- Construction KPIs – Track critical metrics such as project progress, budget tracking, safety performance, labor productivity, and more.
- Timeline Monitoring – Monitor key project milestones and track deadlines for each project phase.
- Cost and Budget Tracking – Visualize budget vs. actual costs and take necessary actions to control costs.
- Labor and Safety Metrics – Track labor efficiency and monitor safety incidents to ensure compliance with safety standards.
- Customizable Dashboard – Adjust the dashboard to reflect your project’s specific KPIs, metrics, and performance goals.
How to Use the Construction KPI Dashboard in Excel:
1️⃣ Download the Template – Access the Excel file after purchase for immediate use. 2️⃣ Input Your Project Data – Enter your construction project data, including timelines, costs, labor efficiency, and safety metrics. 3️⃣ Customize the Dashboard – Tailor the KPIs and visualizations to suit your specific project requirements. 4️⃣ Track Project Performance – Use the dashboard to monitor the progress, costs, safety, and labor of your construction project. 5️⃣ Make Informed Decisions – Leverage the real-time insights to make proactive decisions, optimize resources, and stay on track with project timelines and budgets.
Who Can Benefit from the Construction KPI Dashboard in Excel:
- Construction Project Managers
- Contractors
- Construction Business Owners
- Site Supervisors
- Safety Officers
- Anyone overseeing construction projects and needing to track performance
The Construction KPI Dashboard in Excel is the perfect solution for construction managers and teams looking to streamline project tracking, optimize resources, and make data-driven decisions. With its user-friendly design and customizable features, this tool provides a comprehensive view of your construction projects’ performance, helping you ensure that your projects are completed on time and within budget.
Click here to read the Detailed blog post
https://www.pk-anexcelexpert.com/construction-kpi-dashboard-in-excel/
Visit our YouTube channel to learn step-by-step video tutorials
Compatibility and Requirements
- Works in Microsoft Excel desktop (Excel 2016 or later, or Microsoft 365).
- The KPI views and charts are built into the workbook. Microsoft explains Excel charts in Create a chart from start to finish.
Frequently Asked Questions
Which construction KPIs does it track?
Project progress, budget vs actual costs, labor productivity, safety incidents and resource use.
Can I follow project milestones?
Yes. Timeline monitoring tracks milestones and deadlines for each project phase so delays show up early.
Does it compare planned and actual costs?
Yes. The budget section compares planned and actual costs so you can act before a project goes over budget.
Can I change the KPIs?
Yes. You can tailor the KPIs and charts to your own projects, team and goals.
Related Construction Templates
- Construction Dashboard in Excel: a chart-based construction project dashboard
- Construction Equipment KPI Dashboard in Excel: tracks equipment use, fuel and downtime
- Construction Safety KPI Dashboard in Excel: focuses on site safety KPIs
- Construction KPI Dashboard in Power BI: the same topic in Power BI
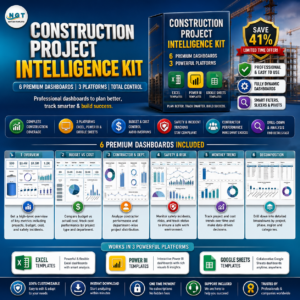
- Construction Project Intelligence Kit: 6 construction templates in one download
Browse all Excel KPI dashboards or the Excel project management templates.























Reviews
There are no reviews yet.