


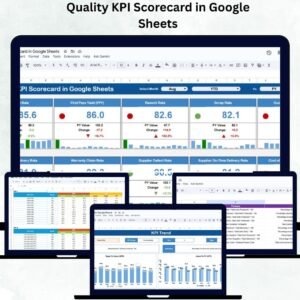
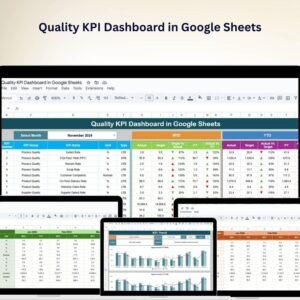
The Quality KPI Dashboard in Google Sheets is an essential tool for businesses looking to monitor and improve their quality management processes. With this dynamic dashboard, organizations can track key quality performance indicators (KPIs), identify areas for improvement, and make data-driven decisions that enhance product and service quality.
By leveraging this tool, businesses can gain real-time insights into critical quality metrics, including defect rates, process compliance, and customer satisfaction. This allows managers to act quickly on quality issues and optimize processes for better outcomes.

Key Features of the Quality KPI Dashboard in Google Sheets
📊 Comprehensive Quality Monitoring
-
Defect Tracking: Track the number and types of defects to identify recurring issues and prioritize corrective actions.
-
Process Compliance: Ensure adherence to quality standards and procedures by monitoring compliance rates.
-
Customer Feedback Analysis: Collect and analyze customer feedback to gauge the quality of products or services, helping to improve customer satisfaction.
📈 Real-Time Data Visualization
-
Interactive Charts and Graphs: Use customizable visualizations like bar charts, pie charts, and line graphs to represent quality data, making trends easier to spot and analyze.
-
Dynamic Dashboards: Dashboards update in real-time as data is entered, ensuring your insights are always up to date and accurate.
🖥 User-Friendly Interface
-
Intuitive Design: The dashboard is designed for easy navigation, enabling users with different levels of technical expertise to understand and interpret data effectively.
-
Customizable Layouts: Personalize the dashboard to focus on specific KPIs or quality metrics that matter most to your organization.
🔒 Data Integrity and Security
-
Cloud-Based Accessibility: Access your dashboard securely from anywhere, making it easy to stay connected and monitor quality performance remotely.
-
Permission Settings: Control access to sensitive quality data by setting user permissions, ensuring data integrity and privacy.
Benefits of Using the Quality KPI Dashboard in Google Sheets
✅ Enhanced Decision-Making
Real-time data and visual analytics allow managers to make well-informed decisions quickly, improving the agility of quality management operations.
✅ Improved Quality Management
The ability to monitor key quality metrics continuously helps identify problems early and take corrective actions to enhance overall product and service quality.
✅ Operational Efficiency
Automated tracking of quality data reduces manual efforts and minimizes errors, streamlining quality management tasks and improving efficiency.
✅ Strategic Planning
Comprehensive insights into quality performance support the development of long-term strategies that align with your business goals and promote continuous improvement.
Conclusion
The Quality KPI Dashboard in Google Sheets is an indispensable tool for organizations looking to improve their quality management practices. By providing real-time insights, customizable features, and powerful data-driven analytics, this dashboard enables businesses to monitor and enhance quality effectively. Using this tool, companies can improve product and service quality, streamline processes, and make informed decisions that drive business success.
Click here to read the Detailed blog post
Quality KPI Dashboard in Google Sheets
Visit our YouTube channel to learn step-by-step video tutorials
YouTube.com/@PKAnExcelExpert


Reviews
There are no reviews yet.