


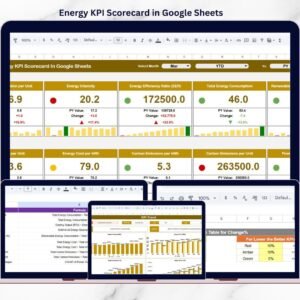
The Mobile App Performance KPI Dashboard in Google Sheets is an essential tool designed for developers, product managers, and marketers to track the critical performance metrics of a mobile app. From user acquisition and retention to in-app activities and revenue generation, this customizable template provides a centralized location for analyzing key performance indicators (KPIs) in real time. With detailed data visualizations and easy-to-use features, the dashboard helps you make data-driven decisions to improve your app’s performance.

🔑 Key Features of the Mobile App Performance KPI Dashboard:
-
Real-Time Data Updates: The dashboard automatically updates when new data is entered, ensuring you always have the latest performance metrics.
-
Customizable Metrics: Track a wide range of KPIs, including user acquisition, retention rates, in-app activity, and revenue, and modify the template to suit your specific app needs.
-
Comprehensive Data Views: Monitor your app’s performance through month-to-date (MTD), year-to-date (YTD), and previous year data comparisons.
-
Easy Navigation: With dropdowns for month selection and intuitive charts, the dashboard is easy to navigate, making it simple to track performance at different intervals.
-
Visual Performance Tracking: Use conditional formatting to quickly see how actual performance compares to targets and historical data, with up/down arrows and color-coded indicators.
What’s Inside the Mobile App Performance KPI Dashboard 📅📈
This Mobile App Performance KPI Dashboard includes six powerful worksheets, each tailored to track a different aspect of your app’s performance:
-
Dashboard Sheet: This is the main sheet where all key KPIs are displayed. It includes:
-
Month Selector: Choose the month to update the data for that period, with MTD and YTD performance tracked.
-
KPI Performance: View actual performance data for metrics such as user acquisition, retention, and in-app activity.
-
Target vs. Actual Comparison: Visualize performance against targets and previous year data using color-coded arrows and charts.
-
-
KPI Trend Sheet: Track specific KPIs over time with a detailed view of historical data for each metric.
-
KPI Dropdown: Select a KPI to track its historical performance and trends.
-
KPI Details: View information about the KPI group, unit of measure, whether the KPI is “Lower the Better” (LTB) or “Upper the Better” (UTB), and its formula.
-
-
Actual Numbers Sheet: Input actual data for each KPI to keep your dashboard up-to-date.
-
MTD and YTD Input: Enter your actual numbers for the month and year to track real-time performance.
-
Month Selector: Select the first month of the year to dynamically update the data.
-
-
Target Sheet: Set targets for each KPI to compare actual performance against your business goals.
-
Monthly and YTD Targets: Input the target values for each KPI, ensuring you have clear goals for performance tracking.
-
-
Previous Year Number Sheet: Enter last year’s data to compare performance trends year-over-year.
-
Historical Comparison: Assess current performance against the previous year to track progress and identify areas for improvement.
-
-
KPI Definition Sheet: This sheet provides definitions and formulas for each KPI used in the dashboard, ensuring consistency and clarity in tracking.
-
KPI Name, Group, Unit: Define each metric’s name, group, and measurement unit.
-
Formula and Definition: Include the formula used to calculate each KPI and provide detailed definitions for clarity.
-
How to Use the Mobile App Performance KPI Dashboard 📉📋
To make the most of the Mobile App Performance KPI Dashboard, follow these simple steps:
-
Download and Open the Template: Access the Google Sheets template and begin inputting your app’s data.
-
Input Actual Numbers: Enter MTD and YTD performance data into the Actual Numbers Sheet to keep the dashboard current.
-
Set Targets: Input your targets in the Target Sheet for each KPI to monitor whether your app is meeting performance goals.
-
Track Progress: Use the Dashboard Sheet to monitor your app’s performance in real-time and compare it against targets and historical data.
-
Analyze Trends: Leverage the KPI Trend Sheet to visualize how each KPI performs over time and identify areas for improvement.
Who Can Benefit from This Mobile App Performance KPI Dashboard? 📲📊
This dashboard is designed for developers, product managers, and marketers who need to track and optimize their mobile app’s performance. It’s perfect for anyone involved in the app development lifecycle, from monitoring user engagement to analyzing revenue generation.
-
App Developers: Track user acquisition and engagement metrics to identify areas where your app can be improved.
-
Product Managers: Use the dashboard to make data-driven decisions and prioritize features or updates based on real-time performance.
-
Marketers: Monitor marketing campaign effectiveness and track key metrics like user retention and customer lifetime value.
-
Business Owners: Get a high-level view of your app’s performance to ensure it’s meeting financial and operational goals.
Advantages of Using the Mobile App Performance KPI Dashboard 📈📉
-
Comprehensive Performance Tracking: Track key app metrics such as user acquisition, retention, revenue, and user engagement in one place.
-
Real-Time Monitoring: Input data and get immediate insights into how your app is performing, allowing you to make adjustments quickly.
-
Customizable for Your App: Tailor the dashboard to your app’s unique KPIs and business goals.
-
Data-Driven Decisions: Make informed decisions based on actual data, trends, and comparisons with targets and past performance.
-
Improved User Experience: By monitoring key user metrics, you can identify pain points and areas for improvement, leading to a better user experience and higher retention.
Click here to read the Detailed Blog Post 📖
Watch the step-by-step video Demo:


Reviews
There are no reviews yet.