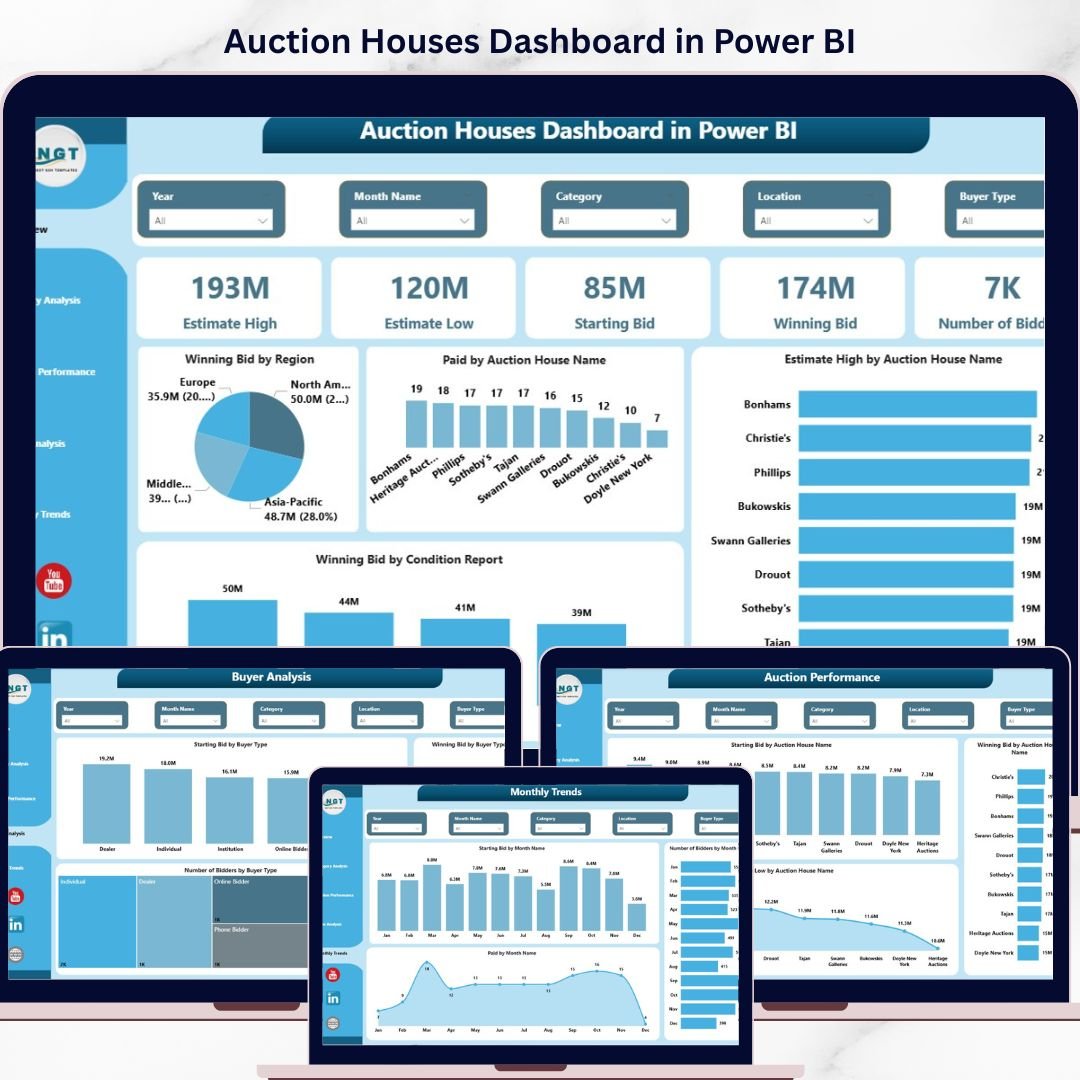

In the fast-moving auction industry, staying ahead of competitors requires more than just managing bids—it requires data-driven decision-making. Auction houses deal with multiple auctions, bidders, categories, and fluctuating prices. However, when this data is scattered across spreadsheets, it becomes difficult to track performance and uncover valuable insights.
👉 So, how can you simplify auction management and boost profitability effortlessly?
🚀 The answer is the Auction Houses Dashboard in Power BI.
This powerful and interactive dashboard transforms complex auction data into clear, actionable insights. As a result, auctioneers, analysts, and business owners can make faster, smarter, and more profitable decisions.
🔑 Key Features of Auction Houses Dashboard in Power BI
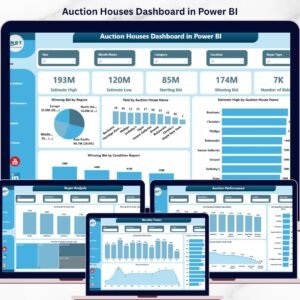
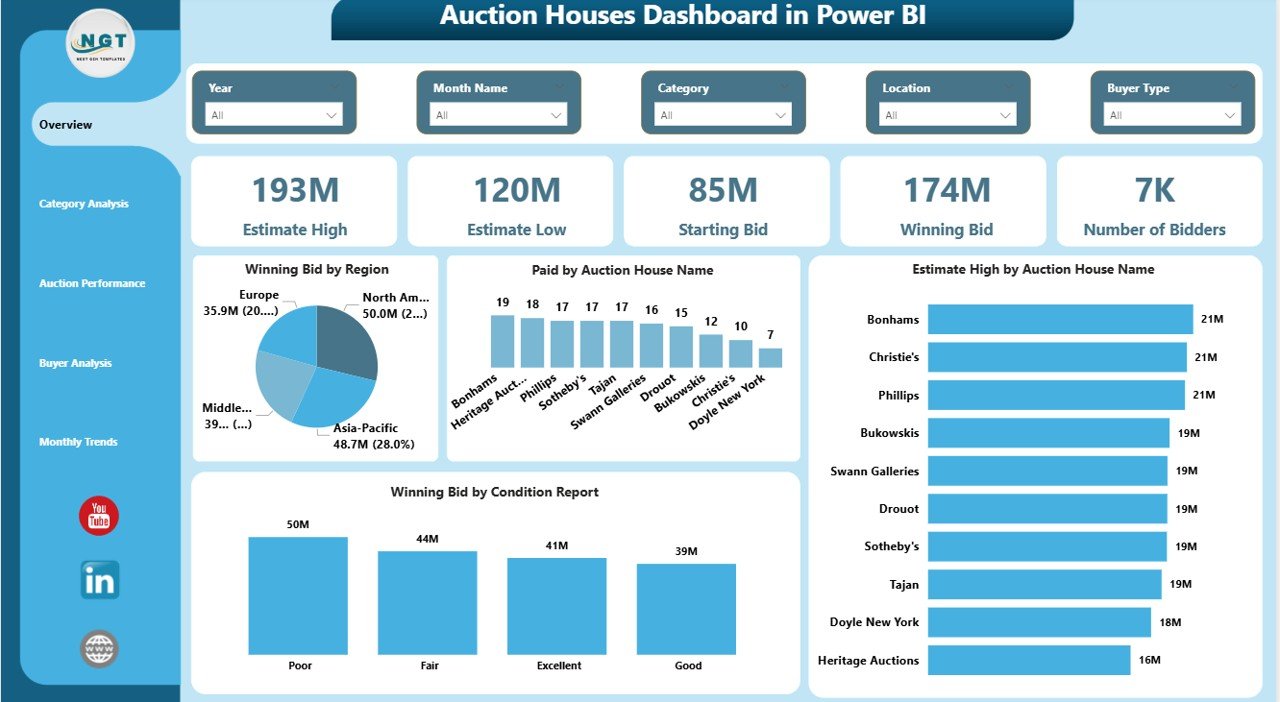
✨ 📊 Interactive Overview Dashboard – Instantly view key KPIs like Estimate High, Starting Bid, Winning Bid, and Number of Bidders.
✨ 🌍 Region & Auction Insights – Analyze winning bids by region and evaluate auction house performance easily.
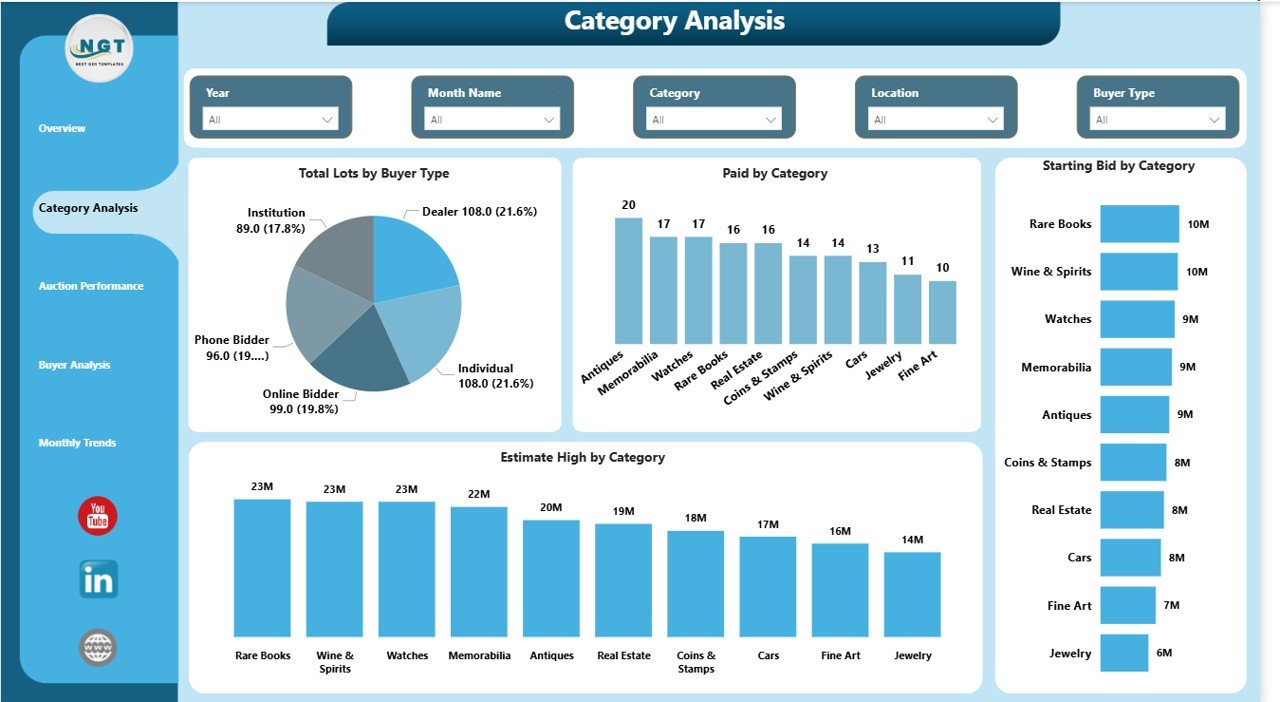
✨ 📦 Category Performance Analysis – Identify top-performing categories and optimize your auction inventory.
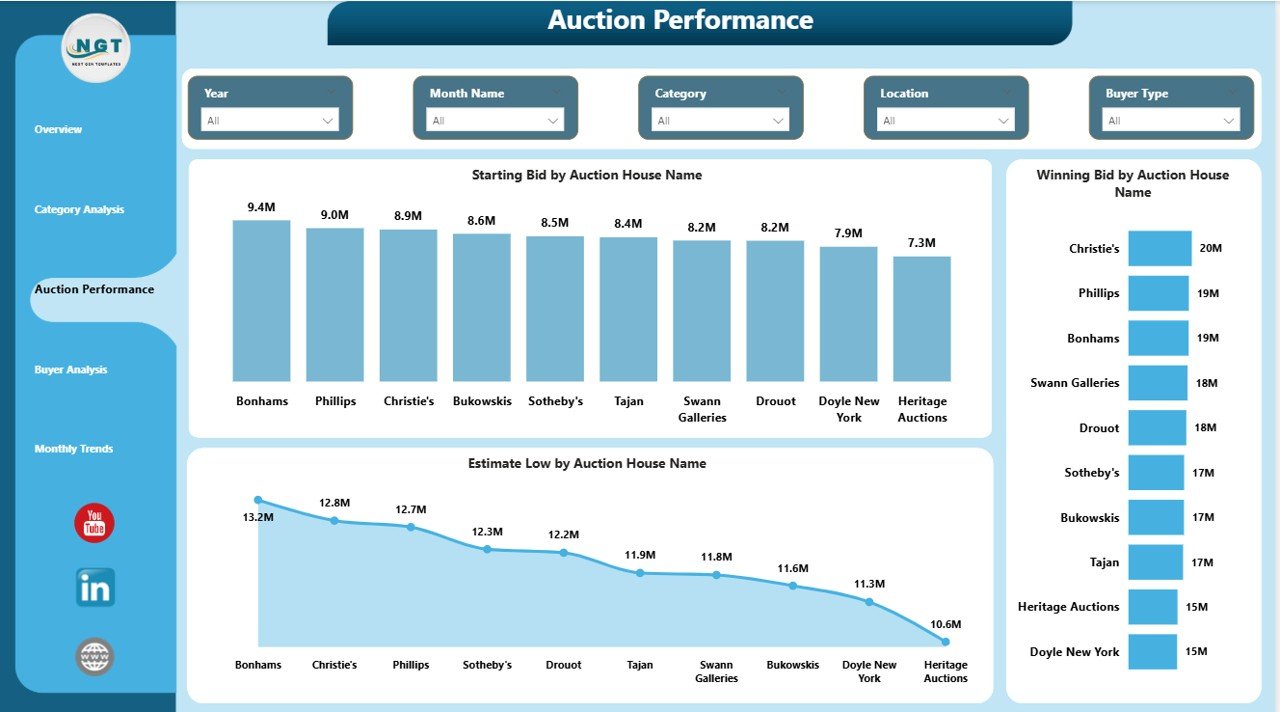
✨ 🏆 Auction Performance Tracking – Compare auctions and uncover high-performing events.
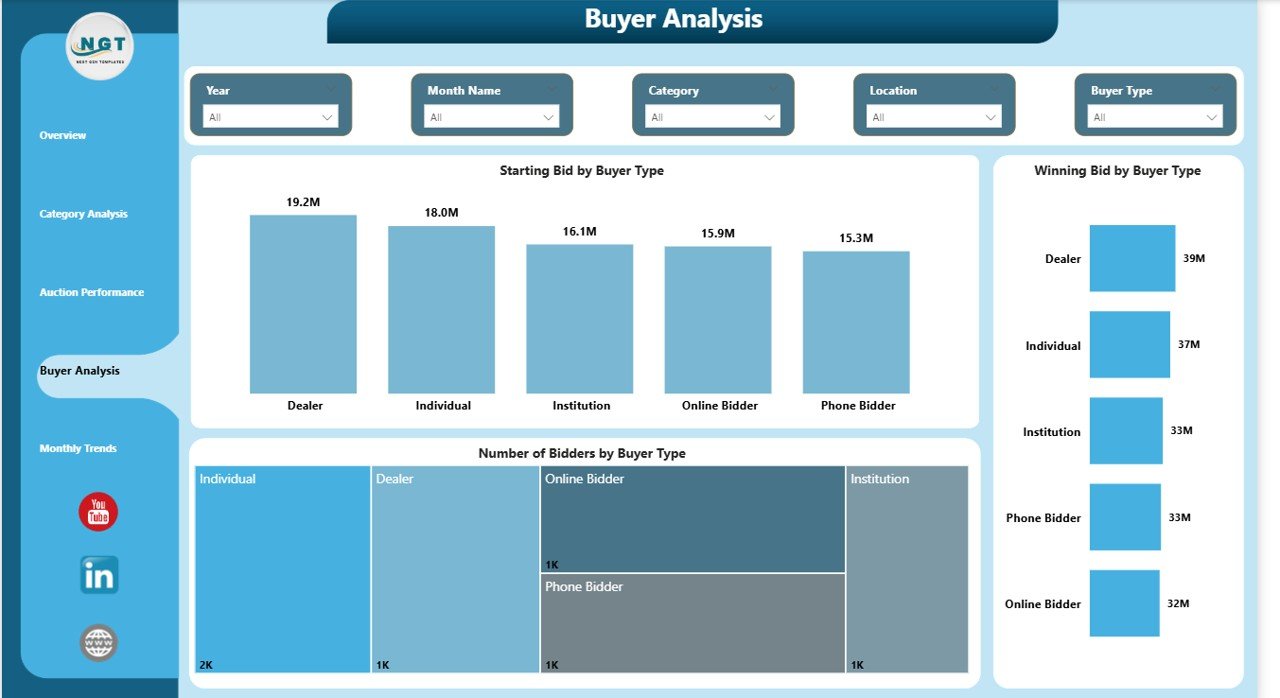
✨ 👥 Buyer Behavior Analysis – Understand bidder participation, preferences, and trends.
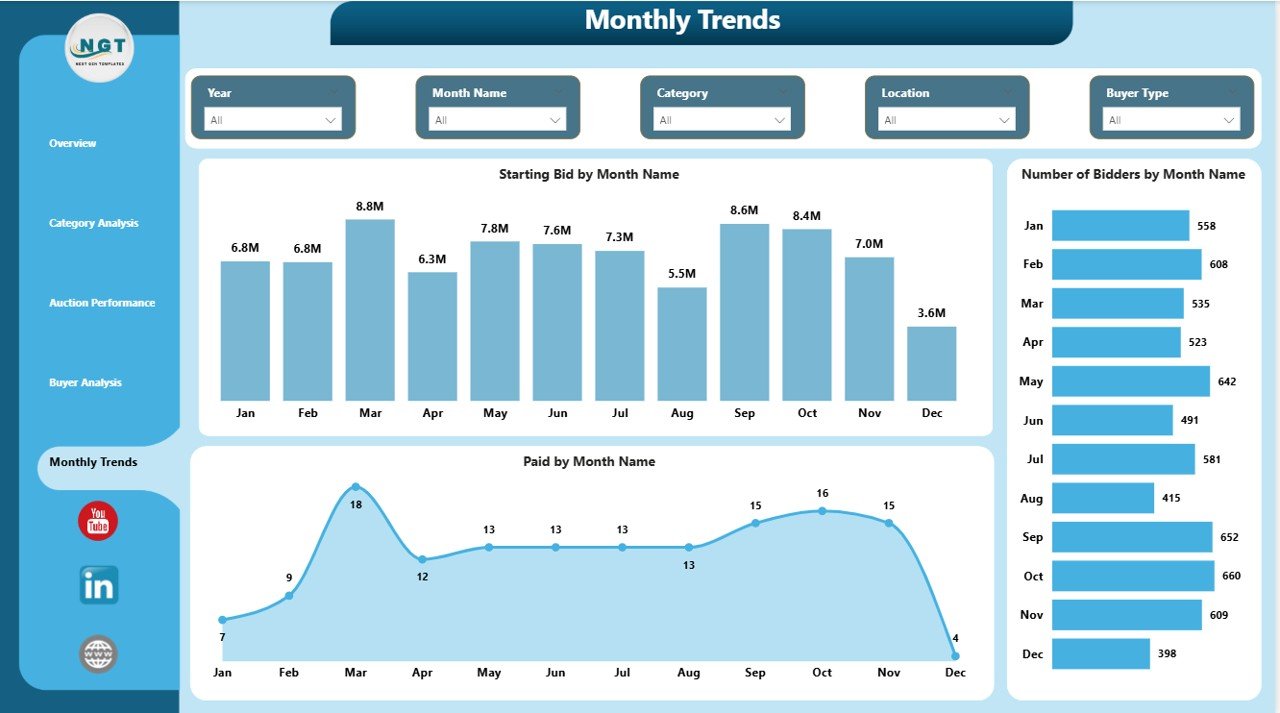
✨ 📅 Monthly Trend Analysis – Track auction activity over time and identify seasonal patterns.
✨ 🎛️ Advanced Filters & Slicers – Drill down into data by auction name, buyer type, category, and more.
✨ ⚡ Real-Time Data Visualization – Convert raw data into meaningful insights instantly.
📁 What’s Inside the Auction Houses Dashboard in Power BI
📌 5 Fully Interactive Pages designed for complete auction analysis:
👉 Overview Page – Get a quick snapshot with KPI cards and performance charts.
👉 Category Analysis – Evaluate category-wise performance and buyer trends.
👉 Auction Performance – Compare auction houses and individual auctions.
👉 Buyer Analysis – Analyze bidder behavior and participation patterns.
👉 Monthly Trend – Track bids, payments, and participation over time.
📊 Key Metrics Included:
- Winning Bid Value
- Starting Bid Amount
- Estimate High & Low
- Number of Bidders
- Paid Amount
- Category Performance
⚙️ How to Use the Auction Houses Dashboard in Power BI
Using this dashboard is simple and effective:
1️⃣ Import Your Data – Add auction data such as bids, buyers, and categories.
2️⃣ Refresh the Dashboard – Let Power BI process and visualize the data.
3️⃣ Apply Filters – Use slicers to focus on specific auctions or categories.
4️⃣ Analyze Insights – Identify trends, patterns, and performance gaps.
5️⃣ Take Action – Optimize bidding strategies and improve auction outcomes.
💡 With just a few clicks, you can turn raw data into powerful insights.
🎯 Who Can Benefit from This Auction Houses Dashboard in Power BI
👨⚖️ Auction Houses & Auctioneers – Track auction success and optimize strategies.
📊 Business Analysts – Gain deep insights into auction performance.
📈 Auction Managers – Monitor operations and improve efficiency.
🧠 Data Analysts – Analyze trends and buyer behavior.
🖼️ Art & Antique Dealers – Evaluate category performance and pricing trends.
👉 In short, anyone involved in auctions can use this dashboard to improve performance and profitability.
💡 Why This Dashboard is a Game-Changer?
✔️ Eliminates manual reporting
✔️ Reduces errors and data confusion
✔️ Improves bidding strategies
✔️ Enhances buyer understanding
✔️ Saves time with automation
🚀 Take control of your auction data and unlock powerful insights today!
📖 Click here to read the Detailed blog post
Watch the step-by-step video tutorial:
▶️ Visit our YouTube channel to learn step-by-step video tutorials
👉 https://www.youtube.com/@PKAnExcelExpert
Compatibility and Requirements
- Works in Power BI Desktop, which is free to download from Microsoft.
- Power BI Desktop runs on Windows. Microsoft explains how to install it in Get Power BI Desktop.
Frequently Asked Questions
How many pages does the dashboard have?
Five pages: Overview, Category Analysis, Auction Performance, Buyer Analysis and Monthly Trend.
Which metrics does it show?
Winning Bid Value, Starting Bid Amount, Estimate High and Low, Number of Bidders, Paid Amount and Category Performance.
Can I filter by auction or category?
Yes. Slicers let you narrow the data by auction name, buyer type, category and more.
What data do I need to add?
Import your auction data, such as bids, buyers and categories. Then refresh the dashboard and Power BI updates the visuals.
Is there an Excel version?
Yes. See the Auction Houses Dashboard in Excel.
Related Auction Templates
- Auction Houses Dashboard in Excel: the same dashboard in Excel
- Auction Houses KPI Dashboard in Power BI: a KPI-focused Power BI view
- Auction Houses KPI Dashboard in Excel: KPI tracking for auction houses in Excel
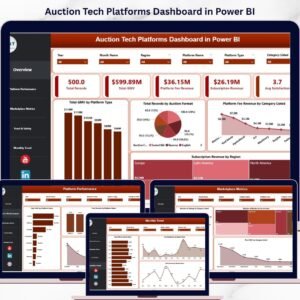
- Auction Tech Platforms Dashboard in Power BI: a dashboard for online auction platforms
- Power BI Dashboard Mega Collection: 15 Power BI dashboard templates in one download
Browse all Power BI dashboards.