In today’s fast-paced digital marketplace, auction platforms generate massive volumes of data every single day. However, when this data is scattered across multiple systems, it becomes difficult to track performance and make informed decisions.
So, how can you monitor KPIs, optimize revenue, and improve customer satisfaction—all in one place?
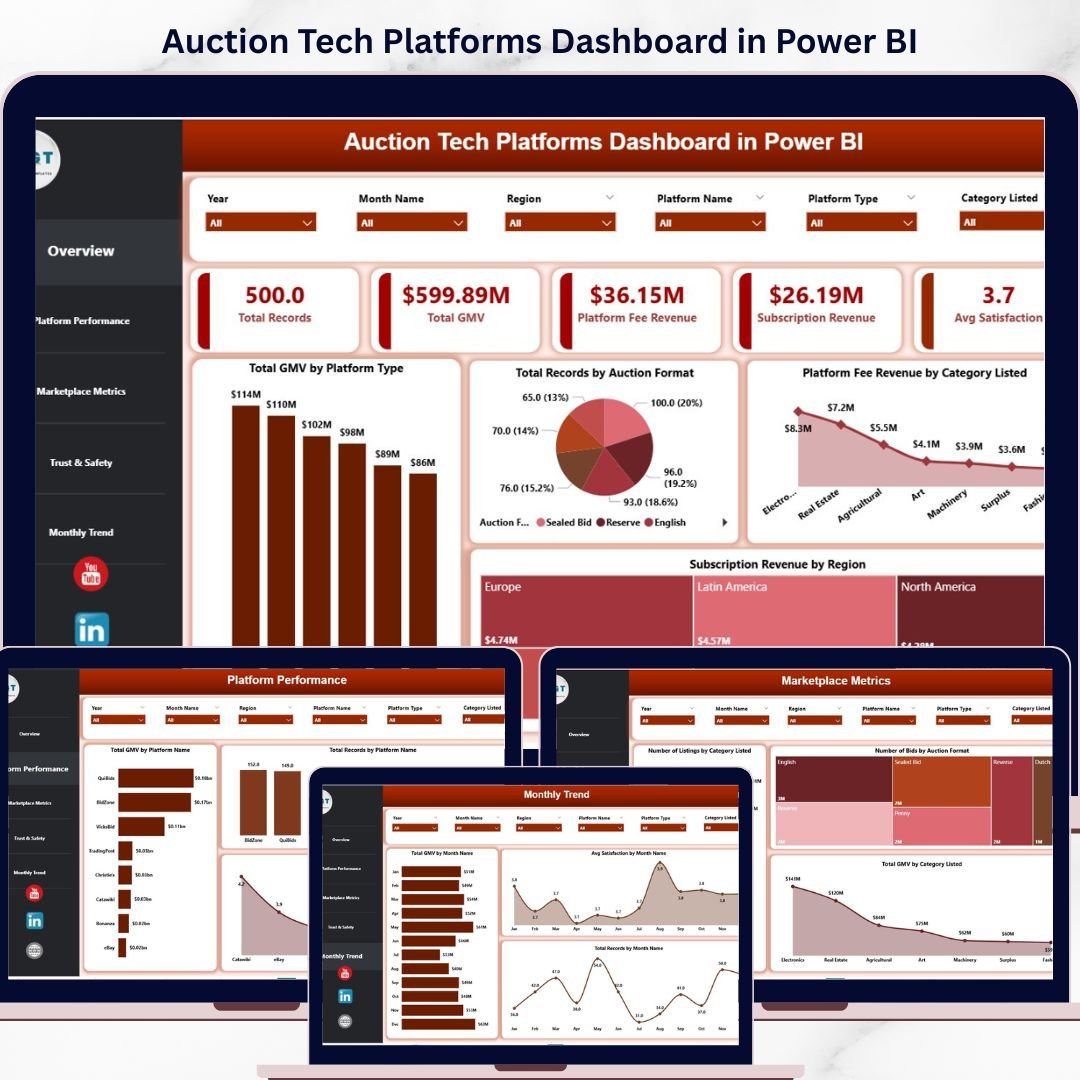
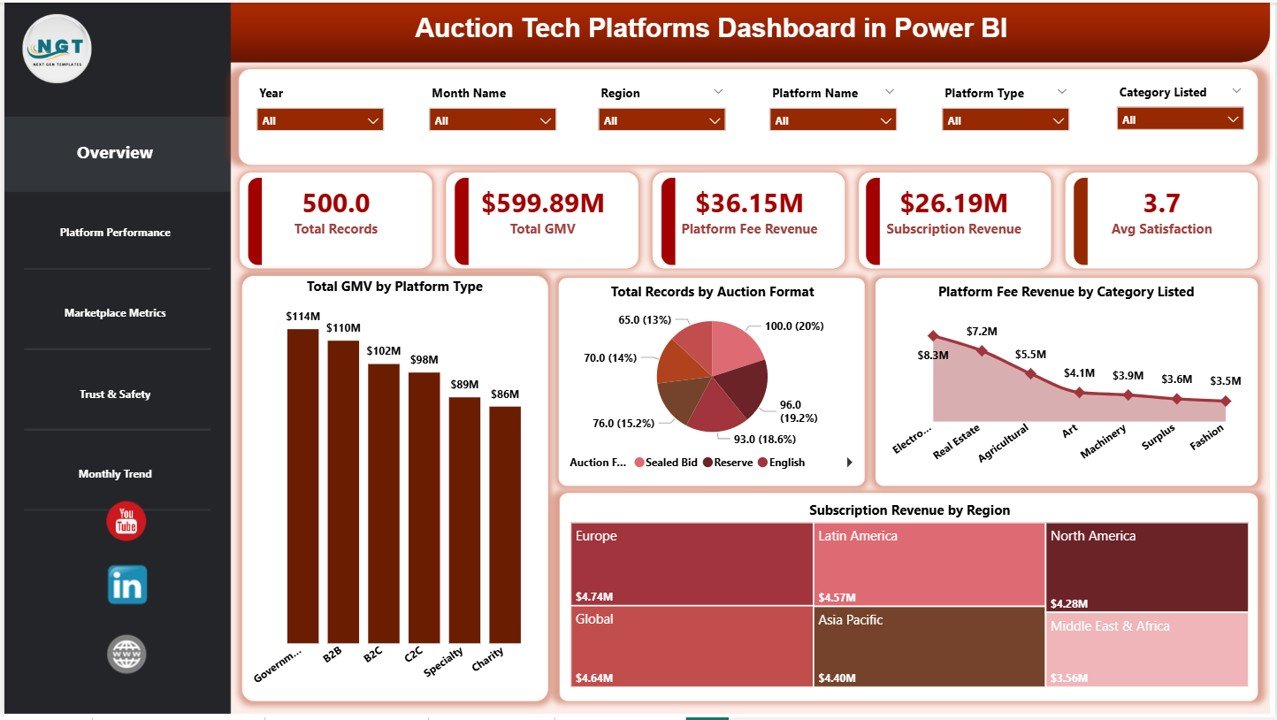
👉 The answer is the Auction Tech Platforms Dashboard in Power BI.
This powerful, interactive dashboard transforms complex auction data into clear, actionable insights. As a result, you can make faster decisions, improve operational efficiency, and scale your platform with confidence.
🔑 Key Features of Auction Tech Platforms Dashboard in Power BI
✨ Real-Time KPI Tracking – Monitor GMV, revenue streams, and performance metrics instantly
📊 Interactive Visualizations – Convert complex data into easy-to-understand charts
🎯 Revenue Insights – Track platform fees, subscription income, and category performance
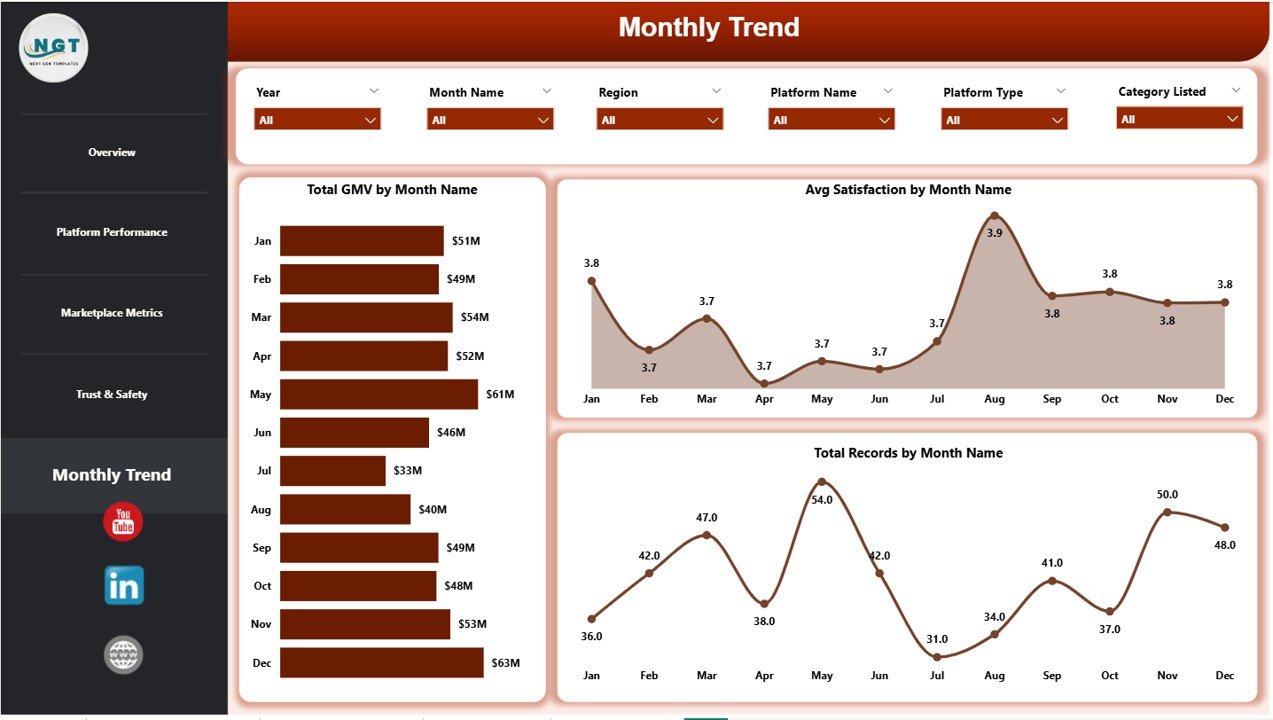
📈 Trend Analysis – Identify seasonal trends and performance patterns over time
🧩 5 Advanced Dashboard Pages – Cover all aspects of auction platform analytics
😊 Customer Satisfaction Tracking – Measure user experience across regions
🔍 Deep Performance Insights – Analyze platform-wise and category-wise performance
⚡ Fast Decision-Making – Get instant insights for smarter strategies
📦 What’s Inside the Auction Tech Platforms Dashboard in Power BI
This ready-to-use dashboard includes 5 powerful analytical pages designed for complete business visibility:
📊 Overview Page – Get a complete snapshot with KPI cards like Total GMV, Revenue, and Satisfaction
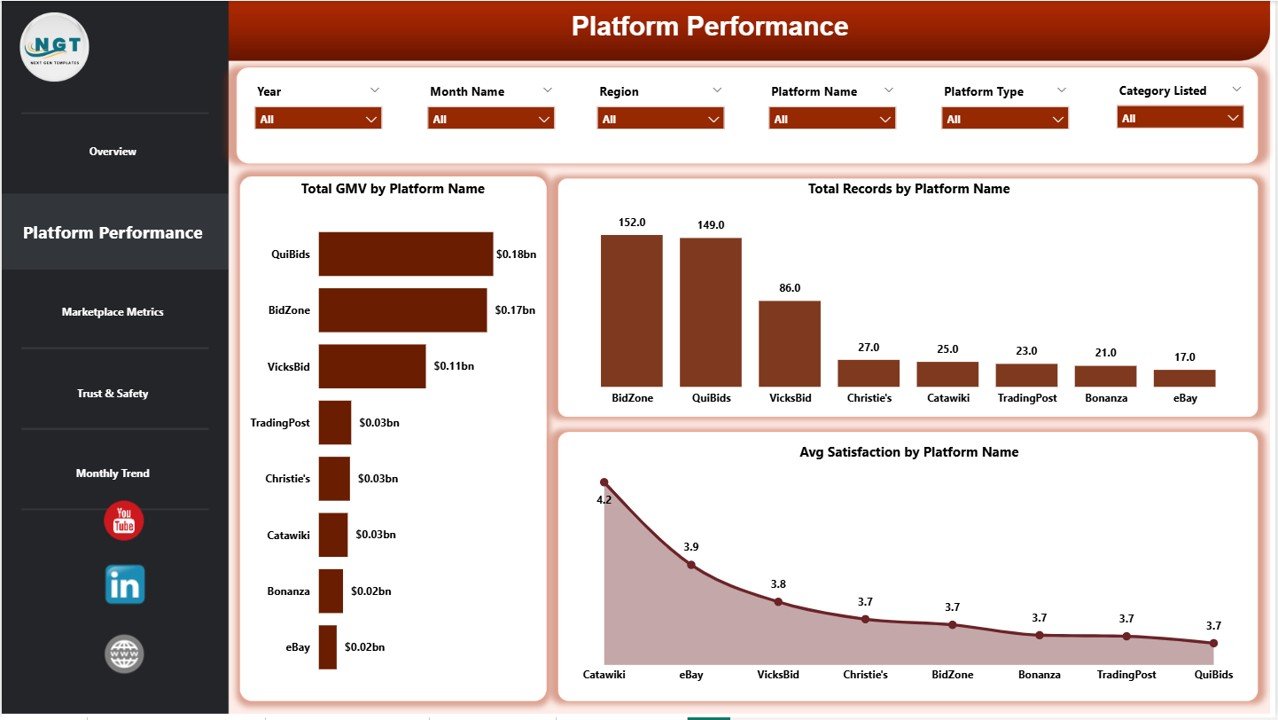
📈 Platform Performance – Analyze platform-wise GMV, records, and satisfaction scores
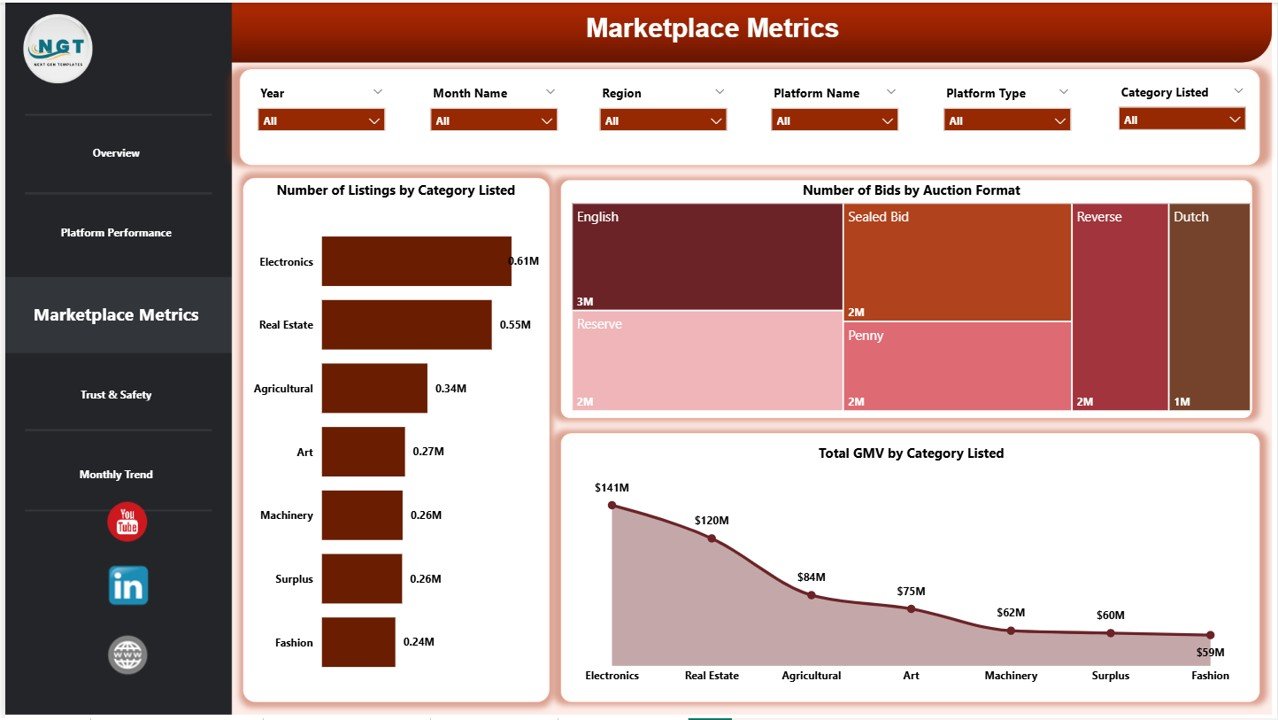
🛒 Marketplace Metrics – Track listings, bids, and category performance
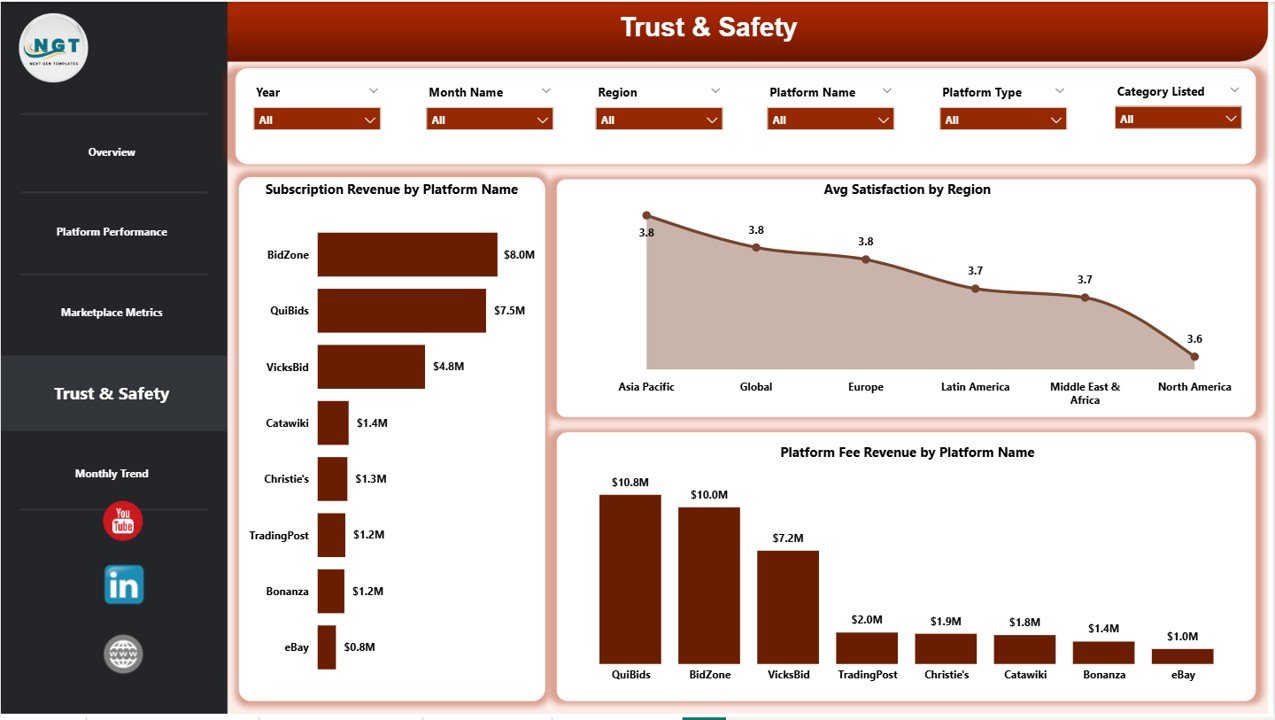
🔐 Trust & Safety – Monitor customer satisfaction and platform reliability
📅 Monthly Trends – Identify trends and patterns across different time periods
👉 Therefore, you get a complete 360° view of your auction business.
🛠️ How to Use the Auction Tech Platforms Dashboard in Power BI
Using this dashboard is simple, even for beginners:
📥 Import Your Data – Upload data from Excel or databases into Power BI
🔗 Connect Data Sources – Ensure all datasets are linked correctly
🎛️ Use Interactive Filters – Select platforms, regions, or time periods
📊 Analyze KPI Cards – Quickly review overall performance
🔍 Explore Detailed Pages – Dive deeper into platform and marketplace insights
📈 Track Trends – Use monthly analysis to plan future strategies
👉 As a result, you can easily turn raw data into meaningful insights.
👥 Who Can Benefit from This Auction Tech Platforms Dashboard in Power BI
This dashboard is perfect for:
🏢 Auction Platform Owners – Track performance and increase profitability
📊 Business Analysts – Analyze trends and generate actionable insights
💼 E-commerce Businesses – Monitor marketplace activity and optimize listings
📈 Operations Managers – Improve efficiency and decision-making
🚀 Startups & Enterprises – Scale operations with data-driven strategies
👉 Whether you are a small business or a large enterprise, this dashboard helps you grow faster.
With this dashboard, you no longer need to rely on scattered spreadsheets or manual reporting. Instead, you get a centralized, intelligent system that empowers you to monitor, analyze, and optimize your auction platform effortlessly.
Moreover, it helps you identify high-performing categories, improve bidding strategies, and enhance customer satisfaction. Therefore, you can consistently increase your revenue and stay ahead of competitors.
If you are serious about scaling your auction platform and making smarter business decisions, this dashboard is a must-have tool. 🚀
📖 Click here to read the Detailed blog post
🎥 Visit our YouTube channel to learn step-by-step video tutorials
👉 https://www.youtube.com/@PKAnExcelExpert


