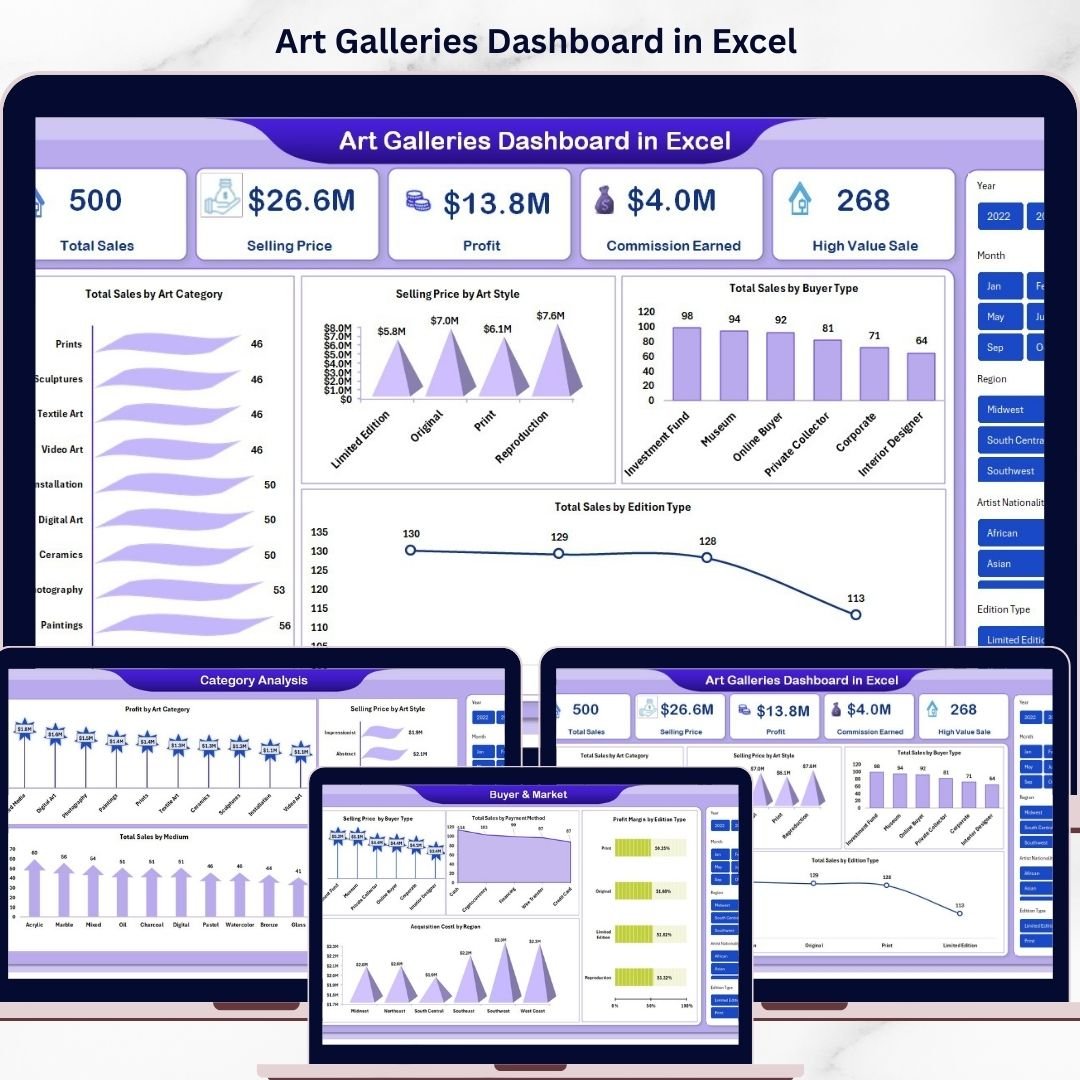

In today’s competitive art industry, relying only on creativity is no longer enough. You need data-driven insights to understand what sells, who buys, and how your gallery performs. That’s exactly why the Art Galleries Dashboard in Excel is a must-have tool for modern art professionals.
This ready-to-use, interactive Excel dashboard helps you track sales, profit, buyer trends, and exhibition performance—all in one place. Instead of juggling multiple spreadsheets, you get a centralized system that transforms raw data into meaningful insights.
Whether you are a gallery owner, curator, or art investor, this dashboard empowers you to make smarter decisions, faster actions, and higher profits 🚀
✨ Key Features of Art Galleries Dashboard in Excel
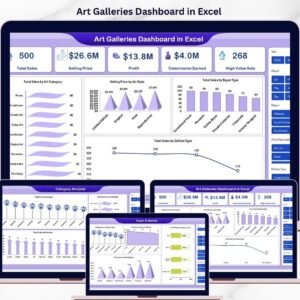
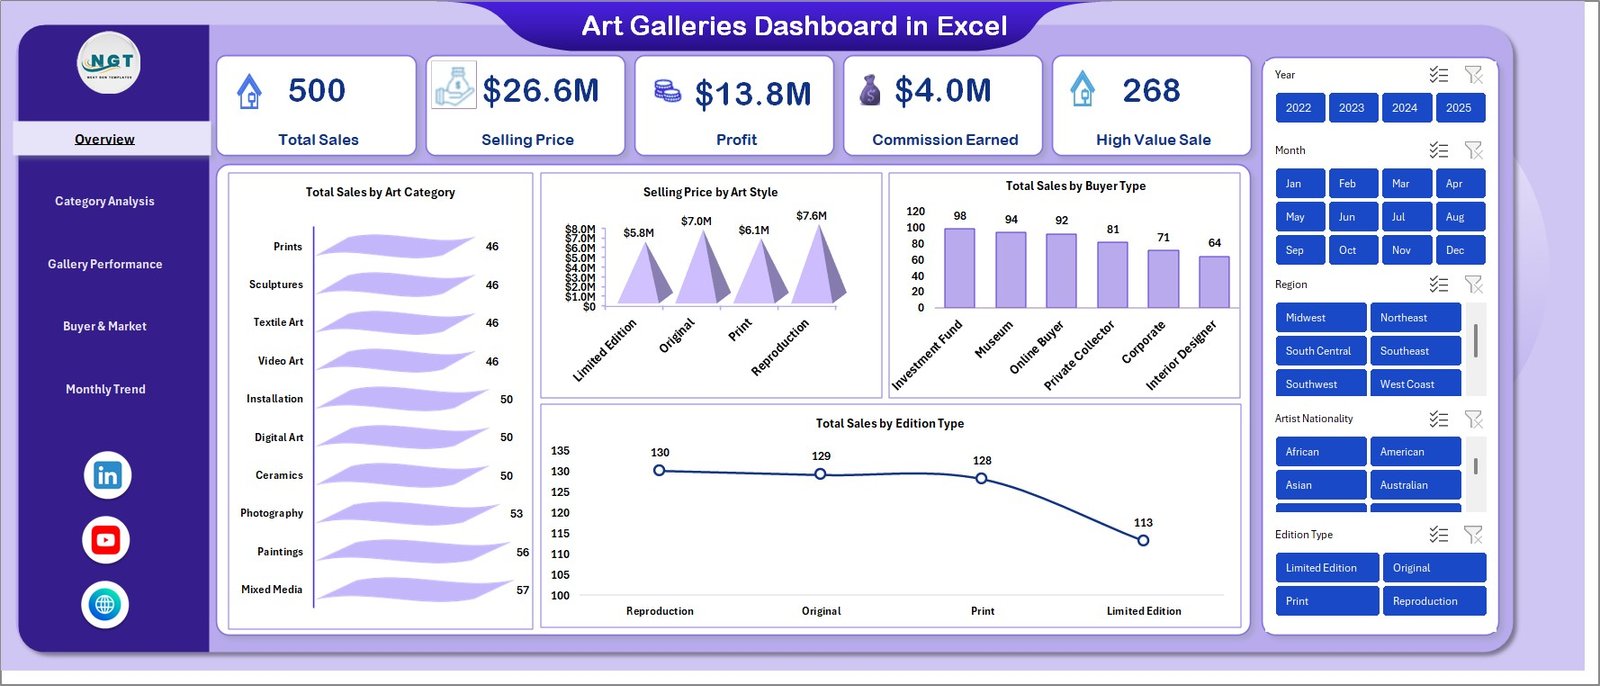
📊 All-in-One Overview Dashboard – Instantly view Total Sales, Selling Price, Profit, Commission Earned, and High Value Sales in one screen.
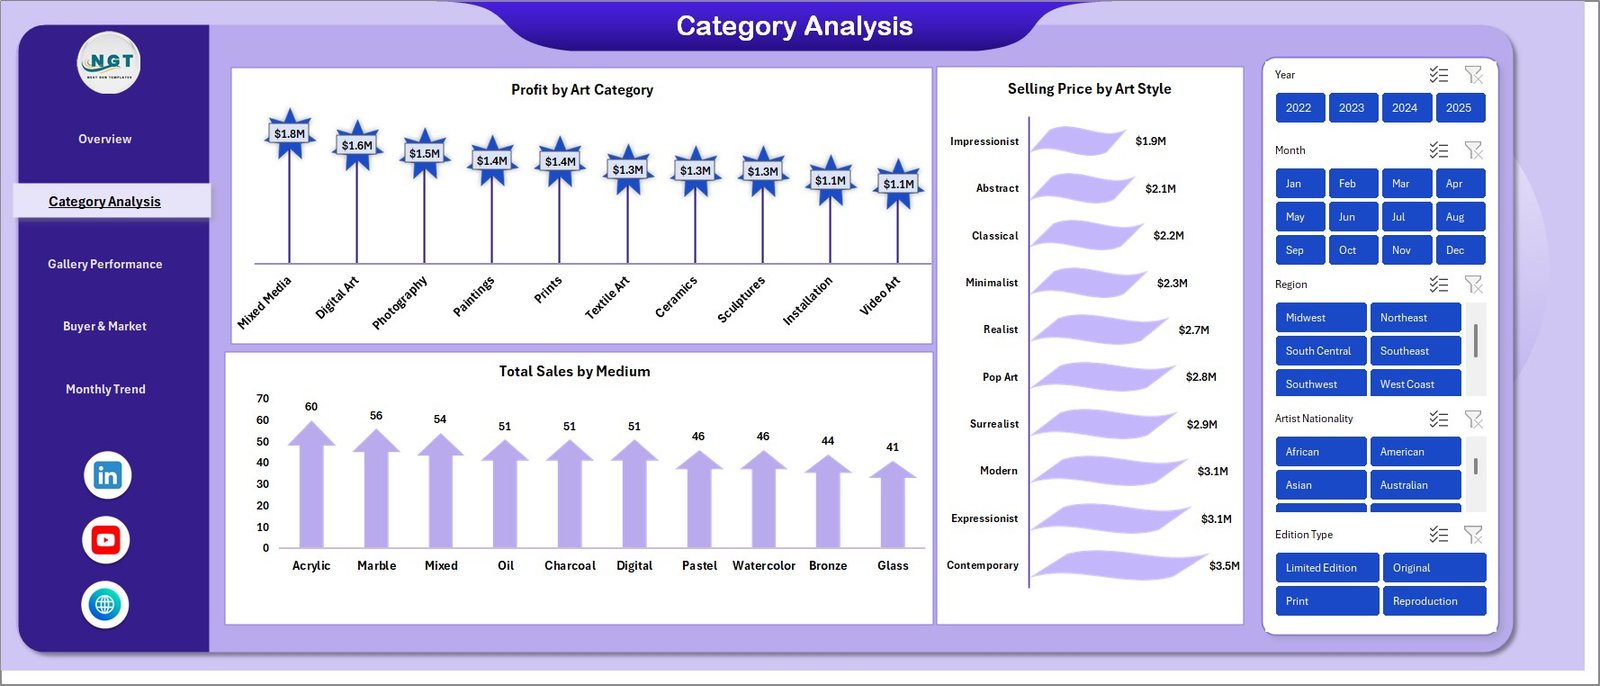
🎨 Art Category Insights – Analyze which art categories, styles, and mediums generate the most revenue and profit.
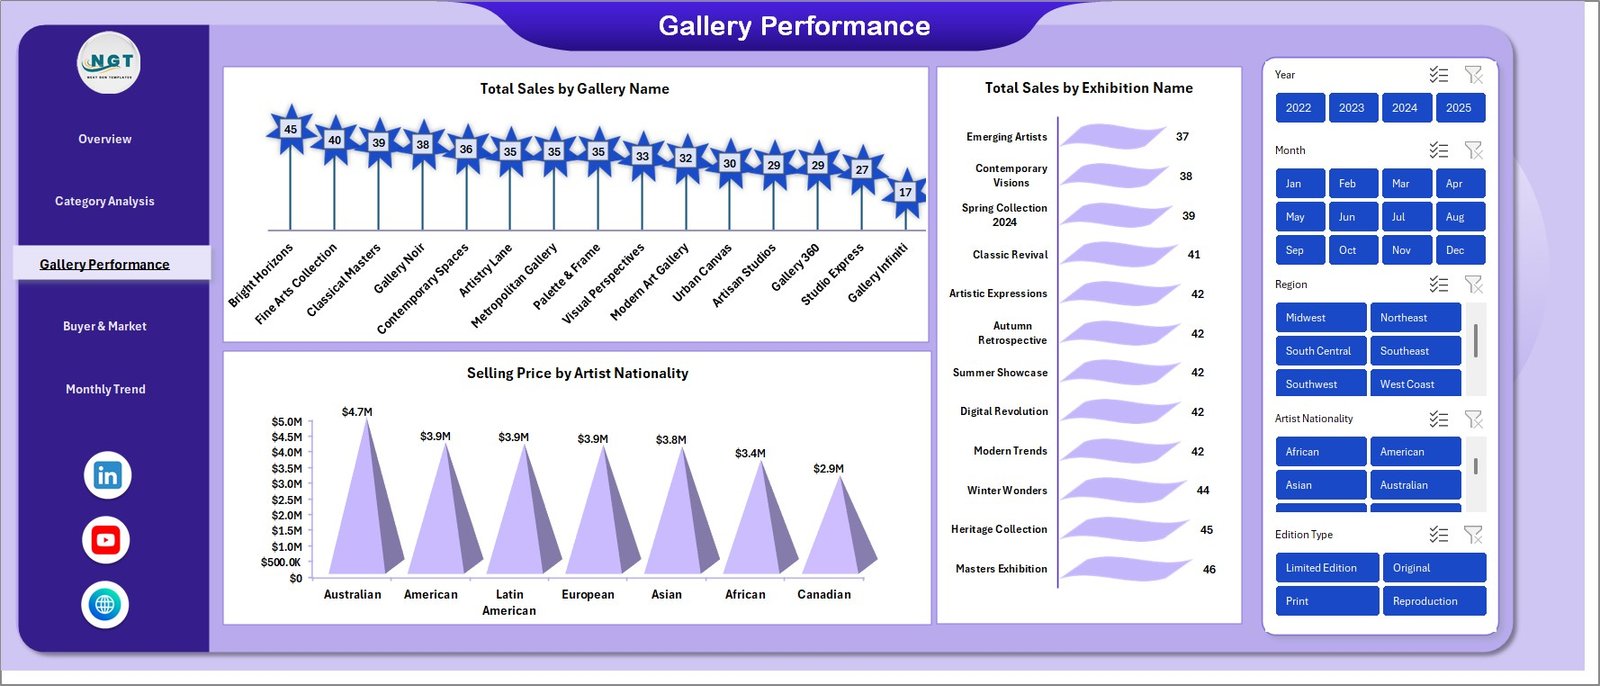
🏛️ Gallery & Exhibition Performance – Track sales by gallery and exhibition to identify top-performing events.
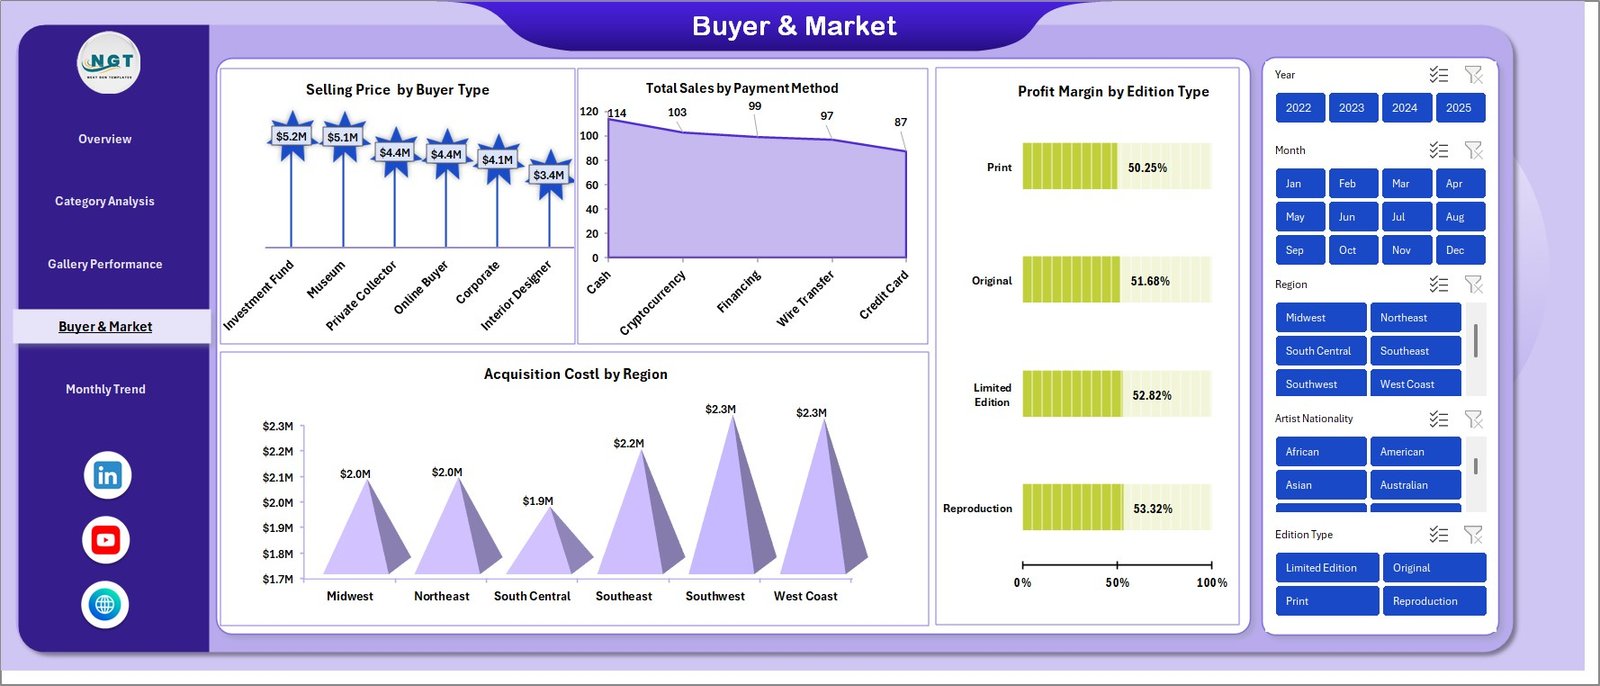
👥 Buyer & Market Intelligence – Understand buyer types, payment methods, and regional acquisition costs.
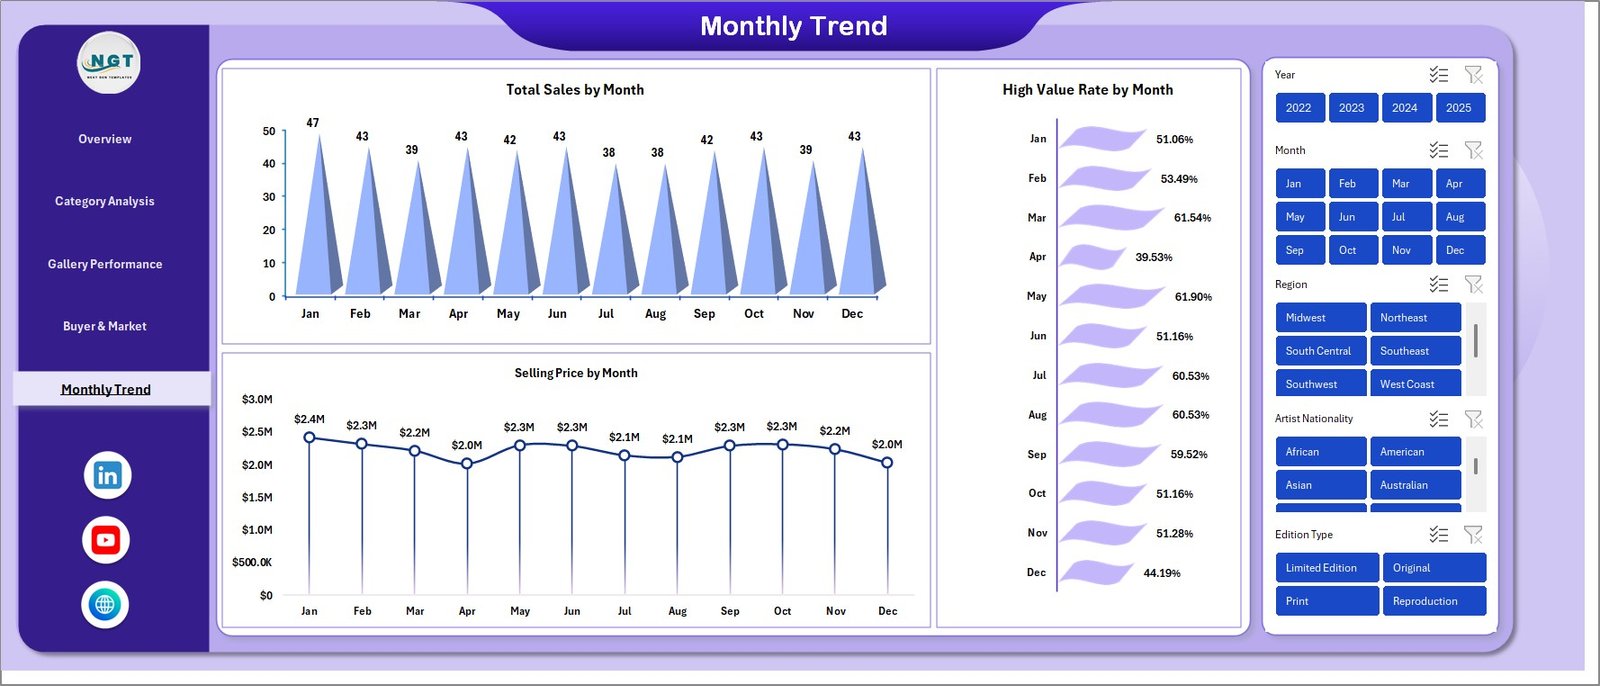
📅 Monthly Trend Analysis – Monitor performance over time with monthly sales, pricing, and high-value trends.
⚡ Dynamic & Interactive Charts – All visuals update automatically when data changes.
🔍 Smart Filtering Options – Slice and analyze data by category, buyer type, or time period.
💼 Business-Focused KPIs – Focus on metrics that truly impact your art business growth.
📦 What’s Inside the Art Galleries Dashboard in Excel
📁 Overview Sheet – Complete snapshot with KPI cards and category-based charts.
📊 Category Analysis Sheet – Deep insights into art types, styles, and mediums.
🏢 Gallery Performance Sheet – Track exhibition and gallery-level performance.
🌍 Buyer & Market Analysis Sheet – Understand customer behavior and regional trends.
📈 Monthly Trends Sheet – Identify seasonal performance and growth patterns.
🧾 Data Input Sheet – Simple and structured data entry for easy updates.
🎯 Pre-built Charts & KPIs – Ready-to-use visuals with no setup required.
⚙️ How to Use the Art Galleries Dashboard in Excel
1️⃣ Enter Your Data – Input sales, buyer, and exhibition data into the data sheet.
2️⃣ Automatic Processing – Excel formulas instantly process and organize your data.
3️⃣ View Dashboard Insights – KPIs and charts update automatically.
4️⃣ Apply Filters – Drill down into specific categories, galleries, or time periods.
5️⃣ Make Better Decisions – Use insights to optimize pricing, exhibitions, and strategies.
💡 No advanced Excel skills required—just input your data and let the dashboard do the work!
👥 Who Can Benefit from This Art Galleries Dashboard in Excel
🎨 Art Gallery Owners – Track performance and increase profitability.
🖼️ Curators – Plan better exhibitions using data insights.
💼 Art Dealers – Identify high-demand art styles and categories.
📊 Art Investors – Make smarter investment decisions based on trends.
🏛️ Museum Managers – Monitor exhibitions and audience engagement.
🚀 Why This Dashboard is a Game-Changer
✔️ Save hours of manual reporting
✔️ Get instant insights with dynamic visuals
✔️ Improve pricing and sales strategies
✔️ Understand buyer behavior deeply
✔️ Make faster, data-driven decisions
Click here to read the Detailed blog post
Watch the step-by-step video tutorial:
Visit our YouTube channel to learn step-by-step video tutorials
👉 https://www.youtube.com/@PKAnExcelExpert
Compatibility and Requirements
- Works in Microsoft Excel desktop (Excel 2016 or later, or Microsoft 365).
- You can filter the dashboard by category, buyer type or time period. Microsoft explains how in Use slicers to filter data.
Frequently Asked Questions
Which sheets are included?
The template has an Overview sheet, a Category Analysis sheet, a Gallery Performance sheet, a Buyer and Market Analysis sheet, a Monthly Trends sheet and a Data Input sheet.
Which KPIs does the Overview show?
The Overview shows Total Sales, Selling Price, Profit, Commission Earned and High Value Sales, with charts by art category.
How do I update the dashboard?
Enter your sales, buyer and exhibition data on the Data Input sheet. Excel formulas process the data, and the KPIs and charts update automatically.
Can I see which exhibitions sell best?
Yes. The Gallery Performance sheet tracks sales by gallery and by exhibition, so you can compare events.
Do I need advanced Excel skills?
No. You enter your data and the charts are already built. A video tutorial is linked on this page.
Related Excel Dashboard Templates
- Weekly Sales Chart in Excel: a weekly view of your sales figures
- Target Vs Actual Sales Dynamic Chart: compare sales with your targets
- A Stunning Chart to display the 5 KPI Metrics together: five KPIs in one chart
- Dynamic Variance Arrows Chart with Slicers: variance charts you filter with slicers
- KPI Dashboard Library (Excel): 15 Excel KPI dashboards in one download
Browse all Excel dashboards and Excel KPI dashboards.