

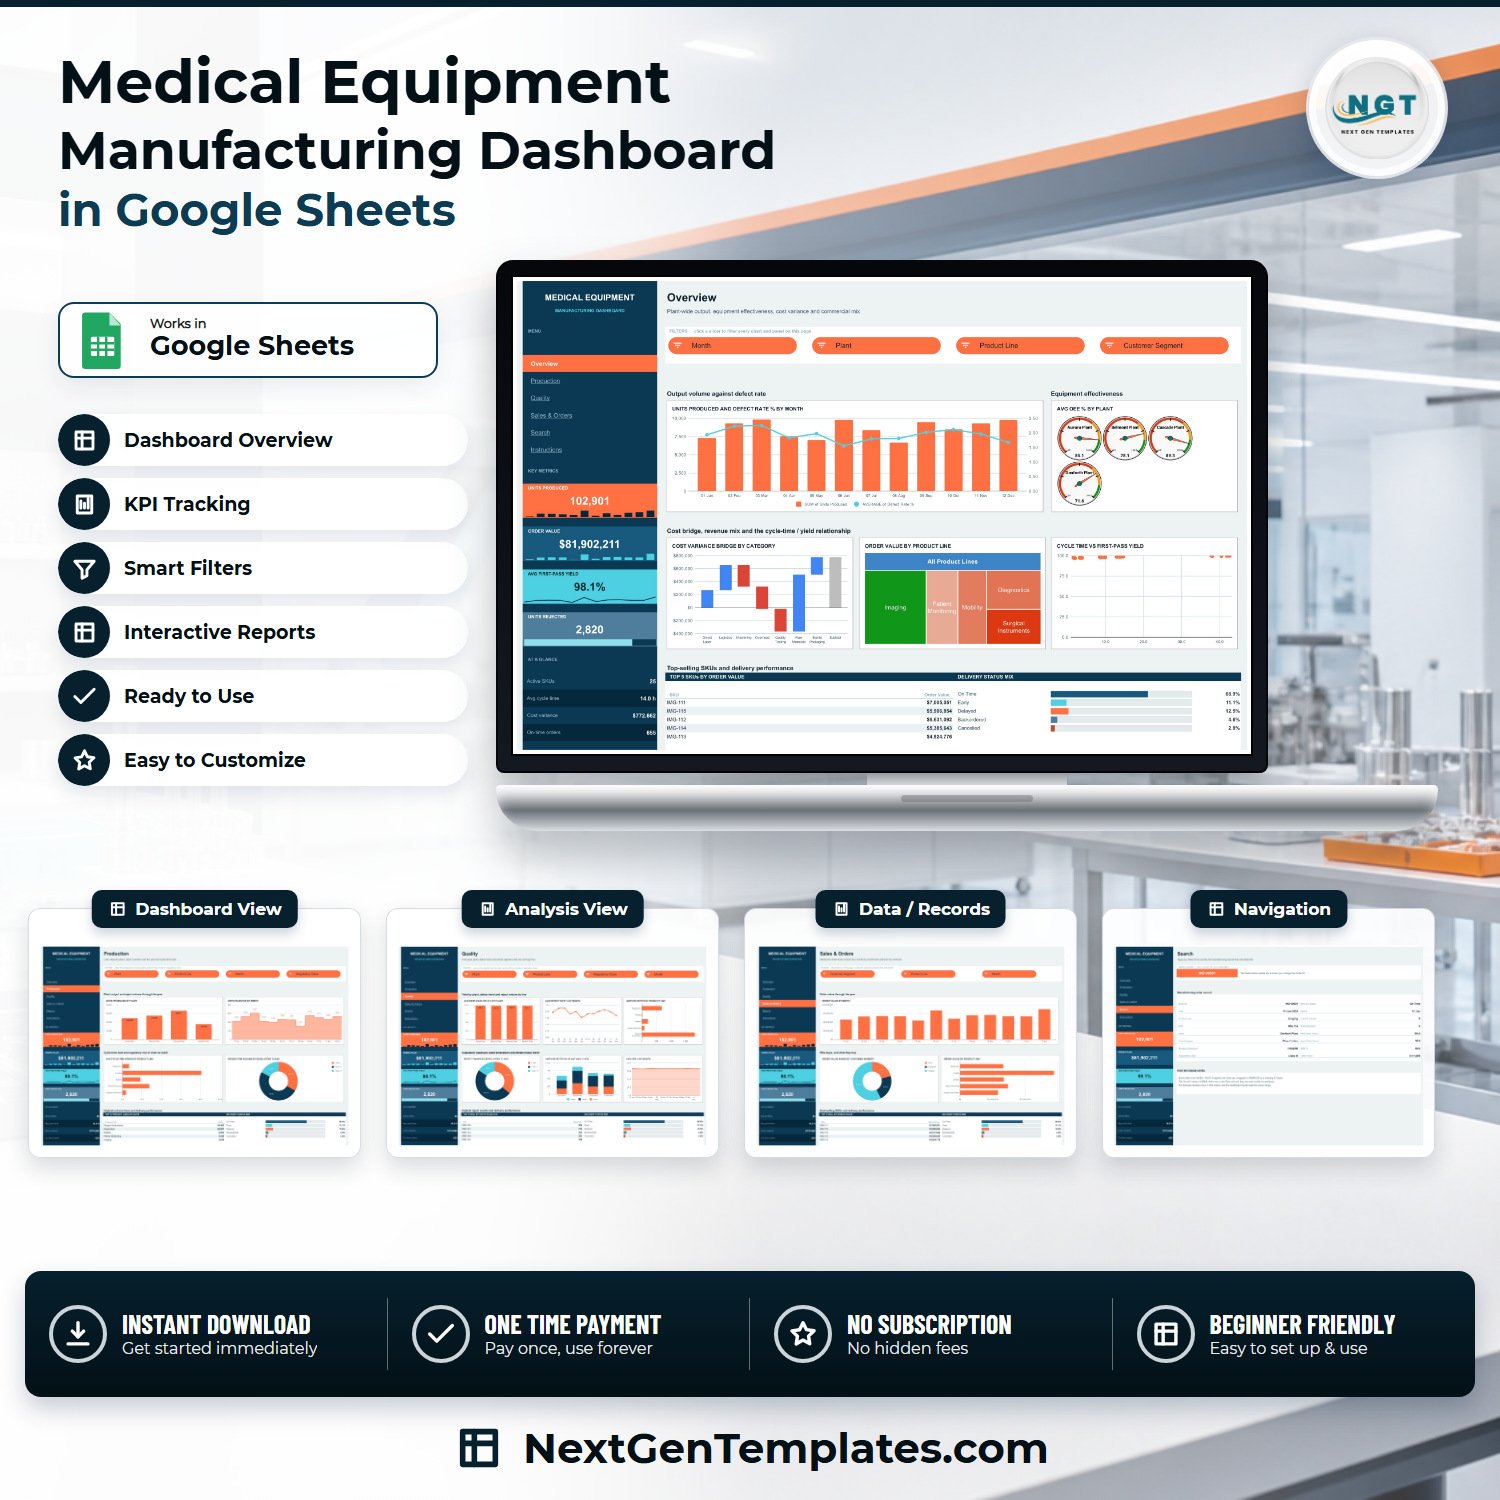
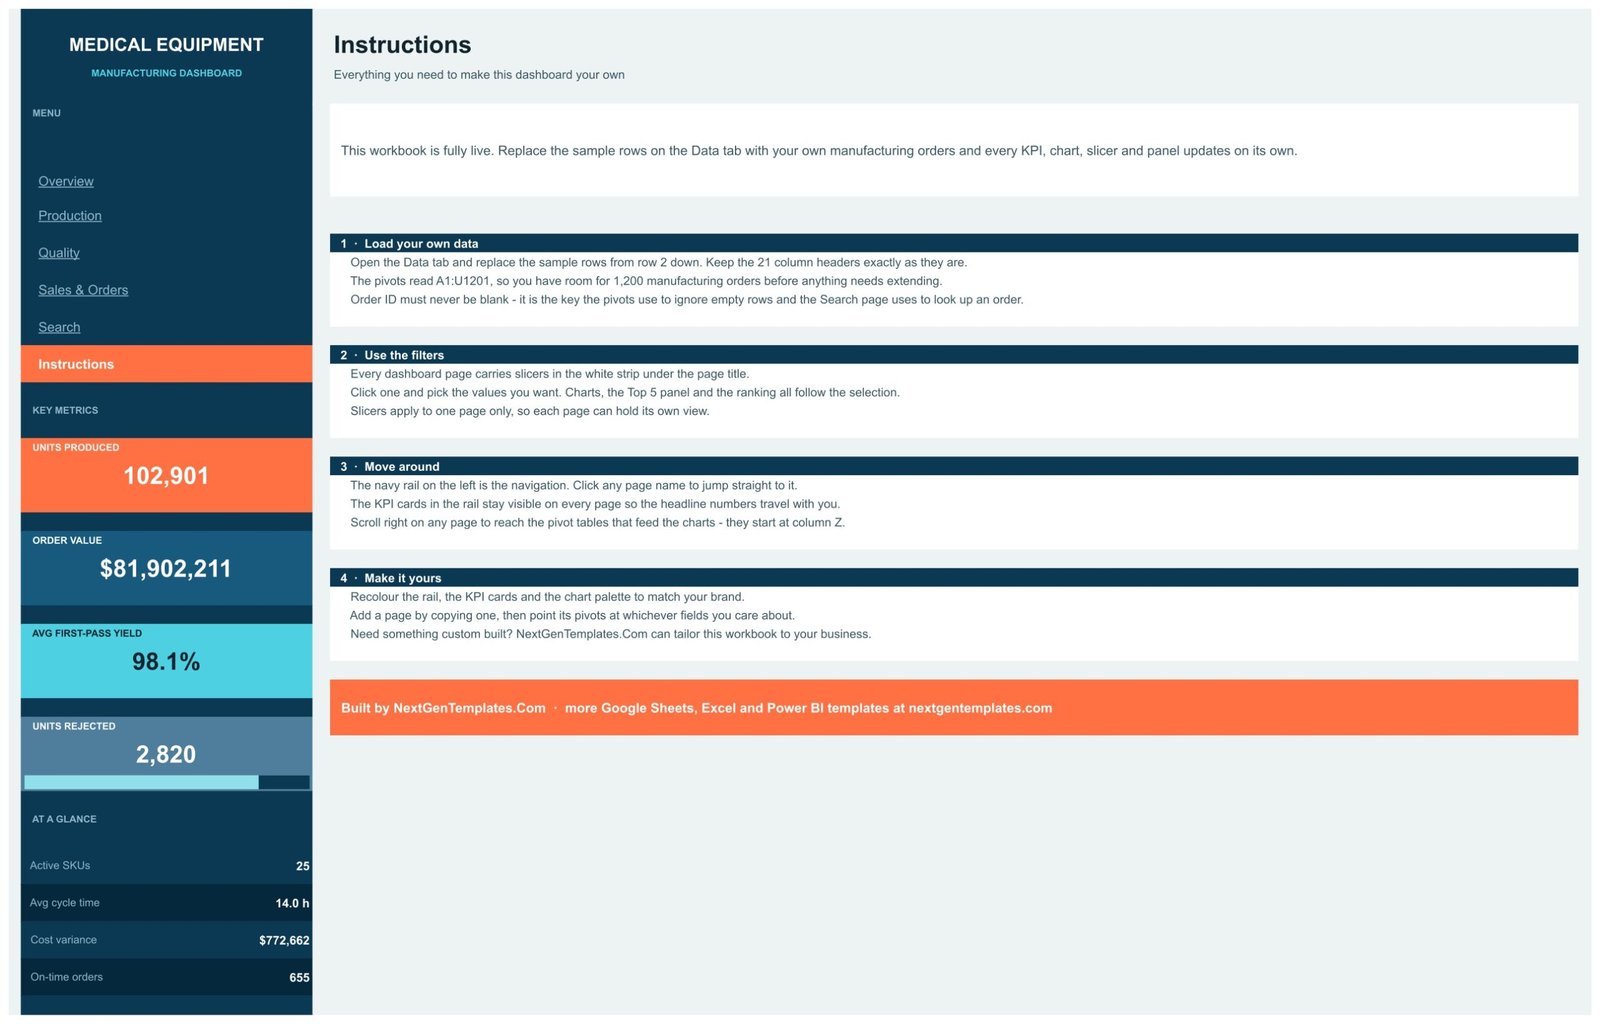

The Medical Equipment Manufacturing Dashboard in Google Sheets is a six-tab reporting workbook for a plant that builds medical devices – imaging systems, diagnostics, mobility aids, patient monitors and surgical instruments. It ships with 950 sample manufacturing orders across 21 columns, 18 charts, 15 native slicers and an order-lookup page, and the sample plant it models runs 102,901 units, $81,902,211 of order value, 98.1% average first-pass yield and 2,820 rejected units. Everything is built on native Google Sheets pivot tables, so there is nothing to install and nothing to license. One payment, instant download, and the PDF guide gives you a “Make a copy” link that drops an editable copy straight into your own Drive.
What this template is – and is not
This is a management reporting spreadsheet. It reads a table of manufacturing orders that you paste in and summarises them. Being straight about the boundary matters more in this industry than in most, so:
- It is static. There is no live connection to an ERP, MES, PLM or machine historian. Nothing syncs. You refresh it by pasting new rows onto the Data tab.
- It does not provide, support or evidence regulatory compliance of any kind. It is not a QMS, and it produces no FDA, ISO 13485, ISO 9001, CE marking, EU MDR, 21 CFR Part 11, design-history-file, device-history-record, validation, traceability or audit-trail capability. A Google Sheet is not a validated quality system and this one has never been presented as one. Keep your regulated records in your regulated system.
- It does not track device safety, recalls, complaints, adverse events or post-market surveillance. The Units Rejected and Defect Rate % figures are in-process production counts from your own data – nothing more.
- The Regulatory Class column (Class I / II / III) is a plain text field you type yourself. It is used only as a slicing dimension so you can split output and rejects by device class. It verifies nothing.
Key Features of the Medical Equipment Manufacturing Dashboard
- Six linked tabs – Overview, Production, Quality, Sales & Orders, Search and Instructions, with a navy side rail that jumps between them.
- Four persistent KPI cards – Units Produced, Order Value, Avg First-Pass Yield and Units Rejected stay visible in the rail on every page, each with its own sparkline.
- Four at-a-glance stats – Active SKUs (25), Avg cycle time (14.0 h), Cost variance ($772,662) and On-time orders (655).
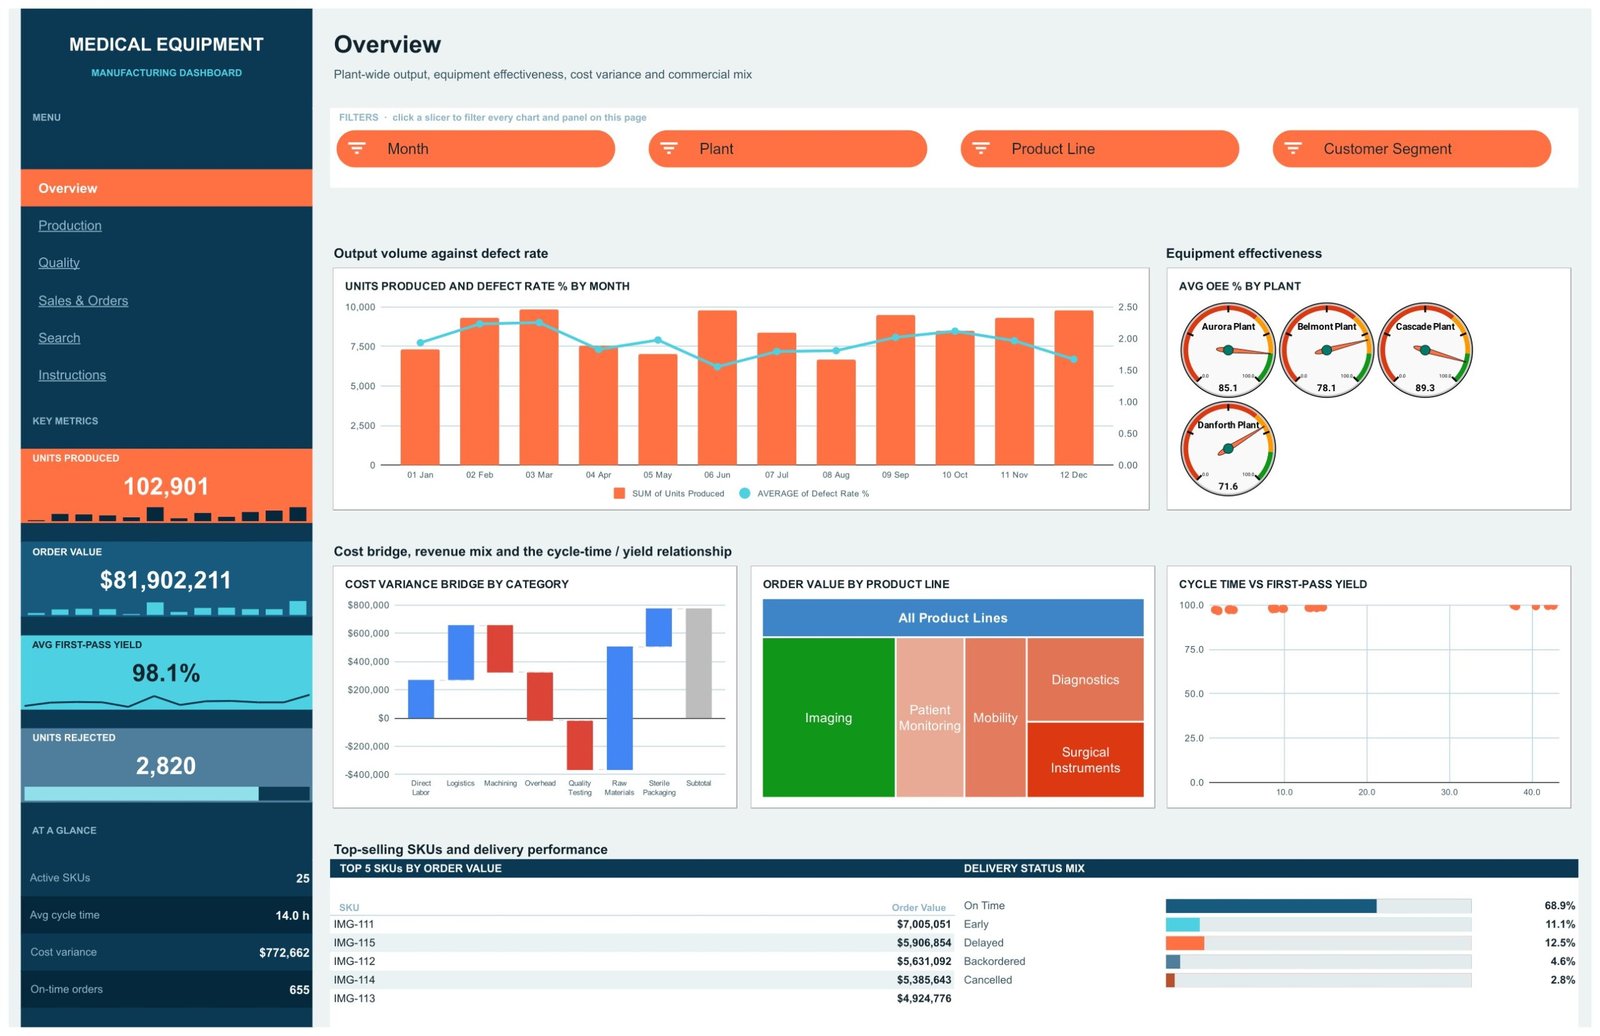
- 18 charts – a units/defect-rate combo, four plant OEE gauges, a cost-variance waterfall, an order-value treemap, a cycle-time vs first-pass-yield scatter, plus column, bar, donut, stacked-column, line and area charts.
- 15 native slicers – Month, Plant, Product Line, Customer Segment and Regulatory Class, applied per page so each tab keeps its own view.
- Real pivot tables – every chart reads a native pivot starting at column Z, not a wall of helper formulas.
- 950 sample manufacturing orders in 21 columns, with pivots sized to A1:U1201 so you have room for 1,200 orders before anything needs extending.
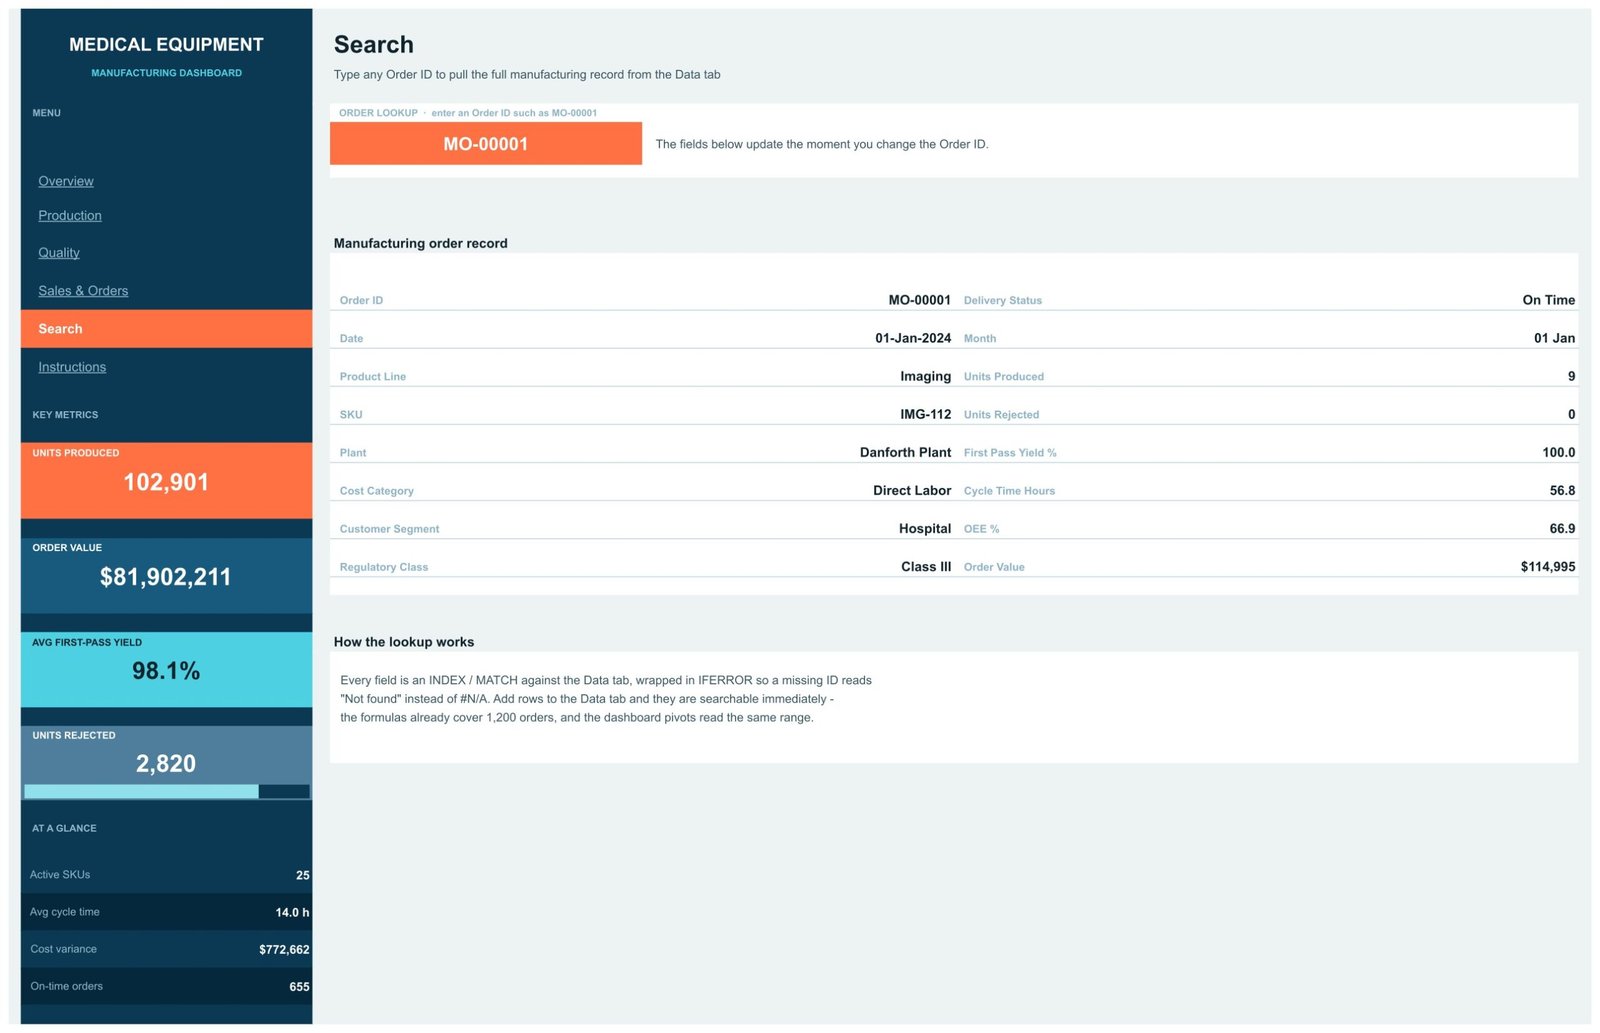
- Order lookup page – type any Order ID and read all 16 fields of that record.
- Four Top-5 ranking panels and a Delivery Status Mix bar panel that both follow the slicers.
- Browser-only – no Excel licence, no add-on, no subscription.
What’s Inside the Medical Equipment Manufacturing Dashboard
Overview is the plant-wide page: Units Produced and Defect Rate % by Month as a combo chart, Avg OEE % by Plant as four gauges (Aurora 85.1, Belmont 78.1, Cascade 89.3, Danforth 71.6), a Cost Variance Bridge by Category waterfall running Direct Labor, Logistics, Machining, Overhead, Quality Testing, Raw Materials and Sterile Packaging to a subtotal, an Order Value by Product Line treemap, and a Cycle Time vs First-Pass Yield scatter. Four slicers drive the whole page.
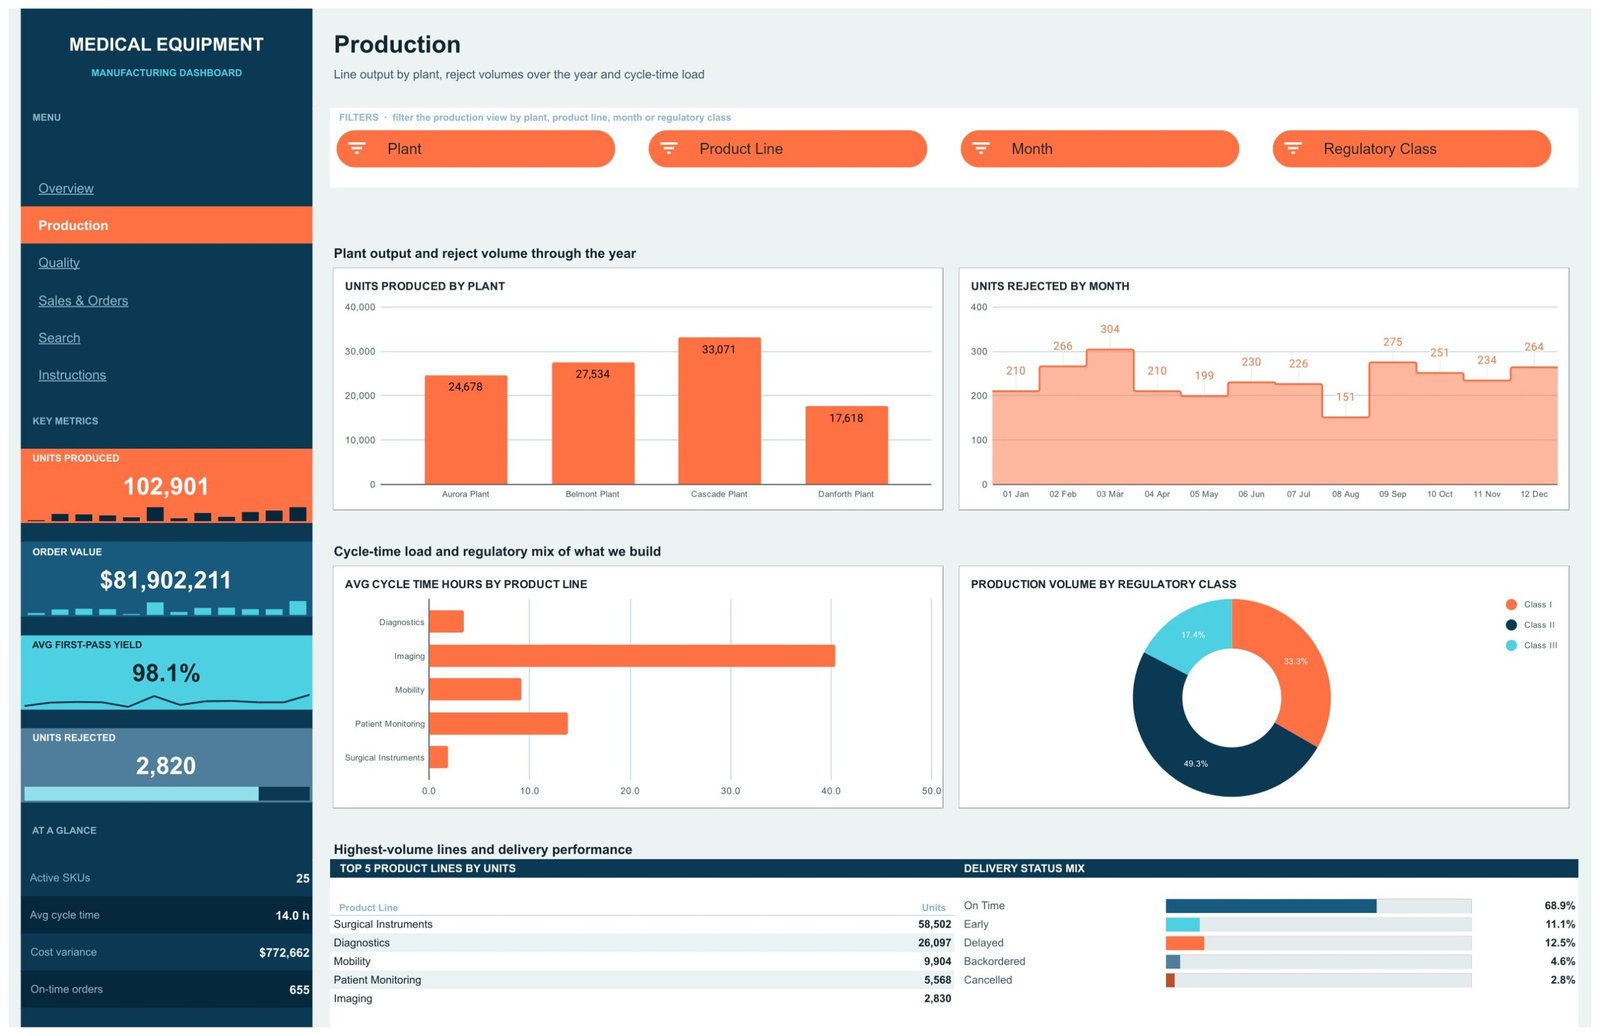
Production splits output four ways: Units Produced by Plant, Units Rejected by Month, Avg Cycle Time Hours by Product Line and Production Volume by Regulatory Class, with a Top 5 Product Lines by Units table underneath.
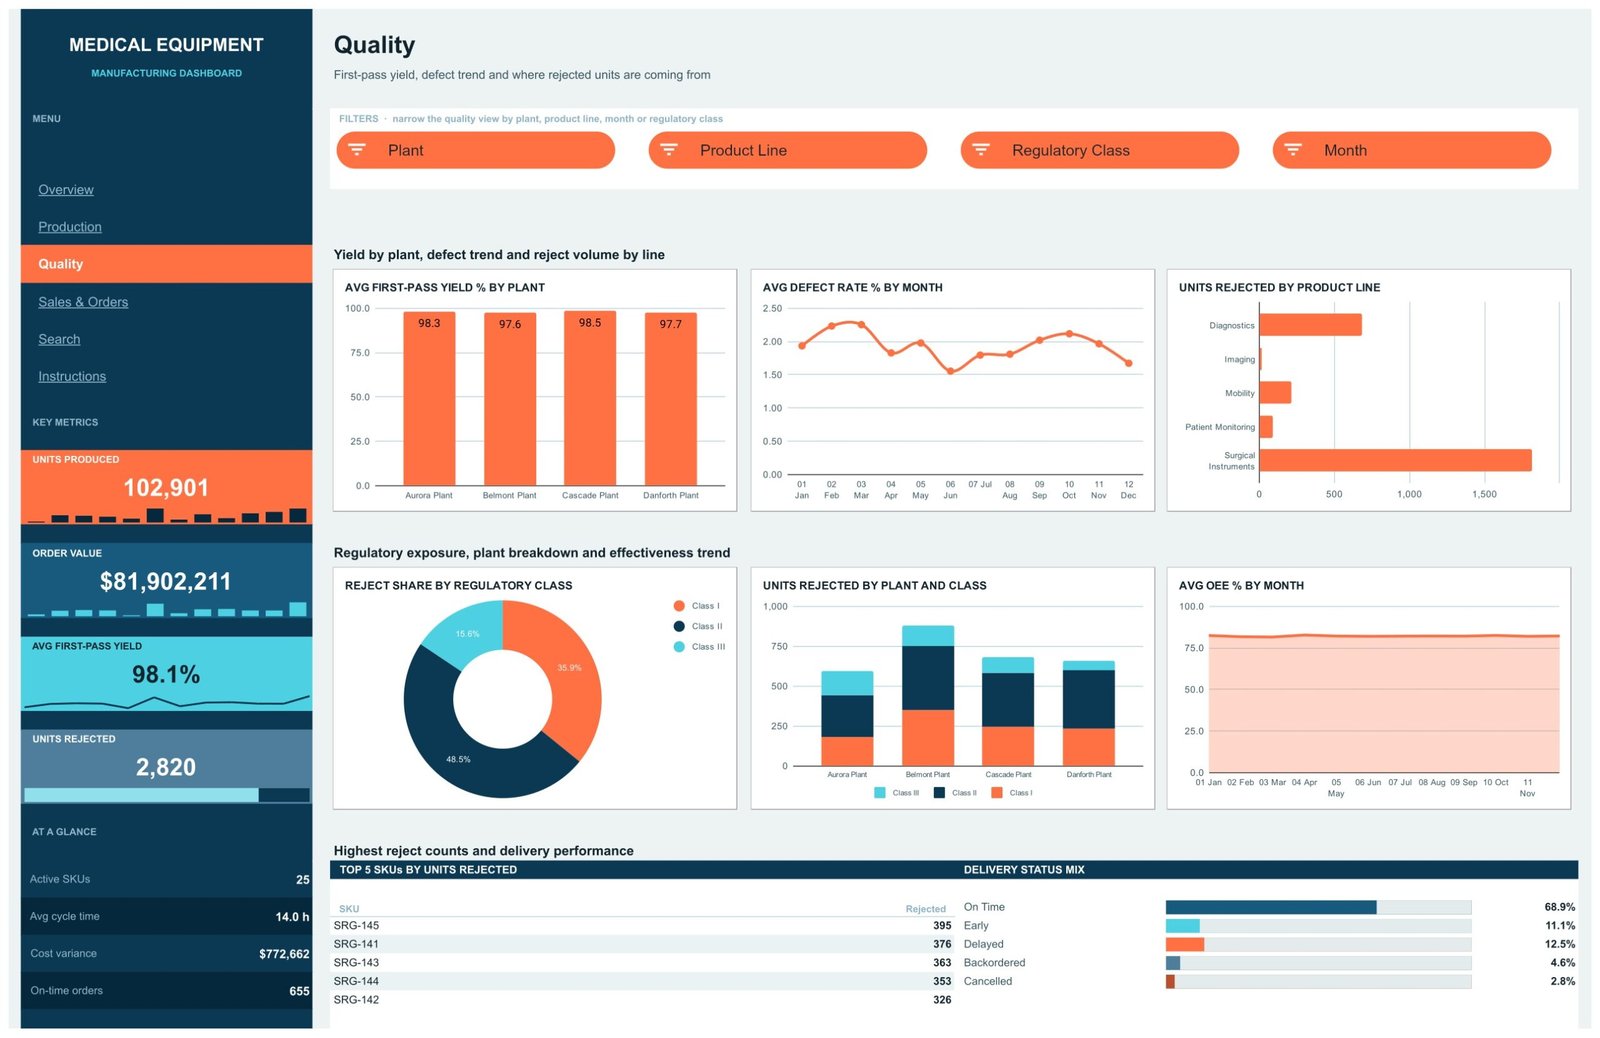
Quality carries six charts – Avg First-Pass Yield % by Plant, Avg Defect Rate % by Month, Units Rejected by Product Line, Reject Share by Regulatory Class, Units Rejected by Plant and Class as a stacked column, and Avg OEE % by Month – plus a Top 5 SKUs by Units Rejected table.
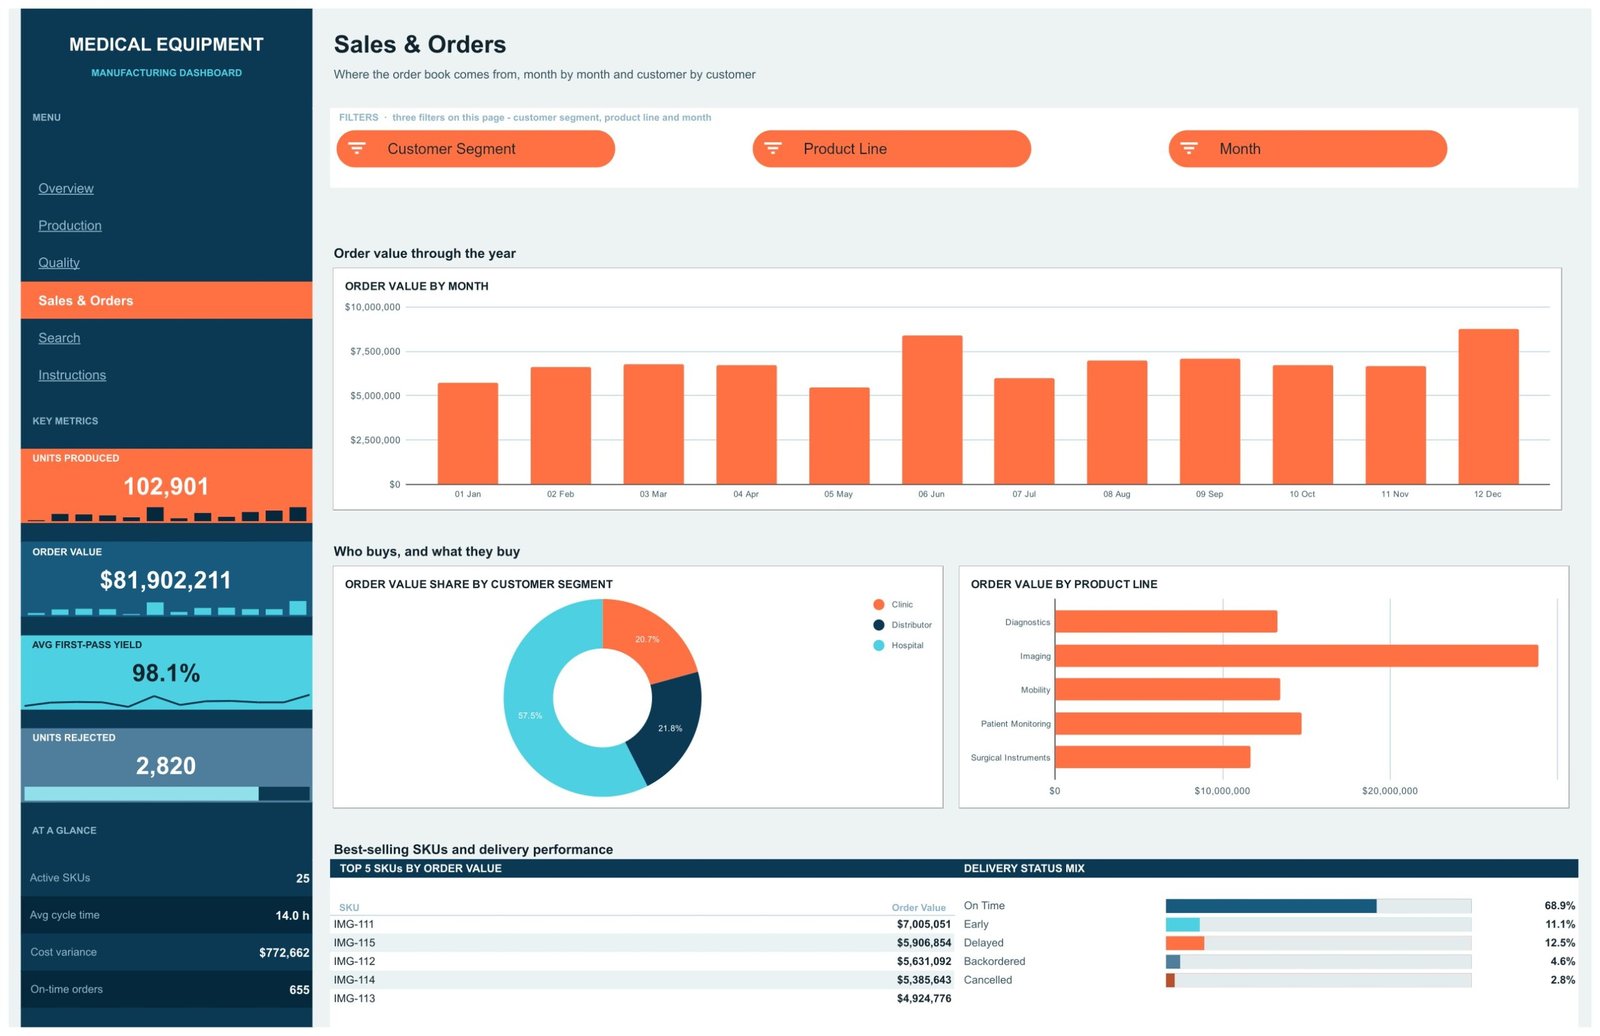
Sales & Orders covers the commercial side: Order Value by Month, Order Value Share by Customer Segment (Hospital 57.5%, Distributor 21.8%, Clinic 20.7%) and Order Value by Product Line.
Search is an INDEX/MATCH lookup wrapped in IFERROR, so a missing Order ID reads “Not found” instead of #N/A. Instructions explains the data layout, the slicers, the navigation and how to recolour it.
Medical Equipment Manufacturing Dashboard vs. Excel vs. a Paid BI Suite – Where This Fits
| This template (Google Sheets) | Excel dashboard | Paid BI suite (e.g. Tableau Creator) | |
|---|---|---|---|
| Cost | $9.99 once | $13.99 once + Microsoft 365 | ~$75 per user per month |
| Platform | Any browser | Excel desktop | Desktop app + cloud |
| Setup time | Minutes – paste your orders | Minutes | Days, plus a data source |
| Real-time team collaboration | Yes, native | Limited | Yes |
| Mobile access | Sheets mobile app | Excel mobile | Yes |
| Customizable fields | Yes – edit any column | Yes | Yes, with modelling work |
| Share with a link | Yes | File-based | Licensed viewers |
| Year-1 cost at 5 users | $9.99 | $13.99 + licences | ~$4,500 |
| Live ERP / MES connection | No – paste-in data | No | Yes, with a connector |
| Regulatory / QMS capability | None | None | None – that is a separate validated system |
An ERP or MES is a different category of product altogether, not a cheaper or dearer version of this one. If your orders already live in one, this workbook is a reporting layer you paste an export into – not a replacement.
Who This Template Is For – and Who It’s Not For
It fits a production or operations manager at a small-to-mid device manufacturer who wants one shared link showing output, yield, cycle time, cost variance and the order book; a plant supervisor comparing four sites on OEE; a commercial lead who wants order value split by segment and product line.
It does not fit anyone who needs a validated, regulated record system, electronic signatures, or an audit trail – use your QMS. Nor anyone who needs live machine data, sub-minute refresh, or more than a few thousand orders in one file.
How to Use the Medical Equipment Manufacturing Dashboard
- Open the PDF in your download and click the “Make a copy” link to put your own copy in Drive.
- Open the Data tab and replace the sample rows from row 2 down. Keep all 21 headers exactly as they are, and never leave Order ID blank – it is the key the pivots and the Search page use.
- Refresh the pivot tables (they sit from column Z on each page) so the charts pick up your rows.
- Click any slicer in the white strip under a page title to filter that page. Slicers are per-page, so each tab keeps its own view.
- Use the Search tab to pull a single order’s full record by Order ID.
- Recolour the rail, the KPI cards and the chart palette to match your brand – it is all standard Sheets formatting.
Real-World Use Cases
Priya, production manager, four-site device maker. She opens Production every Monday, slices by Plant, and sees Cascade at 33,071 units against Danforth’s 17,618 – then checks the OEE gauges on Overview and finds Danforth at 71.6 while Cascade sits at 89.3. That is the week’s conversation, found in two clicks.
Marcus, quality lead. He works the Quality tab: Surgical Instruments carry the largest reject volume by a distance, and the Units Rejected by Plant and Class stacked column shows Belmont carrying the heaviest Class II share. He exports the view for the weekly review – and files the actual investigation records in the QMS, where they belong.
Dana, commercial director. Sales & Orders tells her Hospitals are 57.5% of order value and Imaging is the biggest line by revenue, while Production shows Imaging is also the slowest line at roughly 40 hours average cycle time. Two tabs, one pricing decision.
Frequently Asked Questions
Does this template help with FDA, ISO 13485 or CE marking compliance?
No. It provides no compliance, validation, traceability or audit-trail capability whatsoever, and it must not be used as a regulated record. It is a reporting spreadsheet. Keep regulated records in your validated quality management system.
Does it connect to my ERP, MES or machine data?
No. It is static. You paste an export onto the Data tab and the pivots and charts summarise it.
How many orders can it hold?
The pivots read A1:U1201, so there is room for 1,200 manufacturing orders out of the box. It ships with 950 sample rows. Beyond 1,200 you extend the pivot ranges yourself.
Do I need Excel or any add-on?
No. It runs in Google Sheets in any browser – no licence, no add-on, no subscription.
Can I change the product lines, plants and regulatory classes?
Yes. They are ordinary text values in the Data tab. Type your own, refresh the pivots, and the slicers and charts follow.
Is this the same as the KPI Dashboard version?
No. This is the analytical dashboard – six pages of pivot-driven charts. The Medical Equipment Manufacturing KPI Dashboard in Excel is a different template with a month picker and traffic-light scorecards.
Can several people use it at once?
Yes – it is a normal Google Sheets file, so sharing, comments and simultaneous editing all work as usual.
About the Author
Built by PK – Microsoft Certified Professional with 15+ years of Excel, Google Sheets, and Power BI experience. Founder of NextGenTemplates, reaching 300K+ subscribers across YouTube channels. Every template is hand-built and tested before release.
Explore Related Templates
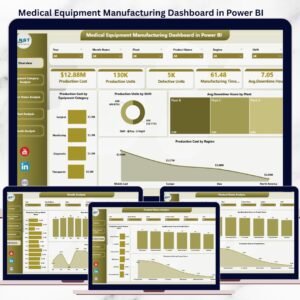
- Medical Equipment Manufacturing Dashboard in Power BI – the same subject with a Power BI model.
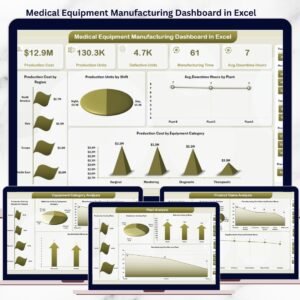
- Medical Equipment Manufacturing Dashboard in Excel – the offline workbook edition.
- Heavy Machinery Dashboard in Google Sheets – the same six-page build for machinery.
- Chemical Manufacturing Dashboard in Google Sheets – process-plant reporting.
- Browse the full Google Sheets Dashboard range or every Google Sheets template.
Get the Medical Equipment Manufacturing Dashboard in Google Sheets for $9.99 (regular $16.99). Instant download, one payment, no subscription – the PDF in your download carries the “Make a copy” link.
Watch the step-by-step video Demo:
Last updated: 1 September 2026.
Compatibility and Requirements
- Works in Google Sheets. You need a free Google account and a web browser.
- The charts read native Google Sheets pivot tables and slicers, so there is no add-on to install. Google explains charts in Add and edit a chart or graph.































Reviews
There are no reviews yet.