


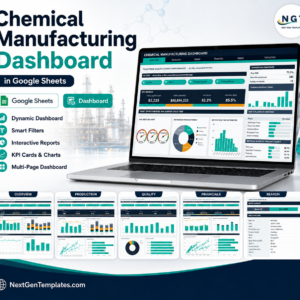
The Chemical Manufacturing Dashboard in Google Sheets reports 16 headline KPIs across four analysis pages, driven by 18 native charts and 15 slicers, on a 380-batch demo dataset that ships inside the file. Pivots, slicers and every formula are pre-sized to 1,000 batch rows, so you paste your own production log over the demo rows and the whole workbook recalculates. Setup takes under 10 minutes.Chemical Manufacturing Dashboard in Google Sheets
🌍 Join 8,400+ teams in 40+ countries using NextGenTemplates to replace paid SaaS tools with one-time-purchase Excel, Google Sheets, Power BI, and HTML templates.Chemical Manufacturing Dashboard in Google Sheets
✅ Instant download · One-time payment · No subscription · No per-user fees · Lifetime access
⚠️ Read this first. This is a production-reporting template fed by your own batch records. It is not a safety, hazard, environmental, quality-assurance or regulatory system, and it makes no claim about any standard or regulation. The sample rows inside the file are demo data, not real plant records.Chemical Manufacturing Dashboard in Google Sheets
🔑 Key Features of the Chemical Manufacturing Dashboard in Google Sheets
📊 16 KPI cards across four analysis pages. The Overview page reports Total Output (MT), Total Revenue, Avg Yield % and On-Spec Rate. Production reports Batches Run, Avg OEE %, Avg Cycle Time (h) and MT per Batch. Quality reports On-Spec Batches, Off-Spec Rate, Quality Deviations and Avg Yield %. Financials reports Total Revenue, Total Cost, Gross Margin and Margin %.
🎛️ 15 slicers filter every chart and pivot on their page. Overview and Financials carry four slicers each, Production carries Plant, Production Line, Product Family and Shift, and Quality carries Quality Result, Plant and Product Family. Slicers are per-page, so each page keeps its own filter state while you compare views.Chemical Manufacturing Dashboard in Google Sheets
⚙️ Native pivot tables sit behind every chart. Scroll right past the spacer column on any page and you can inspect the exact pivot feeding each visual. There are no hidden helper formula blocks, which is why the file stays fast as the batch log grows toward 1,000 rows.Chemical Manufacturing Dashboard in Google Sheets
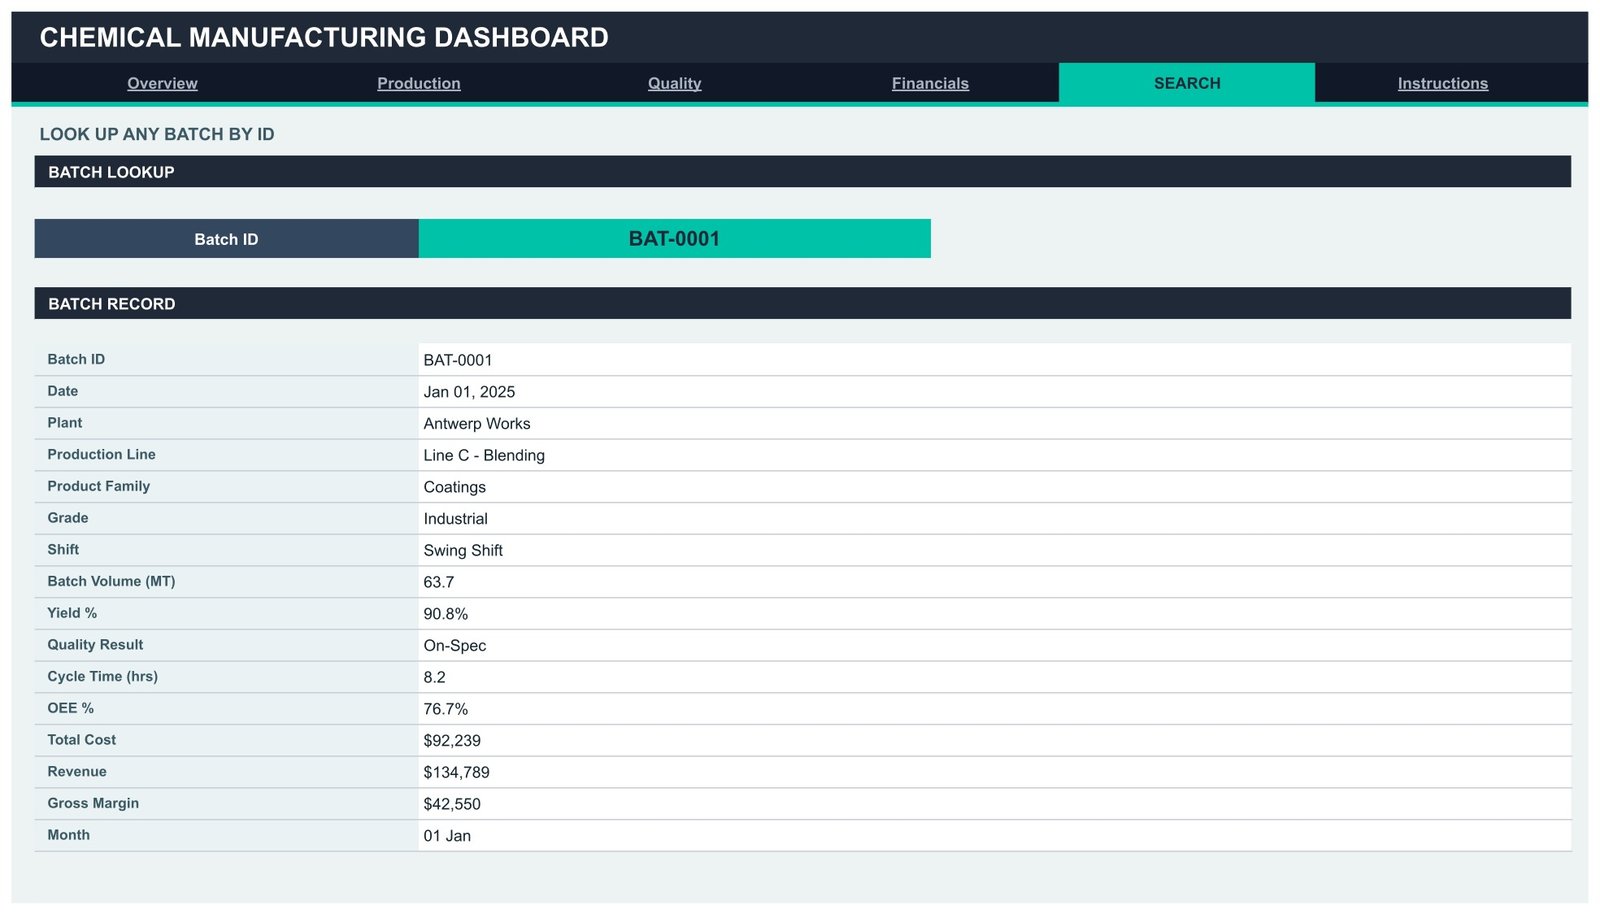
🔎 A dedicated batch-lookup page. Choose any Batch ID from the dropdown and the Search page returns 16 fields for that batch: date, plant, production line, product family, grade, shift, volume in MT, yield %, quality result, cycle time, OEE %, cost, revenue, gross margin and month.
🏭 Structured for multi-site operations. The demo dataset spans 6 plants (Antwerp Works, Gulf Coast Plant, Jubail Complex, Rotterdam Site, Singapore Hub, Texas City Plant), 5 production lines (Batch Reactor, Continuous, Blending, Distillation, Packaging) and 5 product families (Agrochemicals, Coatings, Industrial Gases, Polymers, Specialty Chemicals).
📈 Sidebar panels on every page — a snapshot block, a 12-month revenue trend, a Top 5 list, a share-of-total bar list and an At a Glance table — so the headline numbers and the ranked detail sit side by side without scrolling.
📦 What’s Inside the Chemical Manufacturing Dashboard in Google Sheets
Page 1: Overview — Plant-Wide Manufacturing Performance
The landing page shows Total Output (MT), Total Revenue, Avg Yield % and On-Spec Rate, with a sidebar carrying Avg OEE, batches produced and a recorded safety-incident count from the data. Charts include Avg OEE % by Shift (three gauges), Revenue by Product Family, Batch Cycle Time Distribution, Monthly Production Volume by Month and Production Volume by Plant, plus Top 5 Plants by Revenue and Revenue Share by Product Family. Slicers: Month, Plant, Product Family, Quality Result.
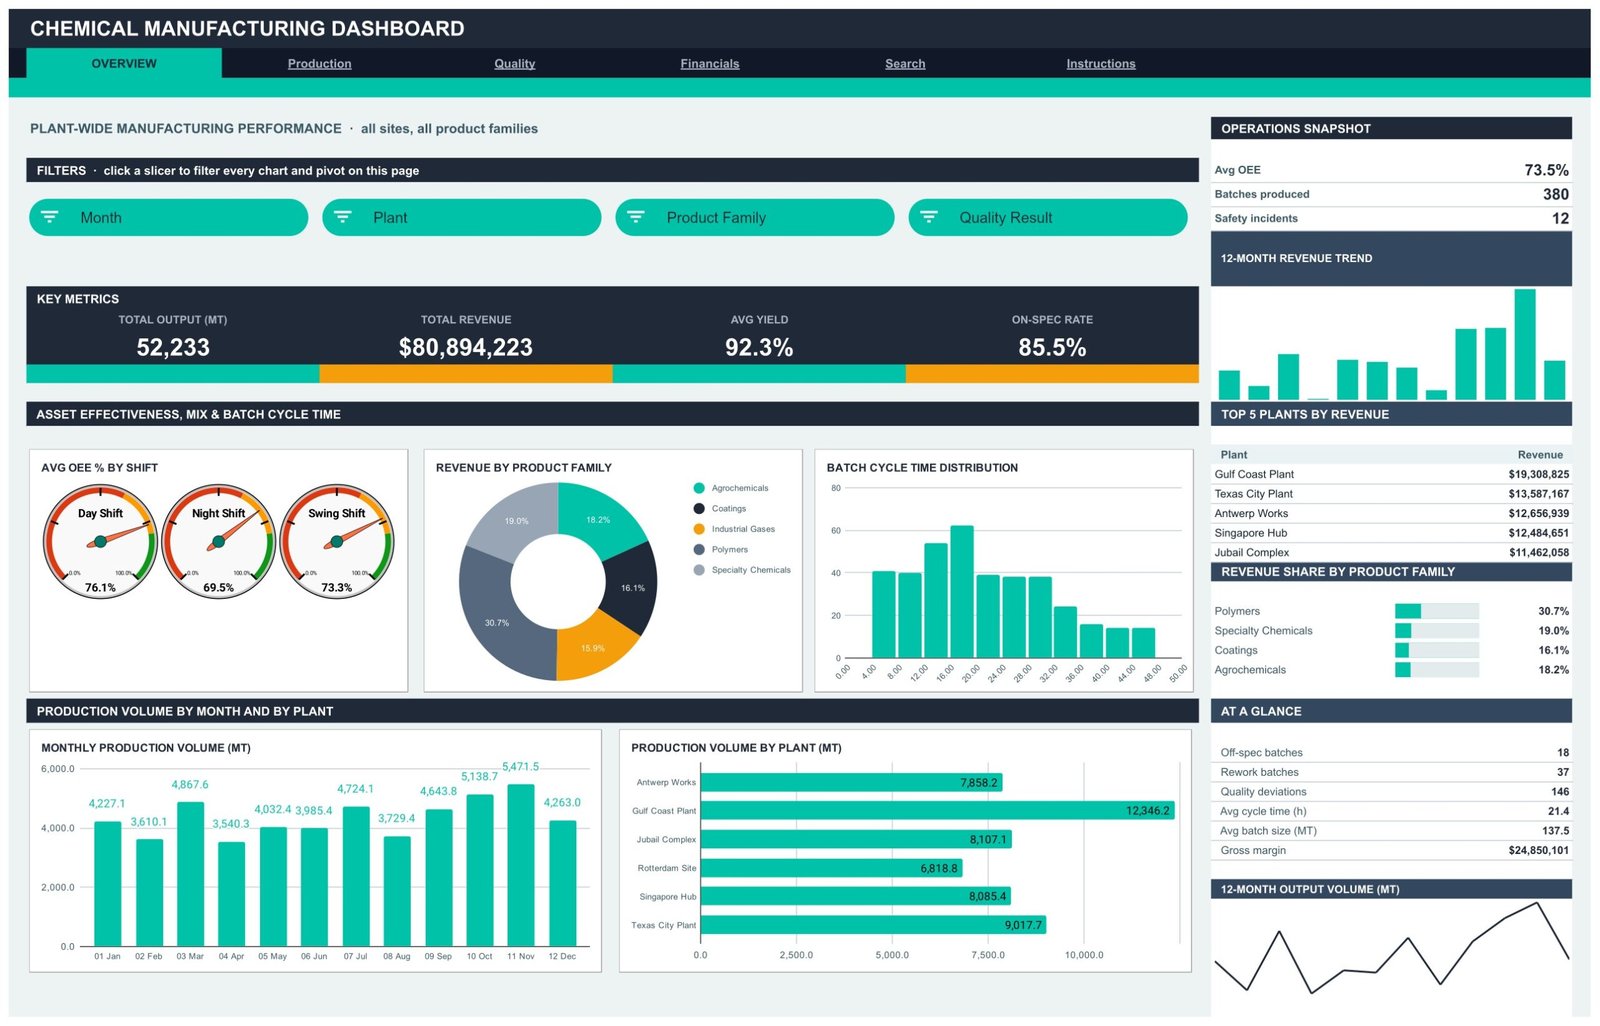
Page 2: Production — Plant and Line Throughput
This page reports Batches Run, Avg OEE %, Avg Cycle Time (h) and MT per Batch, with MT per run hour, total run hours and lines in service in the sidebar. Charts include Plant Volume vs Avg OEE, Output by Plant and Product Family, Avg OEE % by Month and Output by Production Line, alongside Top 5 Lines by Output and Output Share by Shift. Slicers: Plant, Production Line, Product Family, Shift.Chemical Manufacturing Dashboard in Google Sheets
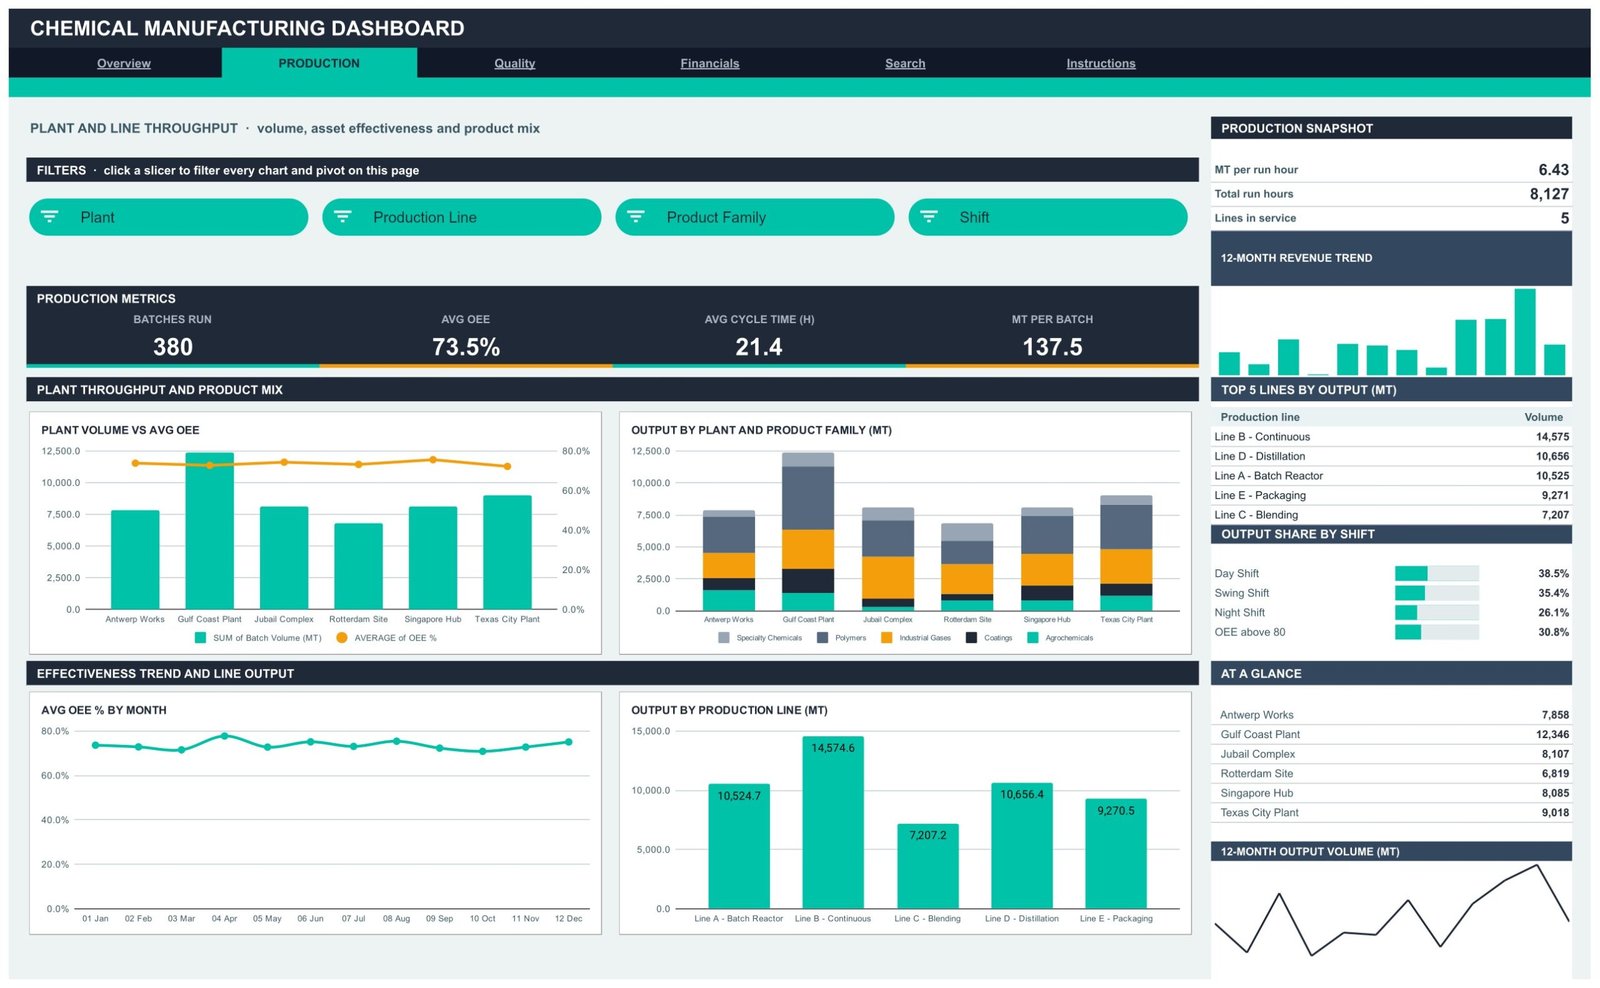
Page 3: Quality — Yield, Disposition and Deviations
This page summarises what your own records say about batch outcomes: On-Spec Batches, Off-Spec Rate, Quality Deviations and Avg Yield %, with rework rate and deviations per batch in the sidebar. Charts include Quality Deviations by Month, Batches by Quality Result and Avg Yield % by Plant, plus Top 5 Plants by Deviations and a batch disposition mix. It reports the dispositions you enter — it does not assess, approve or release any batch.Chemical Manufacturing Dashboard in Google Sheets
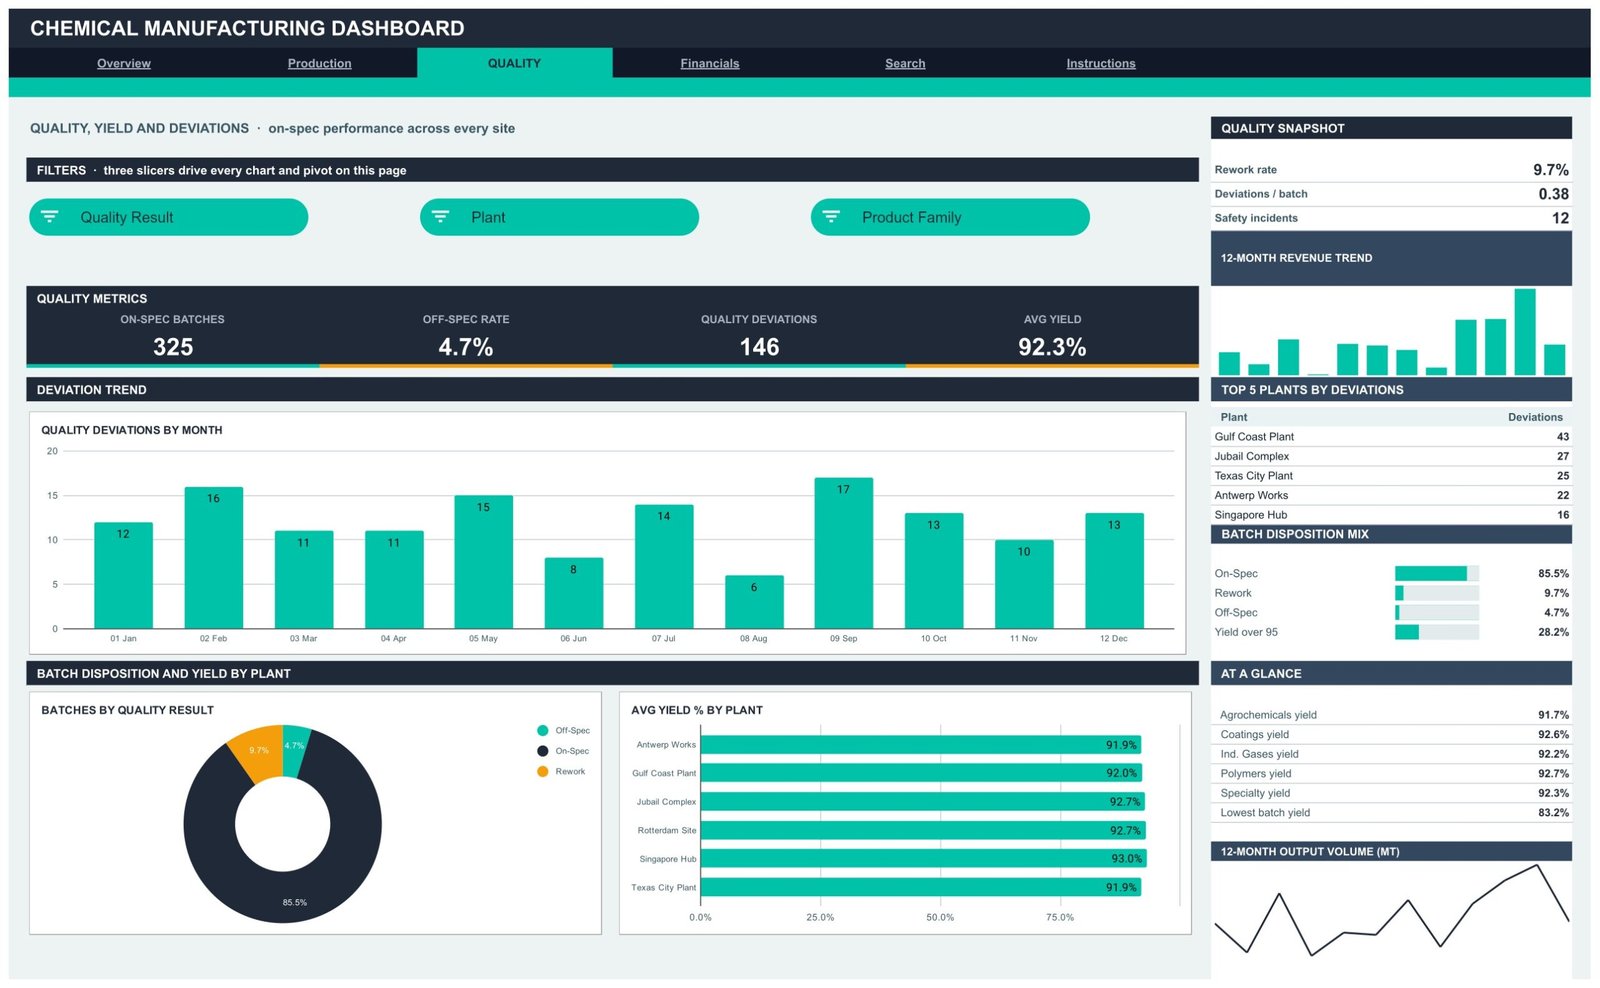
Page 4: Financials — Revenue, Cost Structure and Margin
This page reports Total Revenue, Total Cost, Gross Margin and Margin %, with revenue per MT, cost per MT and energy cost in the sidebar. Charts include Monthly Revenue vs Total Cost, Cost Structure by Plant, Batch Volume vs Revenue and Gross Margin by Product Family, plus Top 5 Families by Revenue and a raw-material / energy / margin ratio panel. Slicers: Month, Plant, Product Family, Grade.
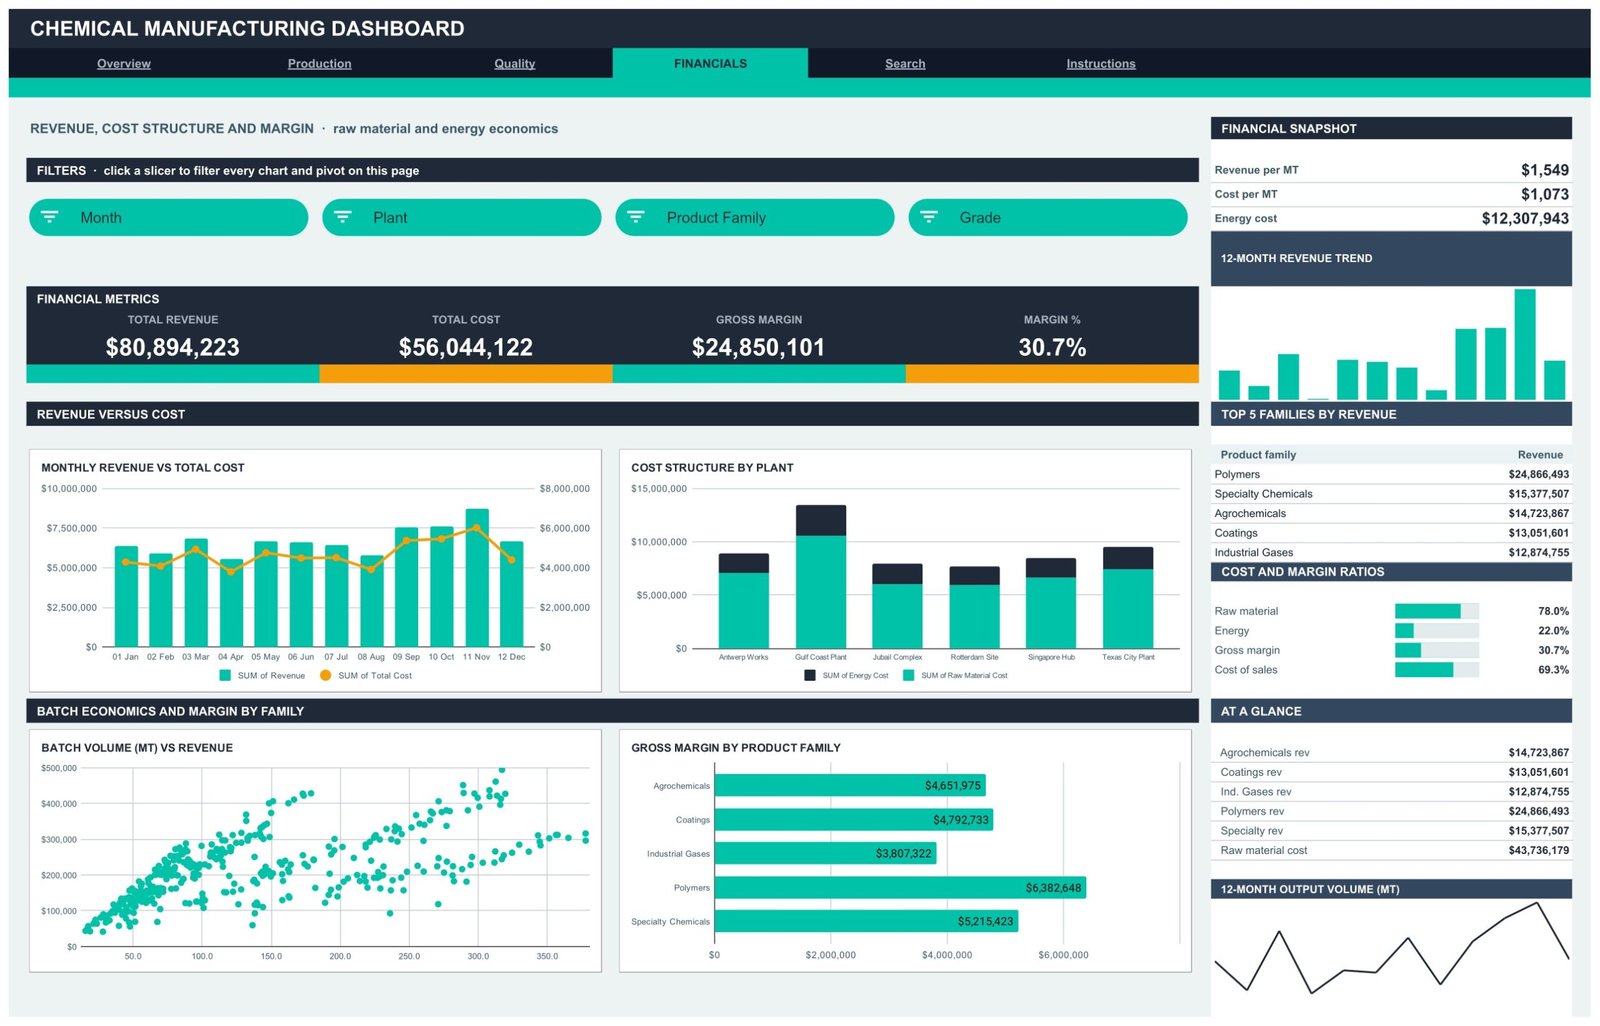
Page 5: Search — Batch Lookup
Pick a Batch ID from the dropdown and the full batch record appears underneath: plant, line, product family, grade, shift, volume, yield, quality result, cycle time, OEE, cost, revenue, gross margin and month. Useful when someone asks about one specific batch in a meeting.Chemical Manufacturing Dashboard in Google Sheets
Page 6: Instructions — How the File Works
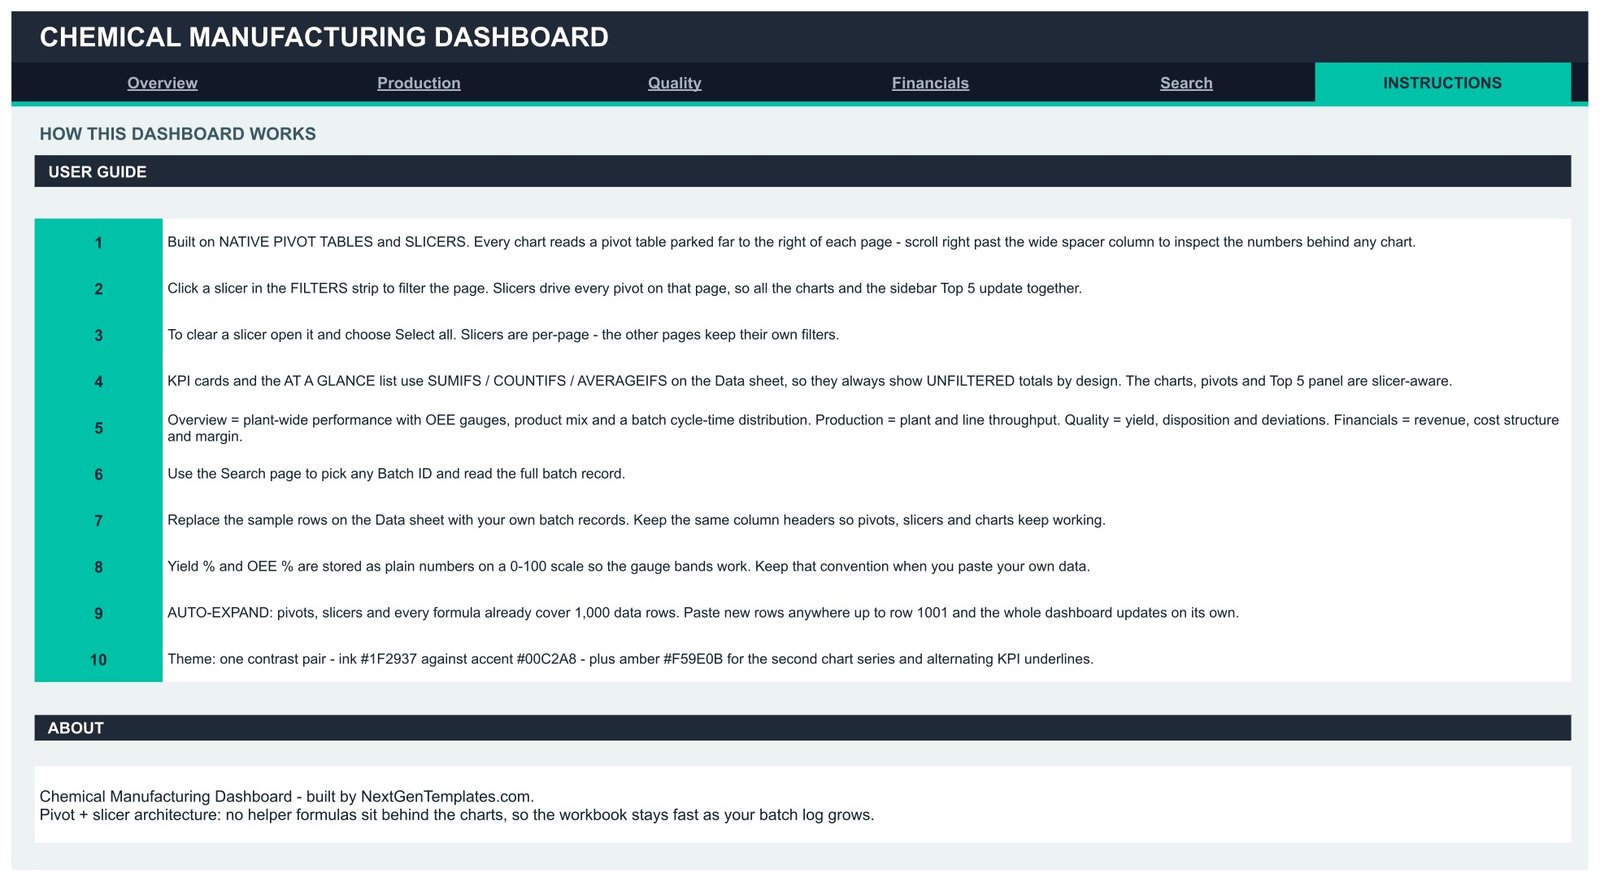
A 10-step user guide covering the pivot-and-slicer architecture, how to clear a slicer, why the KPI cards use SUMIFS on the Data sheet, how to paste your own rows and the 0-100 number convention that keeps the OEE gauges working.
Data Sheet — Where Your Batch Log Lives
One flat table holds every batch record: Batch ID, date, plant, production line, product family, grade, shift, batch volume (MT), yield %, quality result, cycle time (hrs), OEE %, total cost, revenue, gross margin and month. It arrives loaded with 380 rows of demo data. Delete those rows, paste your own under the same headers, and every page follows.
📊 Chemical Manufacturing Dashboard vs. an Excel Build vs. Paid Manufacturing Analytics SaaS — Where This Fits
| Feature | Chemical Manufacturing Dashboard in Google Sheets | Excel dashboard build | MES / manufacturing analytics SaaS |
|---|---|---|---|
| Cost | $9.99 one-time ✅ | $20-40 one-time, or days of internal build time | $50-200 / user / month |
| Platform | Google Sheets, any browser ✅ | Desktop Excel | Vendor cloud + plant connectors |
| Setup time | Under 10 minutes ✅ | 15-30 minutes | Weeks of implementation |
| Real-time team collaboration | Built in ✅ | Requires OneDrive / SharePoint | ✅ |
| Mobile access | Sheets app, free ✅ | Limited | ✅ (paid seat) |
| Customisable fields and charts | Fully editable ✅ | ✅ Fully editable | Vendor-defined |
| Share with a link | ✅ | File copy or cloud link | Paid seat per viewer |
| Batch-level drill-down | ✅ Search page, 16 fields ✅ | Depends on build | ✅ |
| Year-1 cost at 5 users | $9.99 ✅ | $20-40 | $3,000-12,000 |
For plants that want batch, yield, OEE and margin reporting on a spreadsheet they already own, without a plant-systems project, the Chemical Manufacturing Dashboard sits in the sweet spot.
👥 Who This Template Is For — and Who It’s Not For
✅ This template is built for:
- Production and operations managers at small and mid-size chemical, coatings, polymer or specialty plants who report batch output and yield monthly
- Plant controllers and finance analysts who need revenue, cost per MT and gross margin split by plant and product family
- Continuous-improvement and planning teams tracking OEE, cycle time and rework rates by line and shift
- Consultants and contract manufacturers who report plant performance to a client and want an editable, shareable file
- Anyone who currently rebuilds the same production summary by hand each month
❌ This template is NOT for:
- Chemical safety or hazard work — it does not classify hazards, produce or manage Safety Data Sheets, or support GHS labelling
- Regulatory registration or reporting — nothing here supports REACH registration, OSHA Process Safety Management, EPA reporting, emissions inventories or waste-handling records
- Quality assurance or certification evidence — it is not a QMS, not a batch record, and produces no evidence for ISO 9001, ISO 14001 or any audit or conformance assessment
- Incident management — the safety-incident figure is a plain count carried in your data; there is no investigation, corrective-action or reporting workflow behind it
- Real-time machine or SCADA/historian monitoring — this reads a batch log you maintain, it does not connect to plant equipment
- Teams needing SSO, audit trails and role-based permissions beyond what Google Workspace sharing provides
⚙️ How to Use the Chemical Manufacturing Dashboard
- Open the PDF in your download and click the link inside to copy the dashboard into your own Google Drive.
- Open the Instructions tab and read the 10-step guide — it explains the pivot-and-slicer architecture in two minutes.
- Go to the Data sheet, delete the 380 demo rows, and paste your own batch records under the same column headers.
- Keep Yield % and OEE % as plain numbers on a 0-100 scale so the gauge bands render correctly.
- Return to any page and click a slicer. Every chart, pivot and Top 5 panel on that page updates together.
- Use the Search page to pull up one Batch ID and read its full record.
- Share the file with your team using normal Google Sheets sharing, or export a page to PDF for your monthly review.
💼 Real-World Use Cases
Anita is production manager at a two-site coatings plant. She pastes last month’s batch log into the Data sheet on the first working day, filters the Production page to her own site, and takes the OEE-by-shift gauges and the output-by-line chart straight into the Monday review — instead of rebuilding the same pivot from scratch each month.
Marcus controls costs for a specialty chemicals group. He uses the Financials page to compare revenue per MT against cost per MT by product family, and the Cost Structure by Plant chart to see where raw material versus energy cost is moving, using figures his ERP export already produces.
Priya consults for mid-size manufacturers. She keeps one copy of the dashboard per client, loads their batch history, and hands over a link the client can open in any browser — no software to install, no per-user licence to negotiate.
❓ Frequently Asked Questions
Does this dashboard make my plant compliant with chemical safety or environmental regulations?
No. The Chemical Manufacturing Dashboard in Google Sheets is a production-reporting template only. It provides no hazard classification, no SDS or GHS content, and no REACH, OSHA PSM, EPA or emissions functionality, and it produces no evidence for any audit, certification or regulatory submission.
What KPIs does the Chemical Manufacturing Dashboard track?
It reports 16 headline KPIs: total output in MT, total revenue, avg yield %, on-spec rate, batches run, avg OEE %, avg cycle time, MT per batch, on-spec batches, off-spec rate, quality deviations, total cost, gross margin and margin %, plus revenue and cost per MT.
Is the sample data real plant data?
No. The 380 batch rows shipped with the Chemical Manufacturing Dashboard are demo data generated for illustration, covering 6 fictional plants and 5 product families. Delete them and paste your own records; every chart, pivot and slicer follows your data automatically.
How long does setup take?
Under 10 minutes. Copy the file from the link in the PDF, open the Data sheet, replace the demo rows with your own batch log using the same column headers, and every page recalculates. There is nothing to install and no add-on to authorise.
How many rows of data can it handle?
Pivots, slicers and formulas in the Chemical Manufacturing Dashboard are pre-sized to 1,000 batch rows, so you can paste anywhere up to row 1001 with no edits. Beyond that you extend the pivot and formula ranges once, and everything continues to work.
How does this compare to manufacturing analytics SaaS?
A manufacturing analytics platform connects to plant equipment and costs $50-200 per user per month. The Chemical Manufacturing Dashboard is $9.99 once, reads a batch log you maintain by hand or from an ERP export, and runs in a browser tab your team already has open.
Can I edit the charts and add my own metrics?
Yes. Everything is standard Google Sheets — native pivot tables, native charts and native slicers. Add a column to the Data sheet, extend a pivot, and build another chart the normal way. Nothing is locked, and there are no macros or scripts to maintain.
👤 About the Author
Built by PK — Microsoft Certified Professional with 15+ years of Excel, Google Sheets, and Power BI experience. Founder of NextGenTemplates, reaching 300K+ subscribers across YouTube channels (@PK-AnExcelExpert, @NextGenTemplates, @NeoTechNavigators). Every template is hand-built and tested before release.
🔗 Explore Related Templates
Also available as: the same topic ships on two other platforms — Chemical Manufacturing Dashboard in Excel for desktop workbooks, and Chemical Manufacturing Dashboard in Power BI if you already run Power BI Desktop.
Working across heavy industry? The Oil & Gas Dashboard in Google Sheets and the Steel & Metals Dashboard in Google Sheets use the same pivot-and-slicer layout, and the Power Generation Dashboard in Google Sheets covers the energy side. For shop-floor logging rather than reporting, see the Daily Production Output Tracker in Google Sheets.
Browse the full Google Sheets Dashboard templates collection for more ready-to-use dashboards.
📖 Click here to read the Detailed Blog Post
🎥 Visit our YouTube channel for step-by-step video tutorials
👉 YouTube.com/@NextGenTemplates
Watch the step-by-step video Demo:
📅 Last updated: August 2026




























Reviews
There are no reviews yet.