

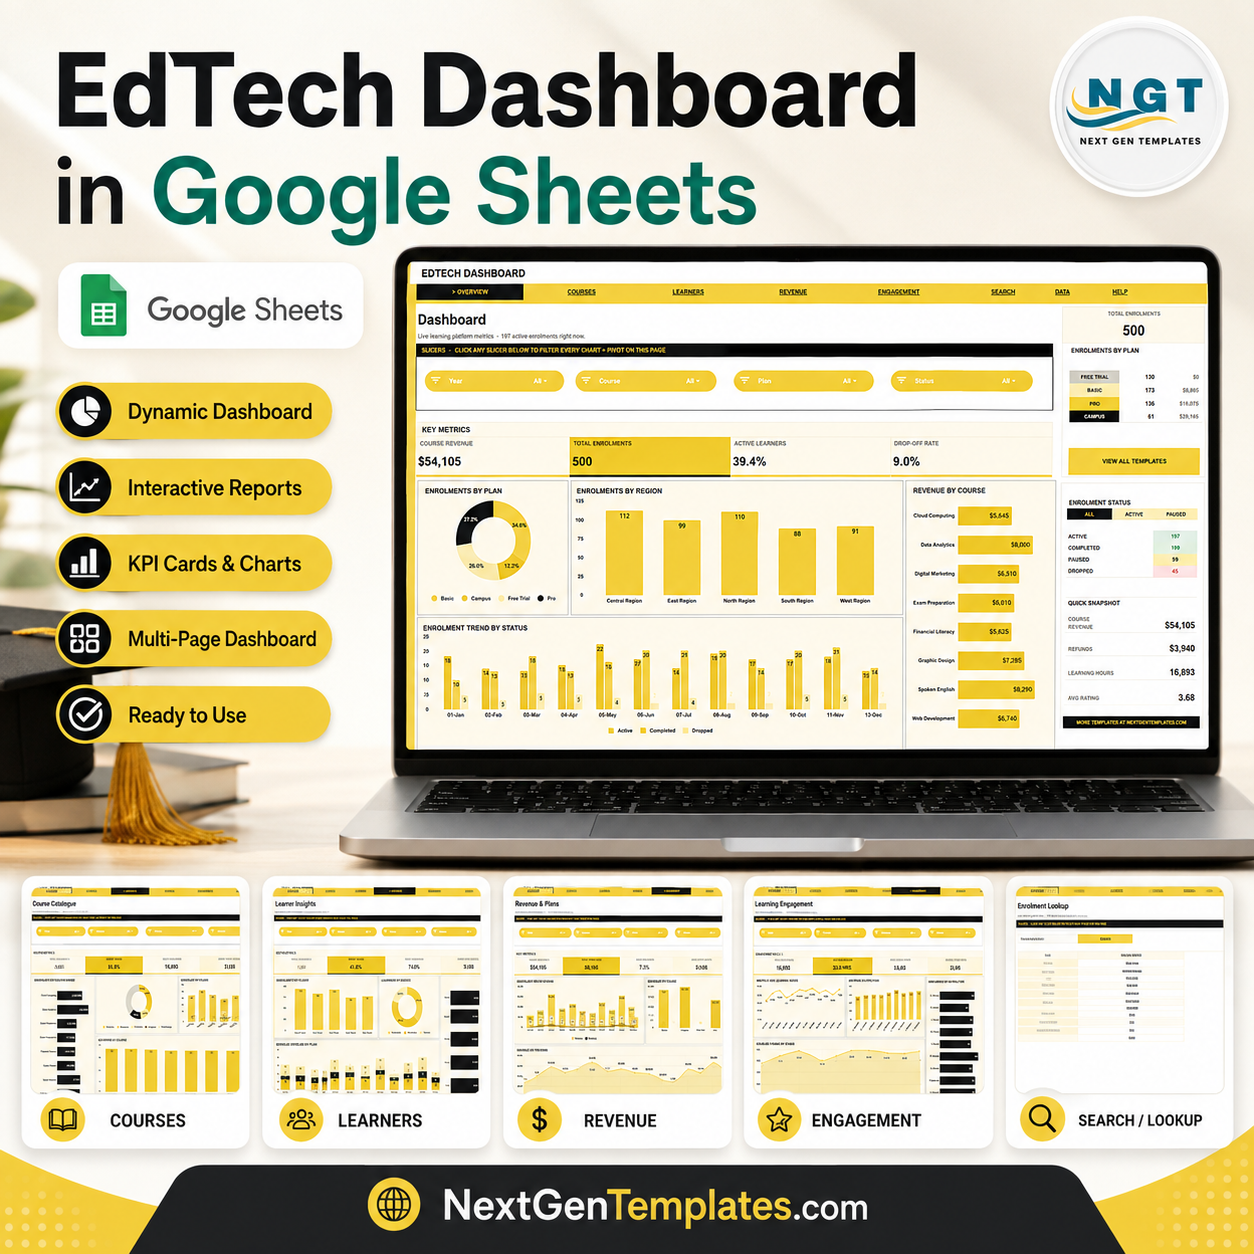
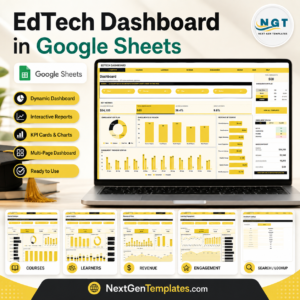
Last updated: August 9, 2026. The global education technology market is projected to reach USD 437.54 billion by 2033, which means course teams need cleaner reporting around revenue, enrolments, learner activity, and course performance. The EdTech Dashboard in Google Sheets gives you 7 sheet tabs, 4 headline cards, 20 analysis charts, multiple slicers, an Enrolment Lookup sheet, and a structured Data Sheet. Built by PK – Microsoft Certified Professional with 15+ years of spreadsheet experience and 300K+ subscribers – this editable template helps you replace manual reporting and avoid recurring dashboard software.
Key Features of EdTech Dashboard in Google Sheets
- 4 executive cards: Course Revenue, Total Enrolments, Active Learners, and Drop-off Rate summarize the top learning business metrics.
- 7 Google Sheets tabs: Overview, Course Catalogue, Learner Insights, Revenue & Plans, Learning Engagement, Enrolment Lookup, and Data Sheet.
- 20 analysis charts: Review plans, regions, courses, statuses, devices, instructors, ratings, refunds, and learning hours.
- Multiple slicers: Filter dashboard pages quickly by the available course, plan, region, status, device, instructor, and date fields.
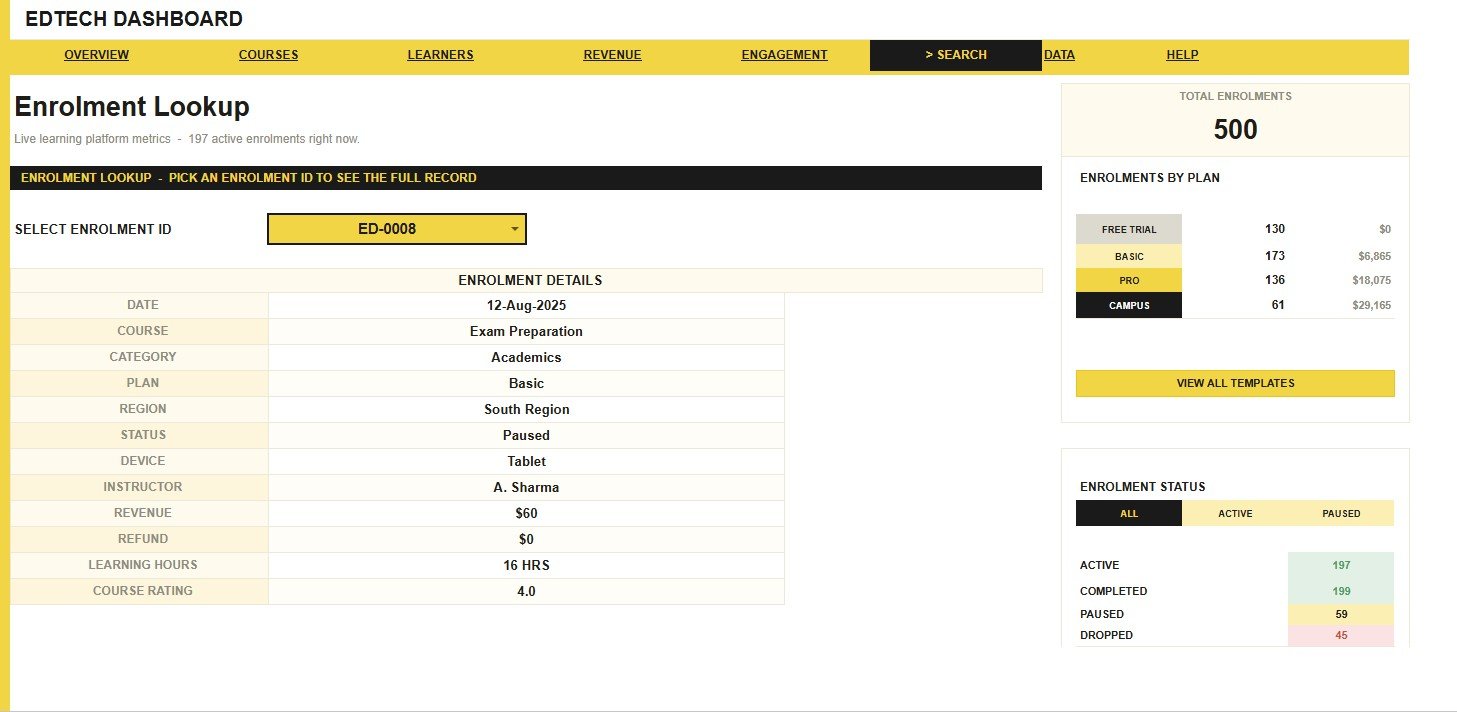
- Enrolment Lookup: Pick an Enrolment ID and see the full learner record without scrolling through the Data Sheet.
- Google Sheets collaboration: Share the file with your team and work from the browser; Google notes that Sheets supports real-time collaboration through shared files.
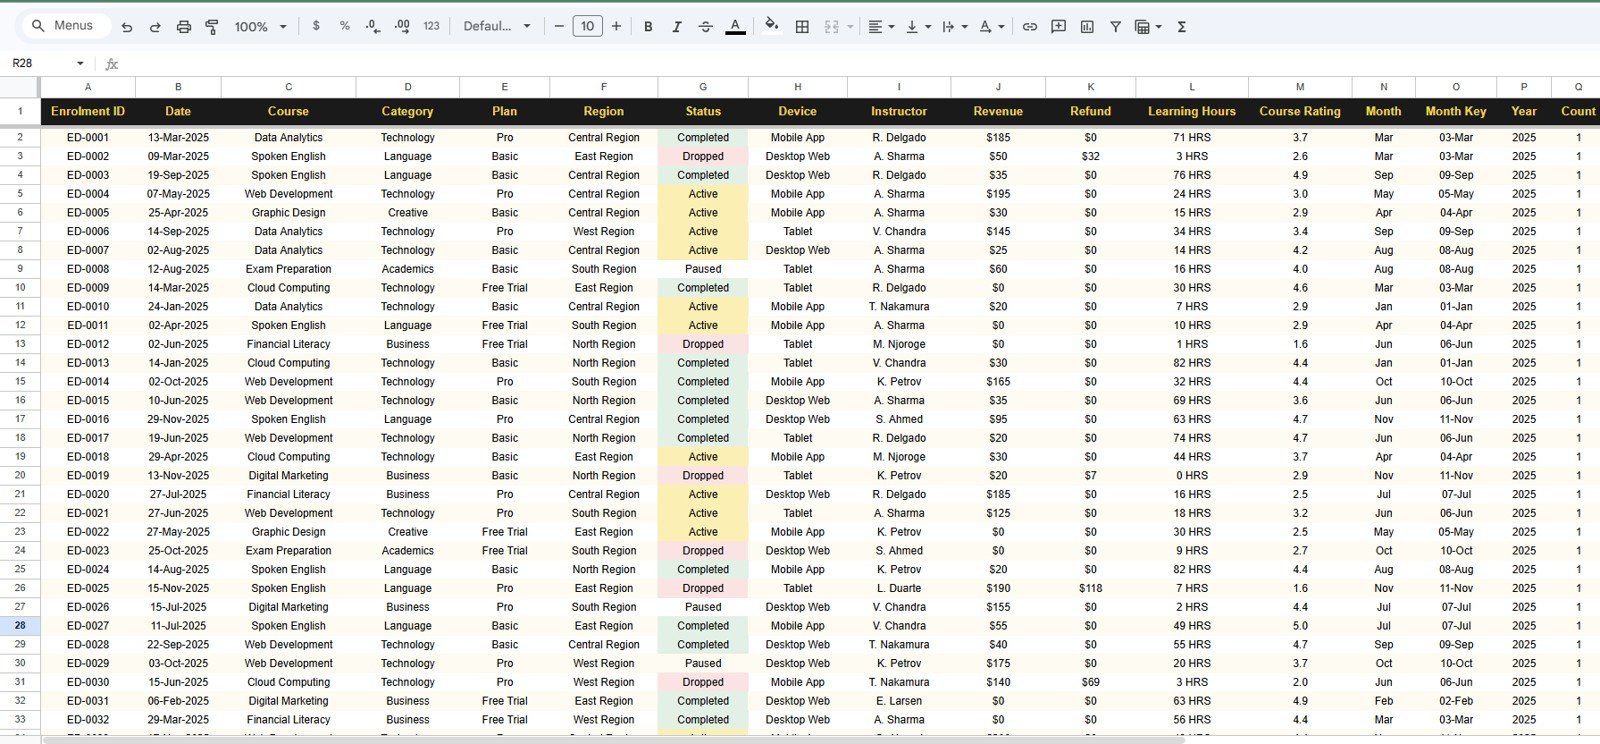
- Editable data structure: Replace the sample records with your own EdTech or LMS export while keeping the same column format.
- One-time purchase: Use the template in your own Google Drive without a per-user analytics subscription.
What’s Inside the EdTech Dashboard in Google Sheets
1 – Overview Page
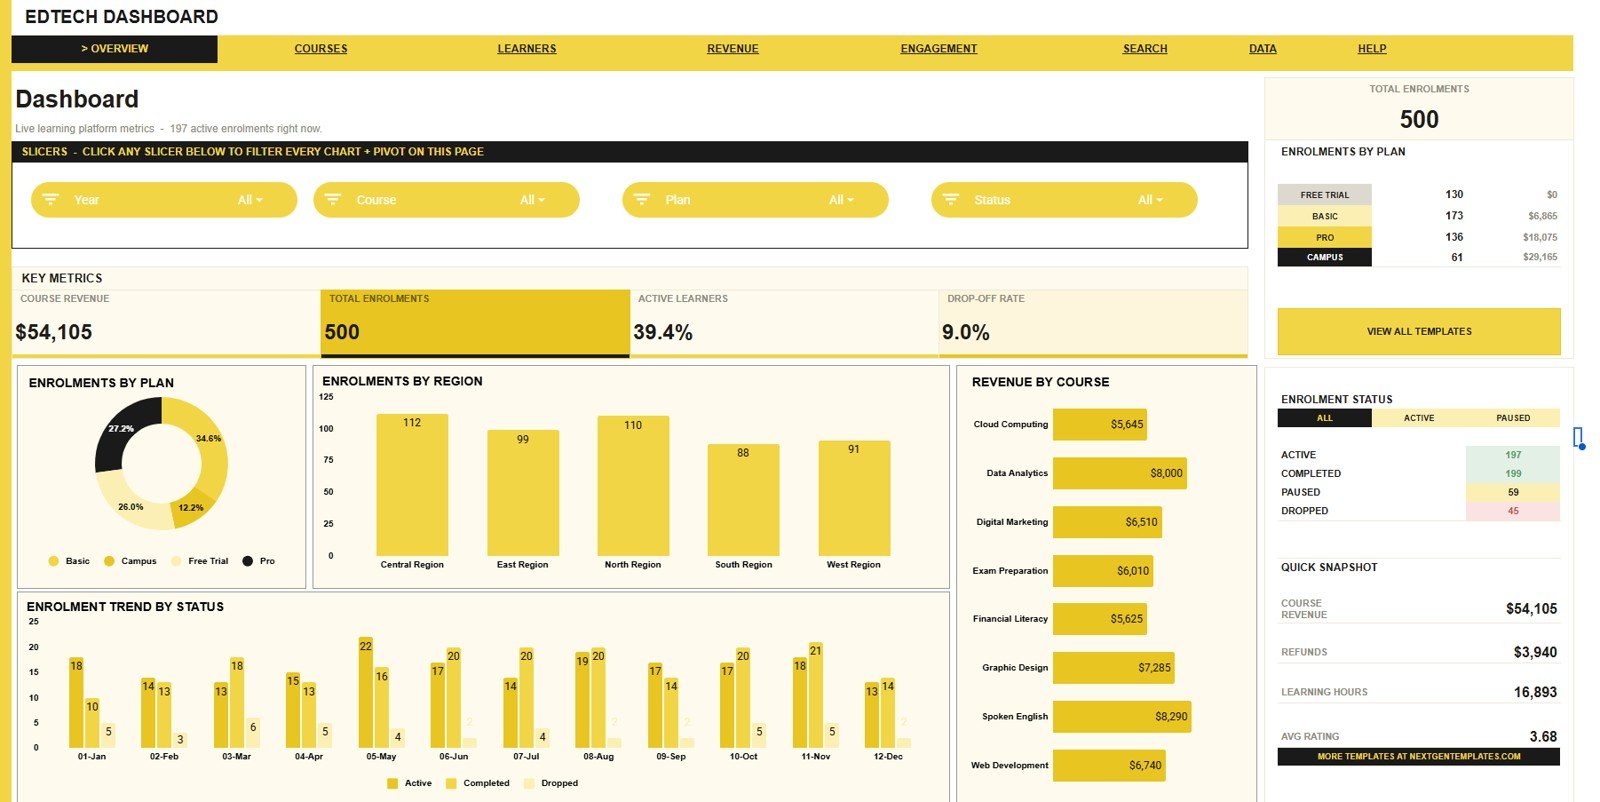
The Overview Page is the management summary for course performance. It shows Course Revenue, Total Enrolments, Active Learners, and Drop-off Rate at the top, followed by slicers and four charts for fast filtering.
Enrolments by Plan: This chart compares learner volume across pricing or access plans. Use it to see which plan type is driving adoption and where plan positioning may need review.
Enrolments by Region: This chart shows where learners are coming from by geography. It helps growth teams compare regional demand and identify markets that need more support.
Revenue by Course: This chart ranks courses by revenue contribution. Use it to identify top earning courses and spot programs that may need pricing, promotion, or content updates.
Enrolment Trend by Status: This chart tracks enrolment movement by status over time. It helps teams understand whether active, completed, dropped, or pending learner groups are changing month by month.
2 – Course Catalogue
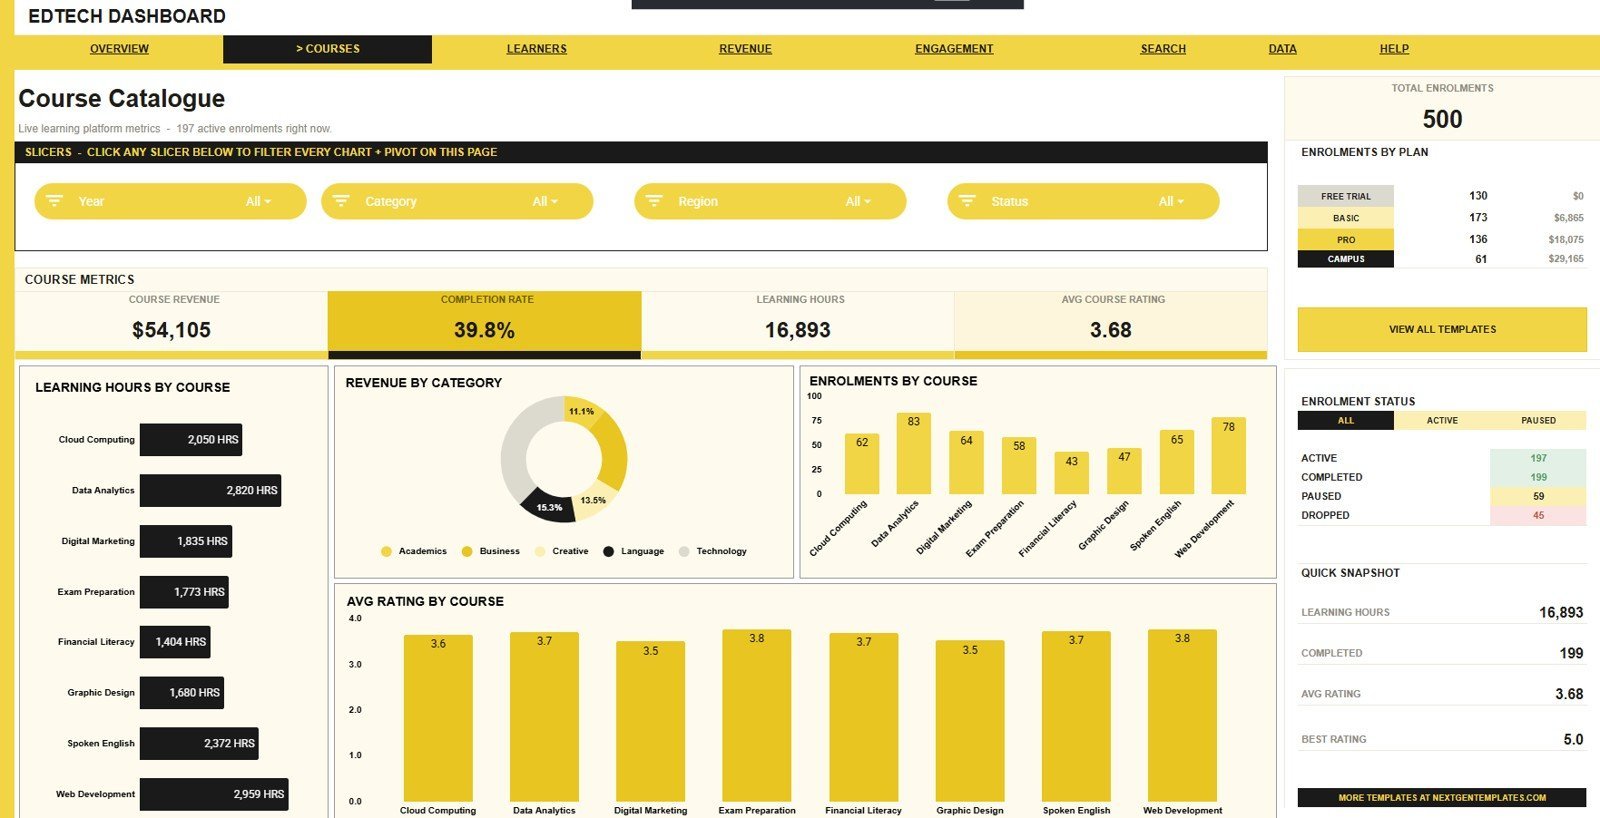
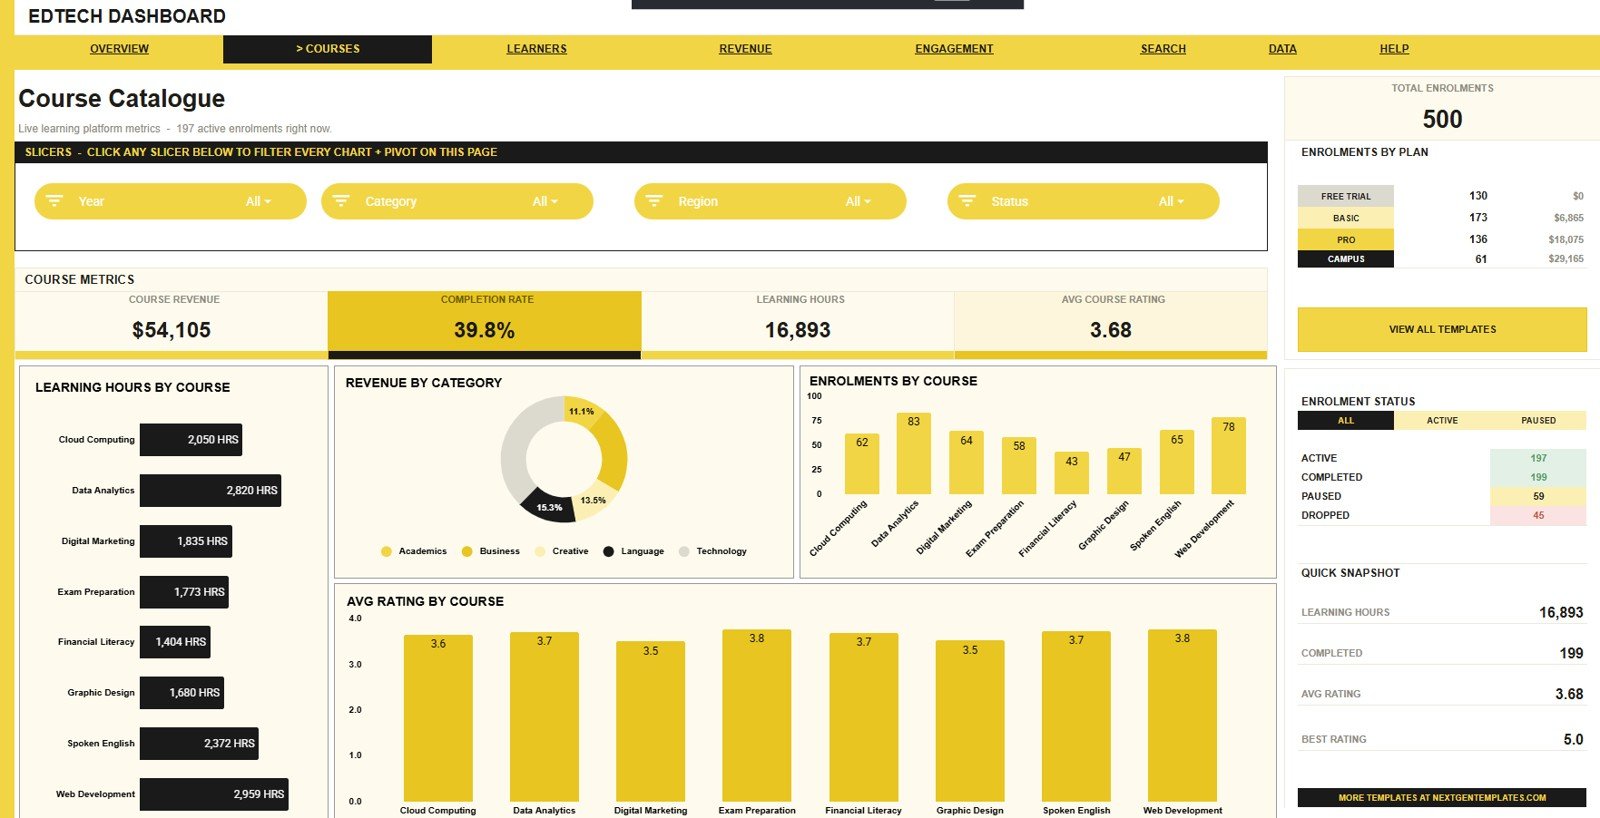
The Course Catalogue tab focuses on course-level performance. It is useful for content managers, course owners, and EdTech operators who need to compare course demand, learning effort, category revenue, and learner ratings.
Learning Hours by Course: This chart compares total learning hours across courses. It helps you identify courses that consume the most learner time and may need deeper curriculum review.
Revenue by Category: This chart groups revenue by course category. It shows which subject areas or learning categories contribute most to monetization.
Enrolments by Course: This chart ranks course popularity by learner count. Use it to find high-demand courses and low-enrolment offers that may need marketing or repositioning.
Avg Rating by Course: This chart compares learner ratings by course. It helps course teams spot quality signals and decide where content updates should happen first.
3 – Learner Insights
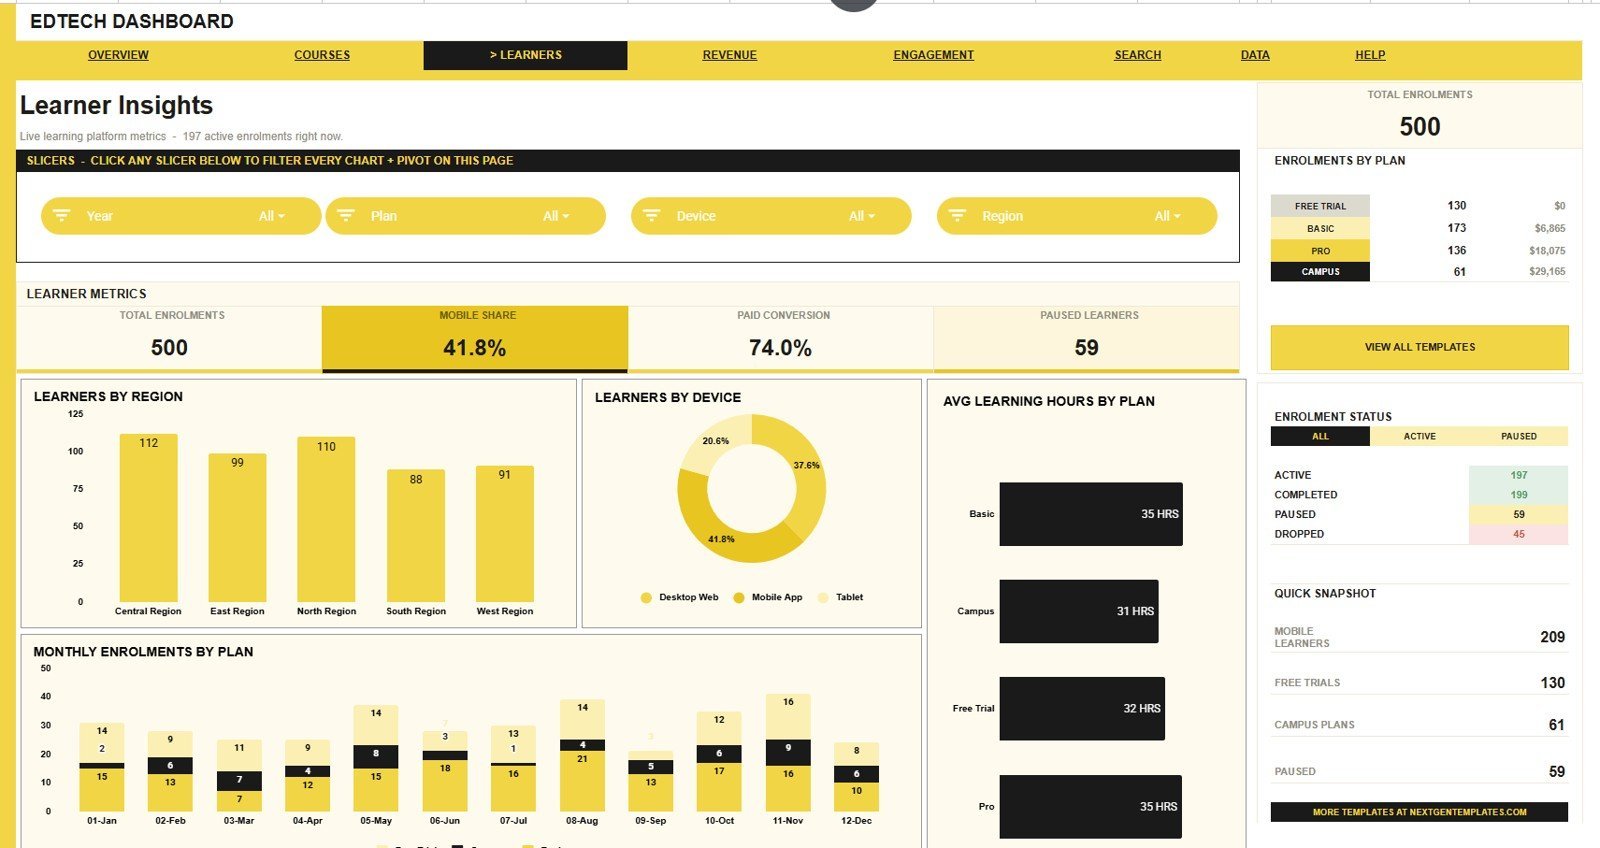
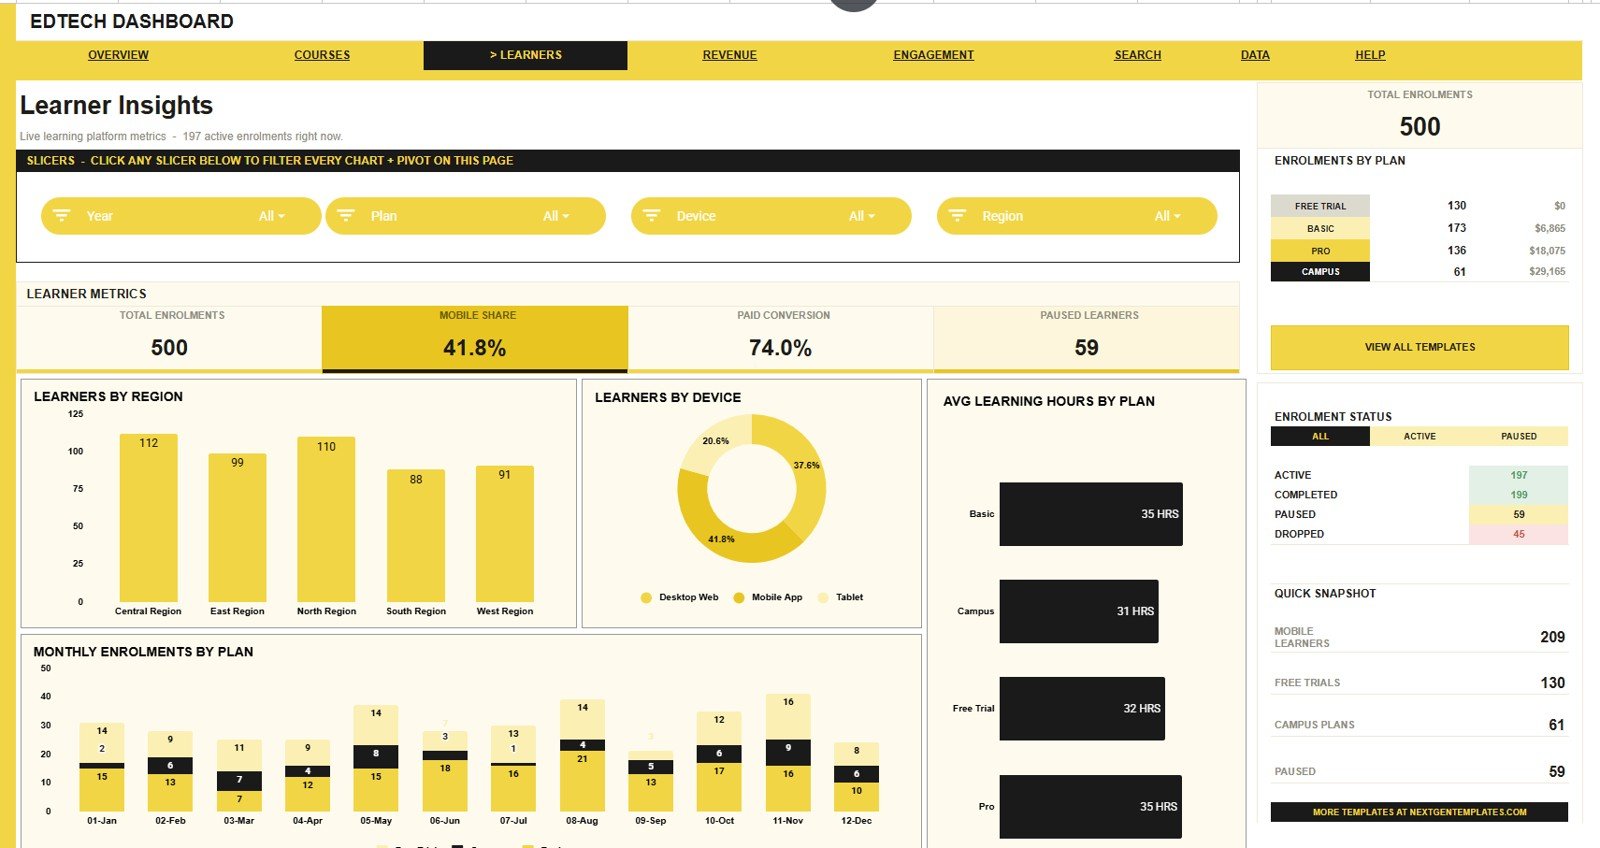
The Learner Insights tab helps you understand who is learning, where they come from, which devices they use, and how plan choice affects learning time. It gives marketing, product, and support teams a cleaner learner profile.
Learners by Region: This chart compares active learner counts by region. It helps local teams plan support coverage, campaigns, and region-specific learner communication.
Learners by Device: This chart shows whether learners use desktop, tablet, or mobile devices. It helps product teams prioritize responsive learning experiences and device testing.
Avg Learning Hours by Plan: This chart compares average engagement time across plans. Use it to see whether premium, free, or trial learners spend more time inside your courses.
Monthly Enrolments by Plan: This chart tracks plan-level enrolments over time. It helps managers see whether pricing changes, campaigns, or academic seasons are shifting the plan mix.
4 – Revenue & Plans
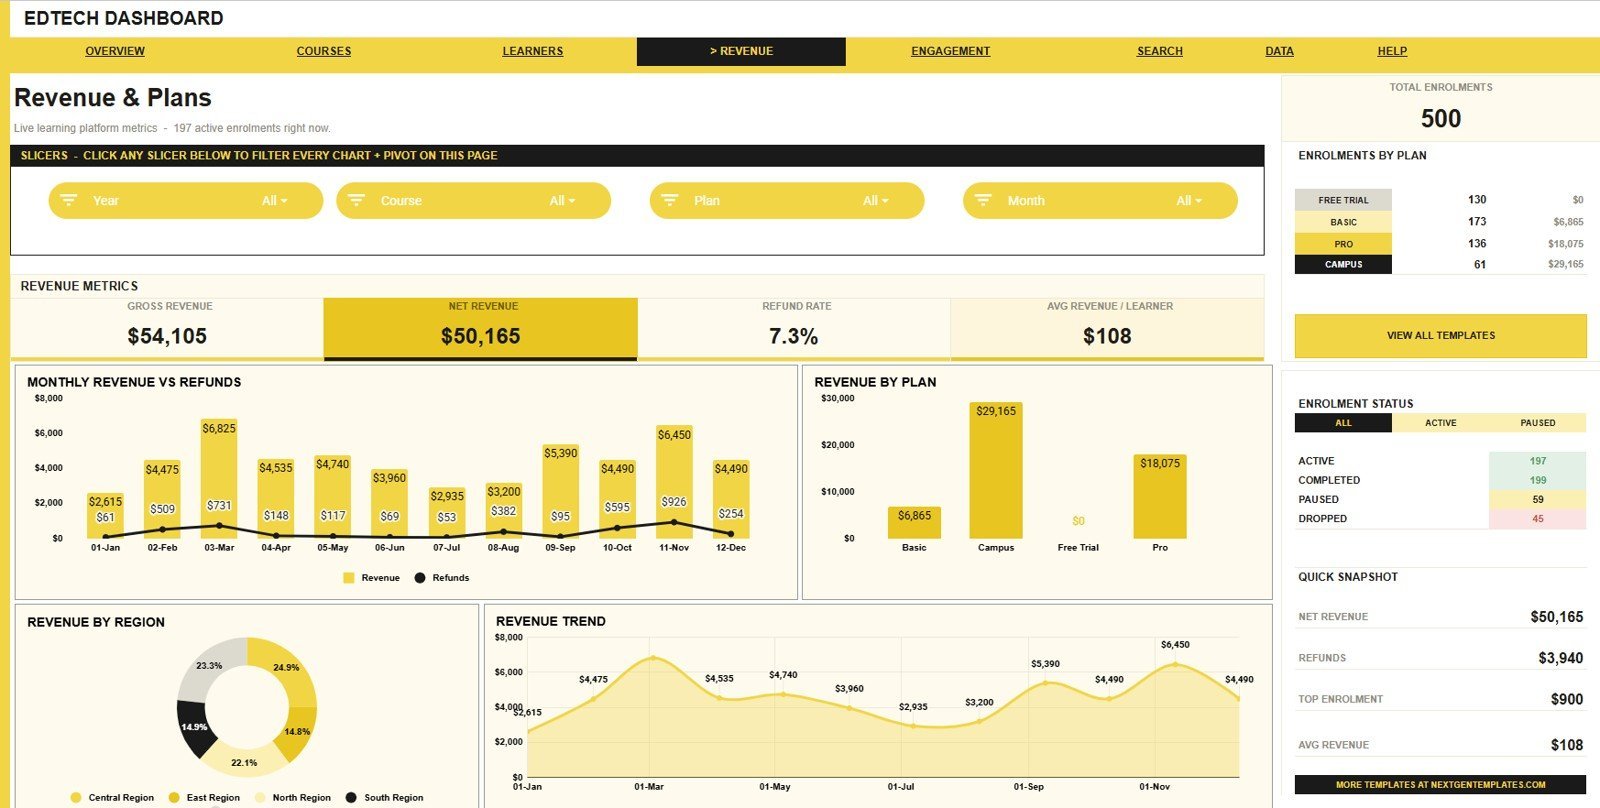
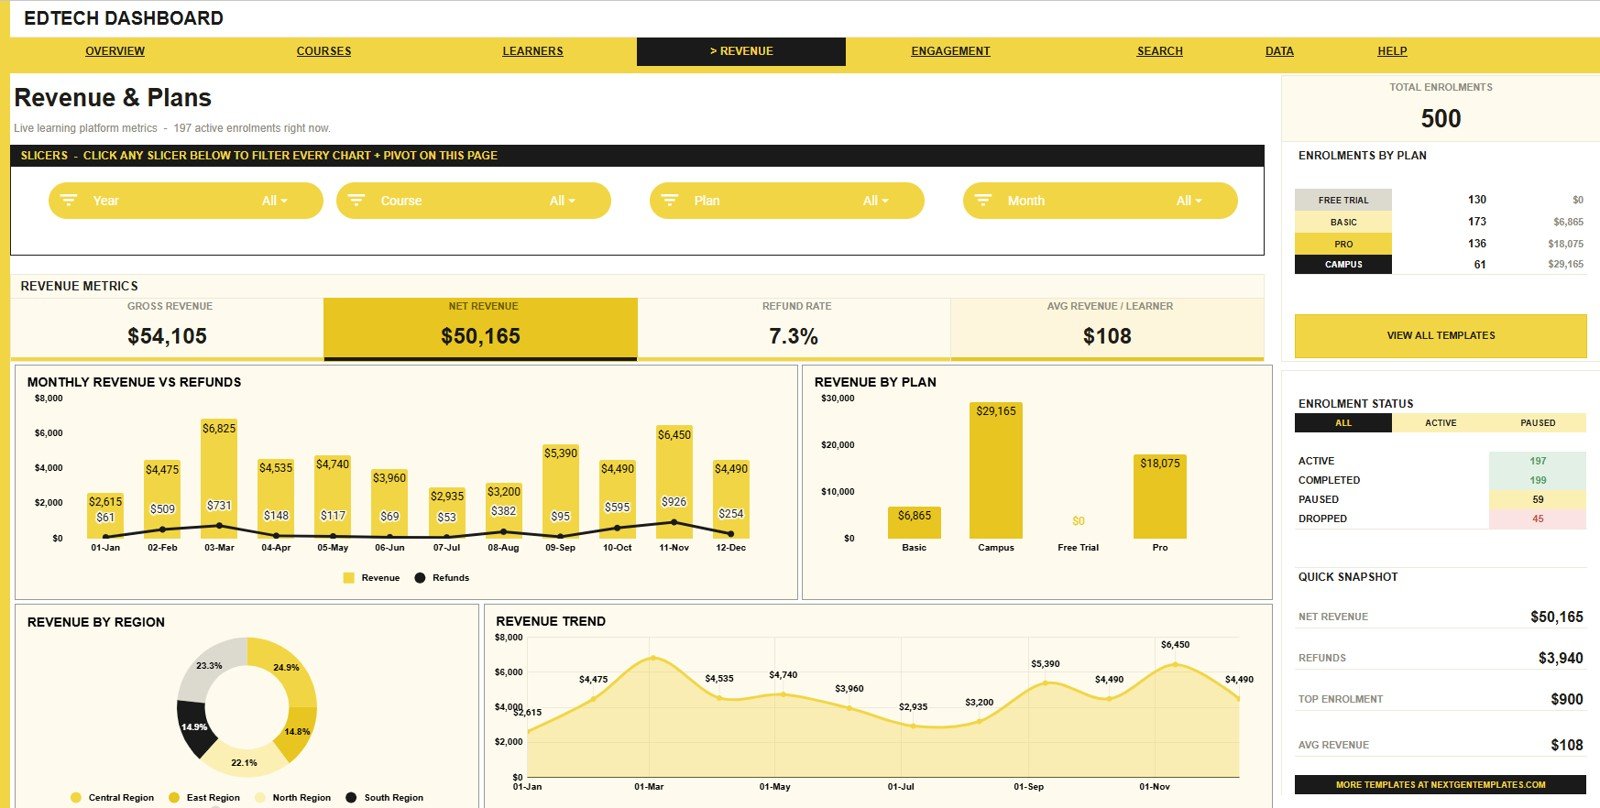
The Revenue & Plans tab is built for financial and commercial review. It separates revenue, refunds, plan performance, regional monetization, and monthly revenue movement.
Revenue and Refunds by Month: This chart places revenue and refunds on a month-by-month timeline. It helps finance teams review whether refund movement is rising alongside sales or concentrated in specific periods.
Revenue by Plan: This chart compares revenue by plan type. It shows which plans generate the most value and whether enrolment volume is translating into paid revenue.
Revenue by Region: This chart compares monetization by region. It helps sales and marketing teams focus on regions with strong revenue potential or weak conversion.
Revenue by Month: This chart shows month-wise revenue movement. Use it for board updates, campaign review, and simple month-over-month performance tracking.
5 – Learning Engagement
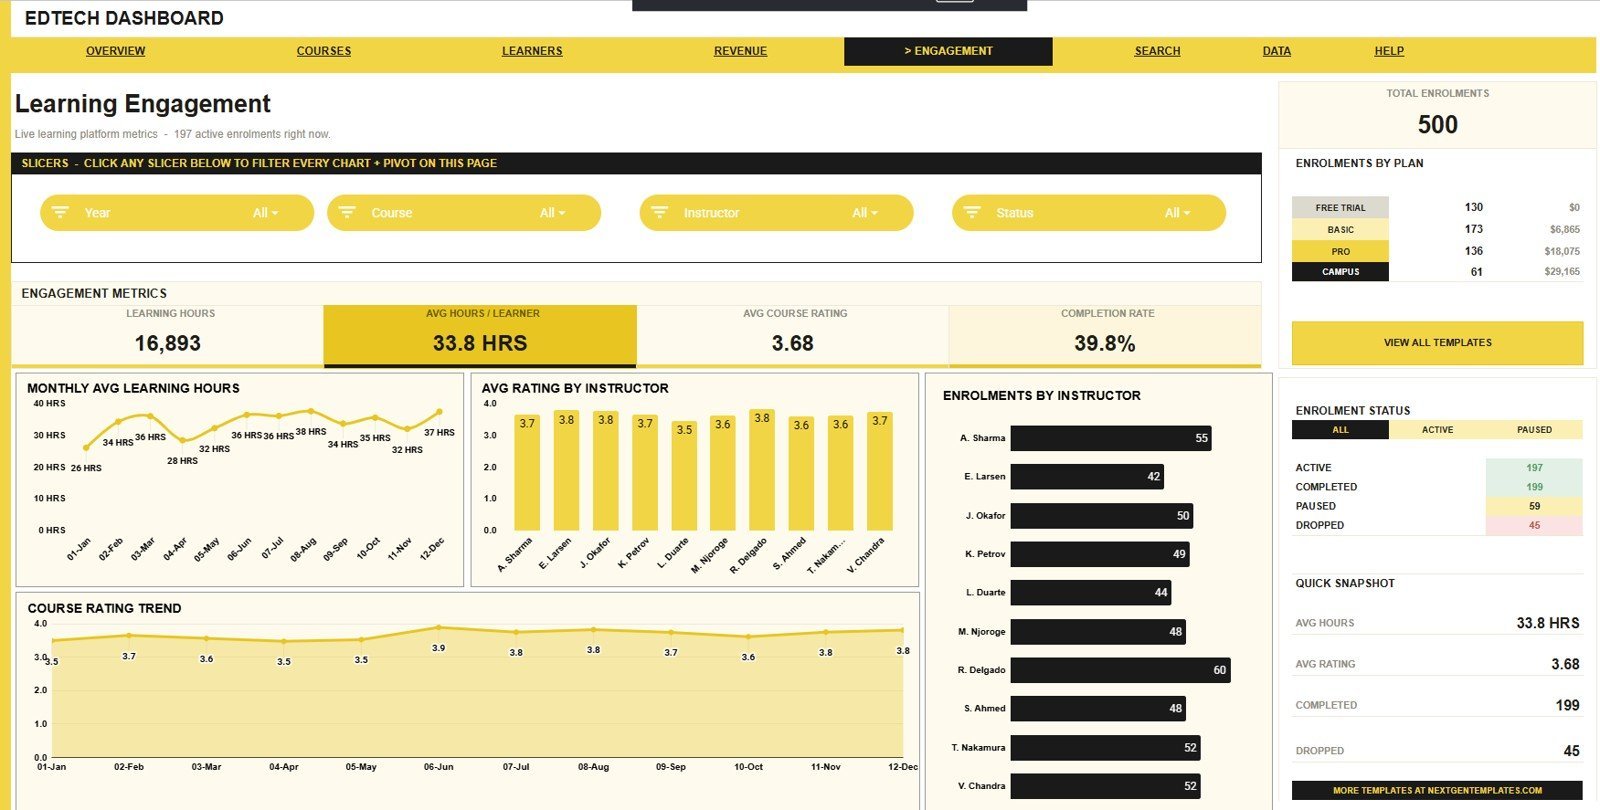
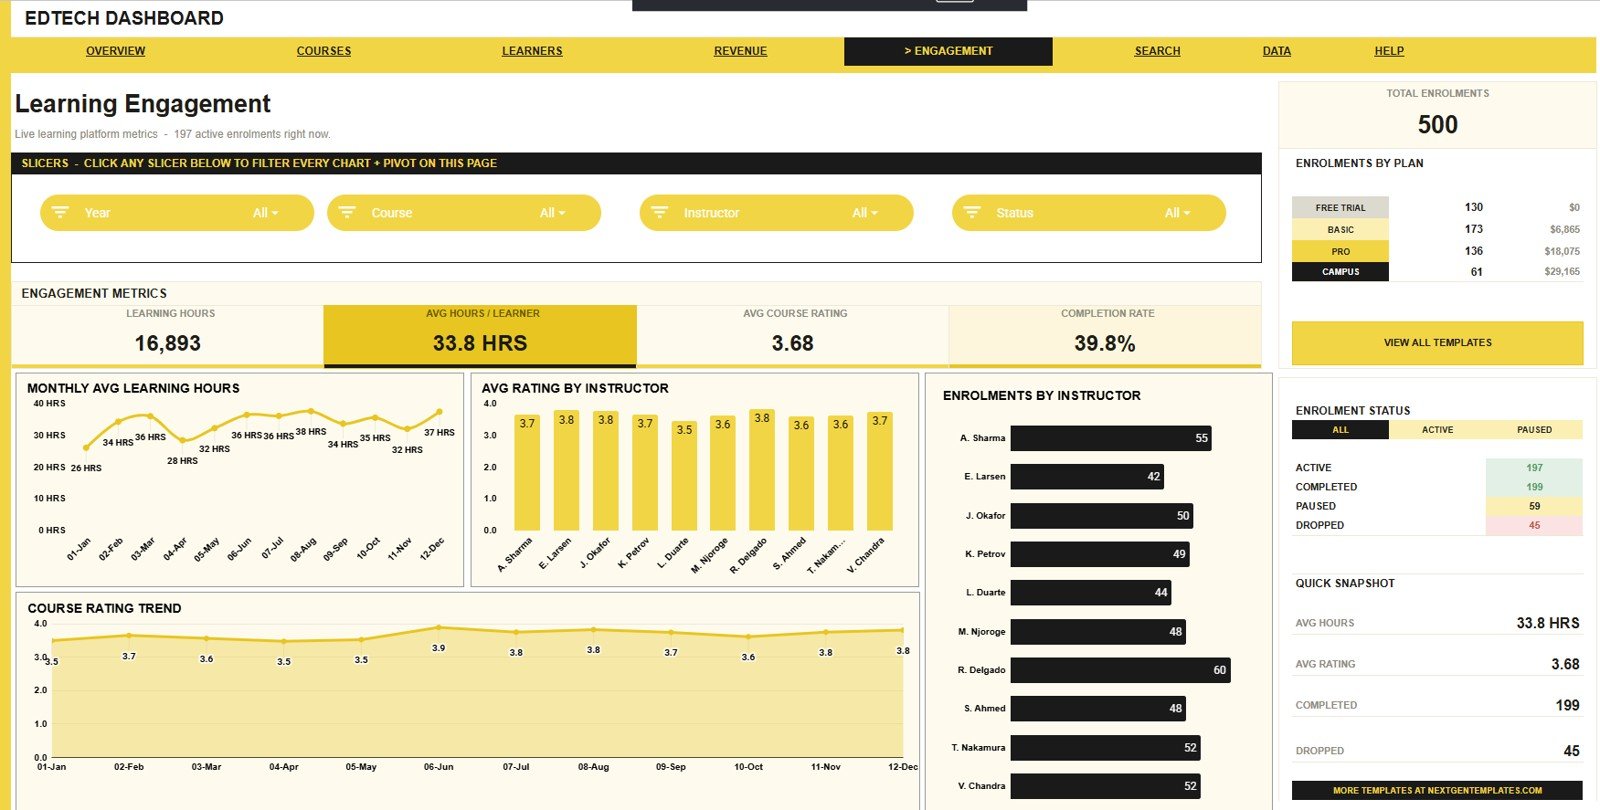
The Learning Engagement tab turns learner behavior into a practical review page. It covers monthly learning hours, instructor quality, instructor enrolment volume, and course rating trends.
Avg Learning Hours by Month: This chart shows whether learner time is increasing or declining over the months. It helps product teams evaluate engagement after releases, campaigns, or curriculum changes.
Avg Rating by Instructor: This chart compares instructor rating averages. It helps training leaders recognize strong instructors and identify where coaching or content support may be useful.
Enrolments by Instructor: This chart shows learner volume linked to instructors. It helps managers compare instructor workload, course ownership, and demand concentration.
Course Rating by Month: This chart tracks rating movement over time. It helps teams detect quality improvements or rating dips after course updates.
6 – Enrolment Lookup
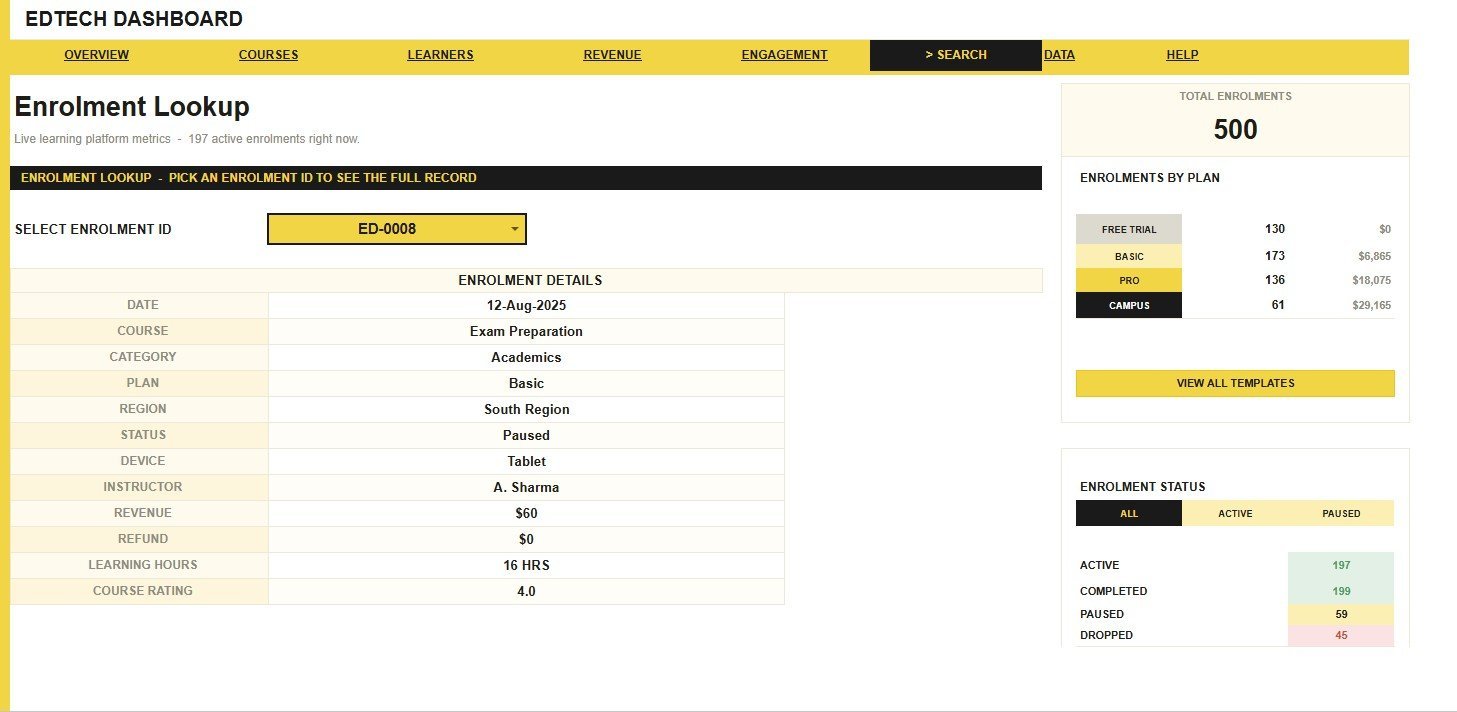
The Enrolment Lookup sheet is the search tab. Users can pick an Enrolment ID and view the full learner record, including date, course, category, plan, region, status, device, instructor, revenue, refund, learning hours, and course rating.
7 – Data Sheet Tab
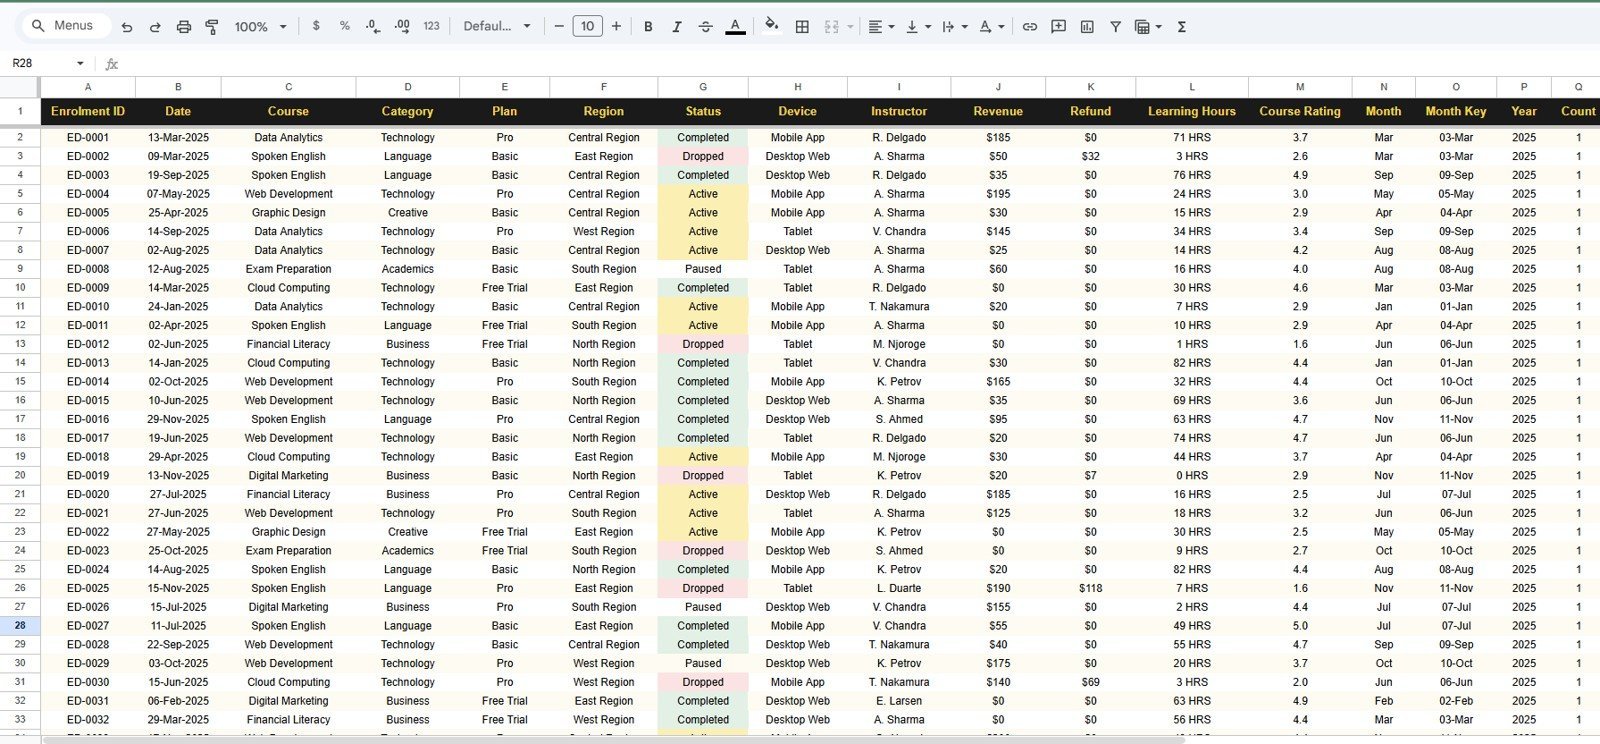
The Data Sheet is where you add or replace the sample records. Keep the same column structure so the cards, slicers, lookup, and dashboard charts continue to read from the data correctly.
EdTech Dashboard in Google Sheets vs. Microsoft Excel Dashboard vs. Paid LMS SaaS – Where This Fits
| Feature | This Google Sheets dashboard | Microsoft Excel dashboard | Paid LMS analytics SaaS |
|---|---|---|---|
| Cost | $9.99 one-time sale price | Template cost plus possible Microsoft 365 cost | Monthly or annual subscription |
| Platform | Google Sheets in browser | Excel desktop or web | Vendor-hosted web app |
| Setup time | Copy file, replace sample data, review dashboards | Open workbook and refresh pivots where needed | Implementation, user setup, and integrations |
| Real-time team collaboration | Native Google Drive sharing | Requires OneDrive or SharePoint | Usually included by plan |
| Mobile access | Google Sheets app and browser | Excel mobile app | Vendor app or browser portal |
| Customizable fields | Edit sheets, labels, charts, formulas, and slicers | Edit workbook structure | Limited by vendor configuration |
| Share with link | Yes, through Google Drive permissions | Yes, if cloud-hosted | Usually requires user accounts |
| Year-1 cost at 5 users | $9.99 template cost | Template plus license cost | Often hundreds or thousands per year |
| Course and learner lookup | Built-in Enrolment Lookup sheet | Possible with custom formulas | Usually tied to LMS records |
| Revenue, refunds, and engagement together | Included in one spreadsheet | Requires workbook build | Depends on paid modules |
Who This Template Is For – and Who It’s Not For
This template is for online course businesses, coaching institutes, EdTech startups, LMS administrators, course operations managers, instructors, finance coordinators, and education consultants who need a quick way to review course revenue, enrolments, learner behavior, and course ratings in Google Sheets.
It is not a full LMS, payment gateway, student portal, certificate engine, CRM, or automated data sync tool. If you need role-based learner accounts, quiz delivery, SCORM tracking, API automation, or regulated student-data workflows, use this template as a reporting layer rather than your operating system.
How to Use the EdTech Dashboard in Google Sheets
- Open the PDF guide included with the download and use the Google Sheets copy link to create your own editable file.
- Go to the Data Sheet and replace the sample records using the same columns and data format.
- Update course names, categories, plans, regions, statuses, devices, and instructors to match your learning business.
- Review the Overview Page for Course Revenue, Total Enrolments, Active Learners, and Drop-off Rate.
- Use slicers on each analysis page to filter charts by course, plan, region, status, device, instructor, or month.
- Open the Enrolment Lookup sheet and select an Enrolment ID to retrieve the full learner record.
Real-World Use Cases
Aarav, founder of an online academy: checks Course Revenue, Revenue by Course, and Enrolment Trend by Status before deciding which courses to promote next month.
Maya, learner success manager: uses Drop-off Rate, Avg Learning Hours by Plan, and Course Rating by Month to identify where learner engagement is slipping.
Jordan, course operations lead: reviews Enrolments by Instructor and Avg Rating by Instructor before assigning new cohorts and planning instructor coaching.
Frequently Asked Questions
What does the EdTech Dashboard in Google Sheets track?
It tracks course revenue, total enrolments, active learners, drop-off rate, enrolments by plan and region, revenue by course, learning hours, plan trends, refunds, instructor activity, course ratings, and individual enrolment records.
How many tabs are included?
The template includes 7 tabs: Overview, Course Catalogue, Learner Insights, Revenue & Plans, Learning Engagement, Enrolment Lookup, and Data Sheet.
Can I use it with my LMS export?
Yes, if your LMS export can be shaped into the same columns as the Data Sheet. Paste or import your records in the same format and the dashboard pages will read from that table.
Does it require scripts or add-ons?
No script or add-on requirement is described for this template. It is designed as a Google Sheets dashboard using sheet data, charts, slicers, lookup logic, and editable tables.
Can multiple people use the dashboard?
Yes. You can share the file through Google Drive. Google Help explains that shared Docs, Sheets, and Slides files can support many collaborators with view, comment, or edit permissions.
Is this a replacement for a learning management system?
No. This is a reporting dashboard. It helps you analyze course, learner, revenue, and engagement data, but it does not host lessons, quizzes, certificates, learner accounts, or payment checkout.
About the Author
Built by PK – Microsoft Certified Professional with 15+ years of Excel, Google Sheets, and Power BI experience. Founder of NextGenTemplates, reaching 300K+ subscribers across YouTube channels. Every template is hand-built and tested before release.
Explore Related Templates
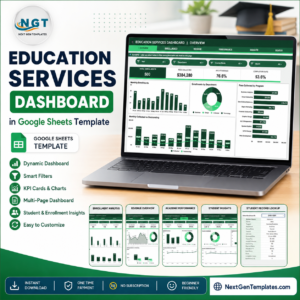
- Education Services Dashboard in Google Sheets for broader education services reporting.
- EdTech KPI Dashboard in Google Sheets for KPI-style target tracking.
- Education KPI Dashboard in Google Sheets for institution-level KPI monitoring.
- Student Academic Insights Dashboard in Google Sheets for academic and fee analysis.
- Browse Google Sheets templates.
- Browse Google Sheets dashboard templates.
Download the EdTech Dashboard in Google Sheets to track course revenue, enrolments, learner engagement, refunds, instructor activity, and course ratings in one editable Google Sheets file.
Watch the step-by-step video Demo:
Last updated: August 9, 2026.











Reviews
There are no reviews yet.