


In today’s cost-conscious education and corporate training environments, tracking spending efficiency is just as important as tracking learning outcomes. Whether you run a corporate L&D team, a university program, or a nonprofit training department, the Education and Learning Cost Efficiency KPI Dashboard in Excel offers a complete solution to monitor, analyze, and improve your education-related spending.
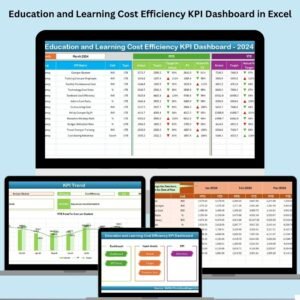
This ready-to-use Excel dashboard is designed to provide you with monthly and year-to-date (YTD) performance visibility using interactive visuals, drop-downs, and smart formulas—all built in Excel.
🧭 What’s Inside the Dashboard?
This dynamic Excel tool includes 7 professionally designed worksheets, giving you full control and insight into your cost-efficiency KPIs:
🏠 1. Home Sheet – Easy Navigation

Six smart buttons for one-click access to each worksheet.
Clean layout, no coding or advanced Excel skills required.
📊 2. Dashboard Sheet – Performance Snapshot
Select a Month (cell D3), and instantly view:
MTD and YTD Actuals
Comparison vs Targets
Comparison vs Previous Year
🎯 Built-in up/down arrows and conditional formatting highlight performance status at a glance.
📈 3. KPI Trend Sheet – Analyze Trends Over Time
Pick any KPI from a drop-down.
View:
KPI Group, Unit, Type (UTB or LTB), and Formula
MTD and YTD trend lines across months
This is where your data tells a story.
📥 4. Actual Numbers Input Sheet – Monthly Data Entry
Select the starting month once, and the rest of the year populates automatically.
Input MTD and YTD actuals for each KPI in an intuitive format.
🎯 5. Target Sheet – Set Smart Goals
Define monthly and yearly targets for each KPI.
Compare actuals with these to gauge performance.
📆 6. Previous Year Number Sheet – For Long-Term Comparison
Record historical values to enable powerful year-over-year analysis.
📖 7. KPI Definition Sheet – Team Alignment
Each KPI includes:
KPI Name & Group
Unit of measurement
Formula
Clear, concise definition
Ensures everyone interprets metrics the same way.
✅ Benefits of Using This Dashboard
✨ Transparency – See exactly where your learning budget is being used.
📊 Data-Driven Insights – Replace guesswork with reliable performance metrics.
🔍 Benchmarking – Compare progress against previous years and set meaningful targets.
📉 Cost Optimization – Identify overspending, underutilization, or opportunities for savings.
🧠 Decision Support – Present insights to leadership using visually engaging trend charts.
🔧 Real-Life Example
Let’s say your “Cost per Learner” for Jan 2024 is ₹100, while the target is ₹90. The dashboard immediately shows the variance with a down arrow. By June, if the cost drops to ₹85, a green up arrow appears—visually confirming your efficiency improvement.
🎓 Who Should Use This?
📘 Corporate Training Teams
🏫 Universities & Colleges
🎯 Learning & Development (L&D) Managers
💼 HR & Talent Development Teams
📊 Nonprofits & NGOs running skill programs
📘 Best Practices for Success
📅 Update data monthly – consistency drives accuracy.
🔁 Use historical data – benchmark and analyze long-term trends.
🧭 Set realistic targets – informed by historical numbers.
✅ Train your team – ensure uniform understanding of KPI meanings.
🎨 Leverage visuals – trend charts help tell your performance story.
📘 Why Excel?
Excel remains the most accessible and flexible tool:
Familiar to most users
No internet or software subscription needed
Built-in formulas, conditional formatting, and visuals
Easy to customize, scale, or export
📍 Conclusion
The Education and Learning Cost Efficiency KPI Dashboard in Excel is your ultimate tool to track spending, benchmark performance, and make informed decisions for any learning-focused initiative.
Whether you’re cutting costs, improving program ROI, or just ensuring budget utilization is on point—this dashboard will give you the visibility you need.
▶️ Visit our YouTube Channel for step-by-step video guides.
🔗 Click here to read the Detailed blog post







Reviews
There are no reviews yet.