

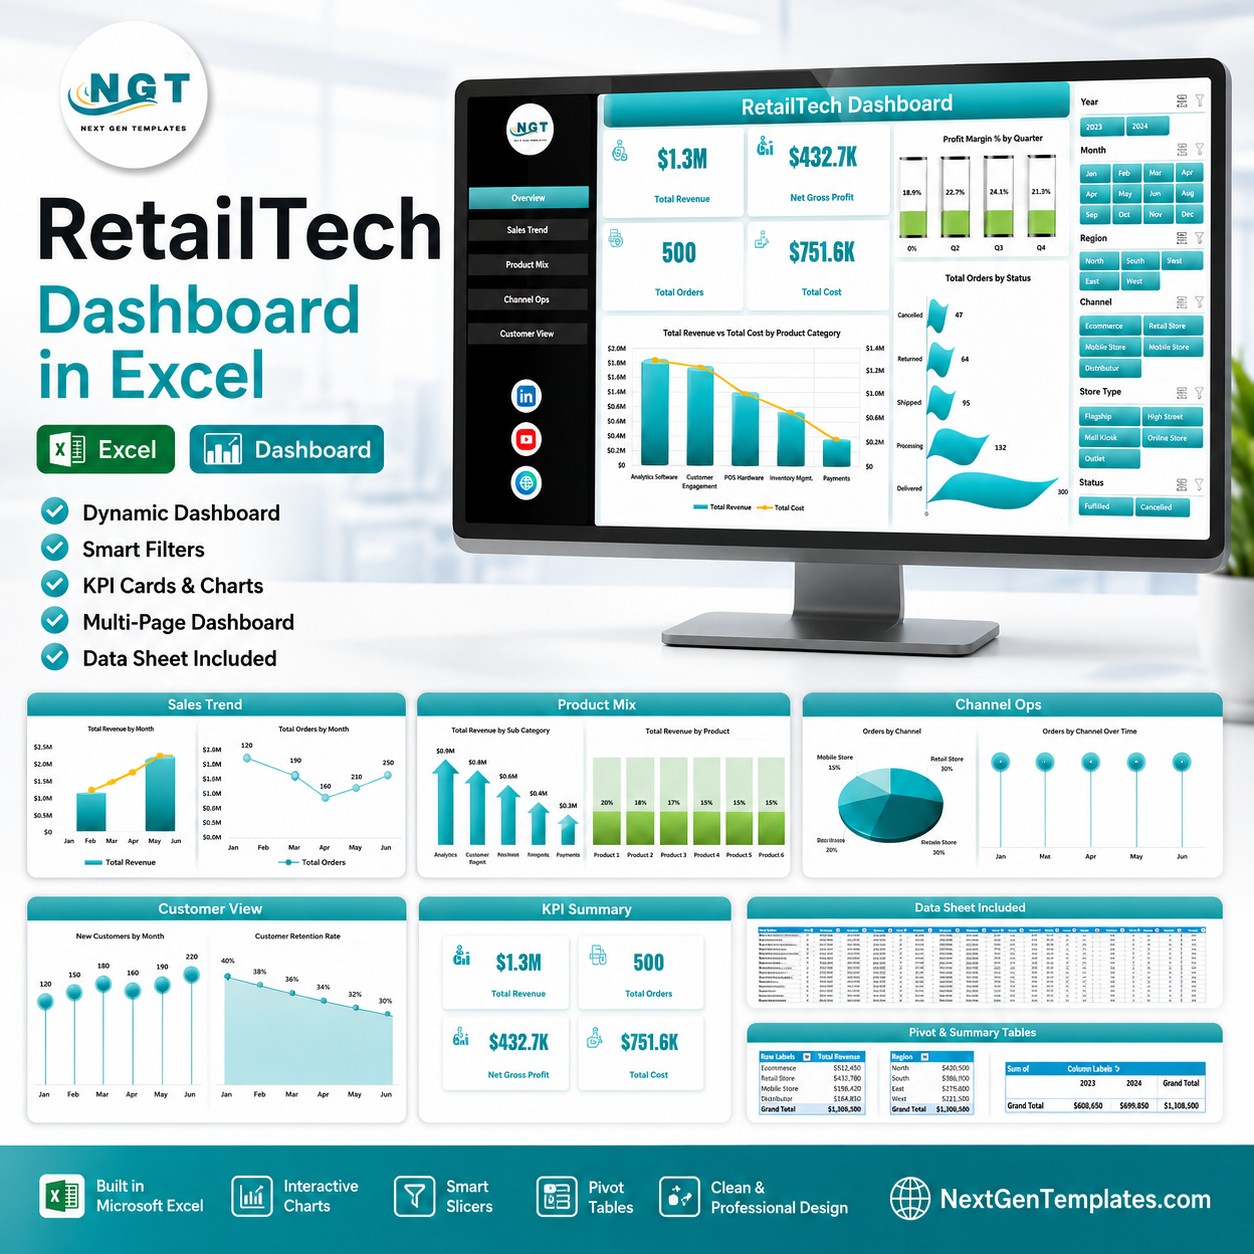


RetailTech Dashboard in Excel helps retail owners, store managers, ecommerce operators, and analysts review revenue, costs, orders, profit margin, product mix, channels, customers, and support workload from one ready-to-use workbook. Instead of paying for another reporting SaaS or building a dashboard from scratch, you can start with structured sample data, prebuilt pivot tables, slicers, and seven practical worksheet tabs. Replace the sample data with your own retail records, refresh the workbook, and use the dashboard to spot sales trends, margin issues, operational bottlenecks, and customer patterns faster.
This template is built for teams that need a practical Excel retail analytics dashboard without a long setup cycle. It is especially useful when your retail data is already exported from POS, ecommerce, ERP, CRM, or support systems into Excel or CSV files.
RetailTech Dashboard in Excel
Key Features of RetailTech Dashboard in Excel
- Seven worksheet tabs for executive summary, sales trend, product mix, channel operations, customer view, raw data, and pivot support.
- Top-level KPI cards for Total Revenue, Net Gross Profit, Total Orders, and Total Cost.
- Interactive slicers to filter the dashboard by retail dimensions and review the data quickly.
- Pivot-based charts that update after the data sheet is refreshed.
- Revenue, cost, order, profit margin, rating, and support ticket analysis across multiple retail views.
- Editable data sheet where users can add retail transactions in the same structure as the sample data.
- Support sheet with pivot tables that can be hidden after setup.
What’s Inside the RetailTech Dashboard in Excel
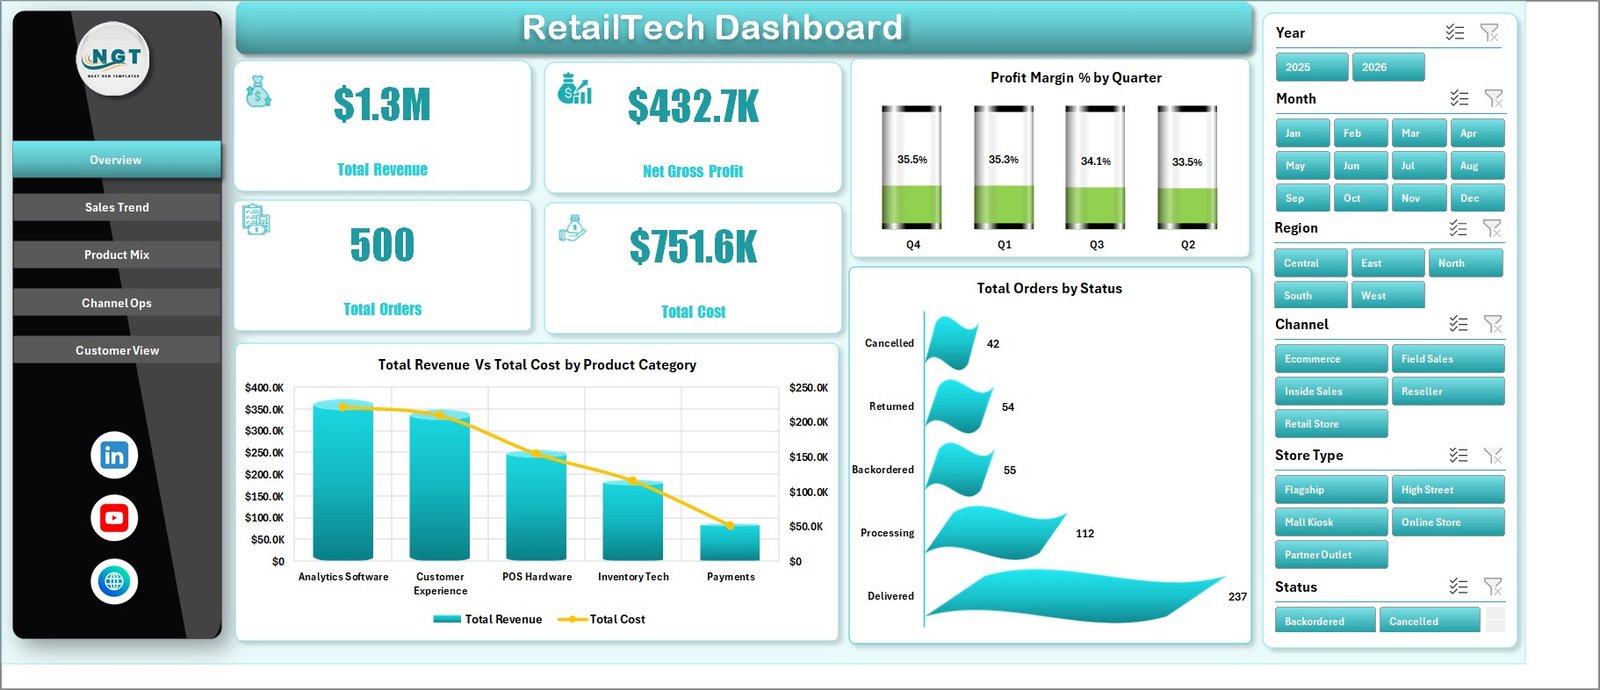
Overview Page: The Overview sheet gives a high-level snapshot of retail performance. KPI cards show Total Revenue, Net Gross Profit, Total Orders, and Total Cost so leadership can understand the current state before reviewing detailed charts.
Profit Margin % by Quarter: This chart shows how margin changes across quarters, making it easier to identify seasonal pressure or improvement. Use it to compare profitability over time rather than looking only at top-line revenue.
Total Revenue Vs Total Cost by Product Category: This chart compares sales and cost side by side for each product category. It helps identify categories that generate strong revenue but may carry high cost or weaker margin.
Total Orders by Status: This chart groups orders by status so you can review completed, pending, cancelled, or other workflow outcomes. It is useful for spotting order processing issues and fulfillment risk.
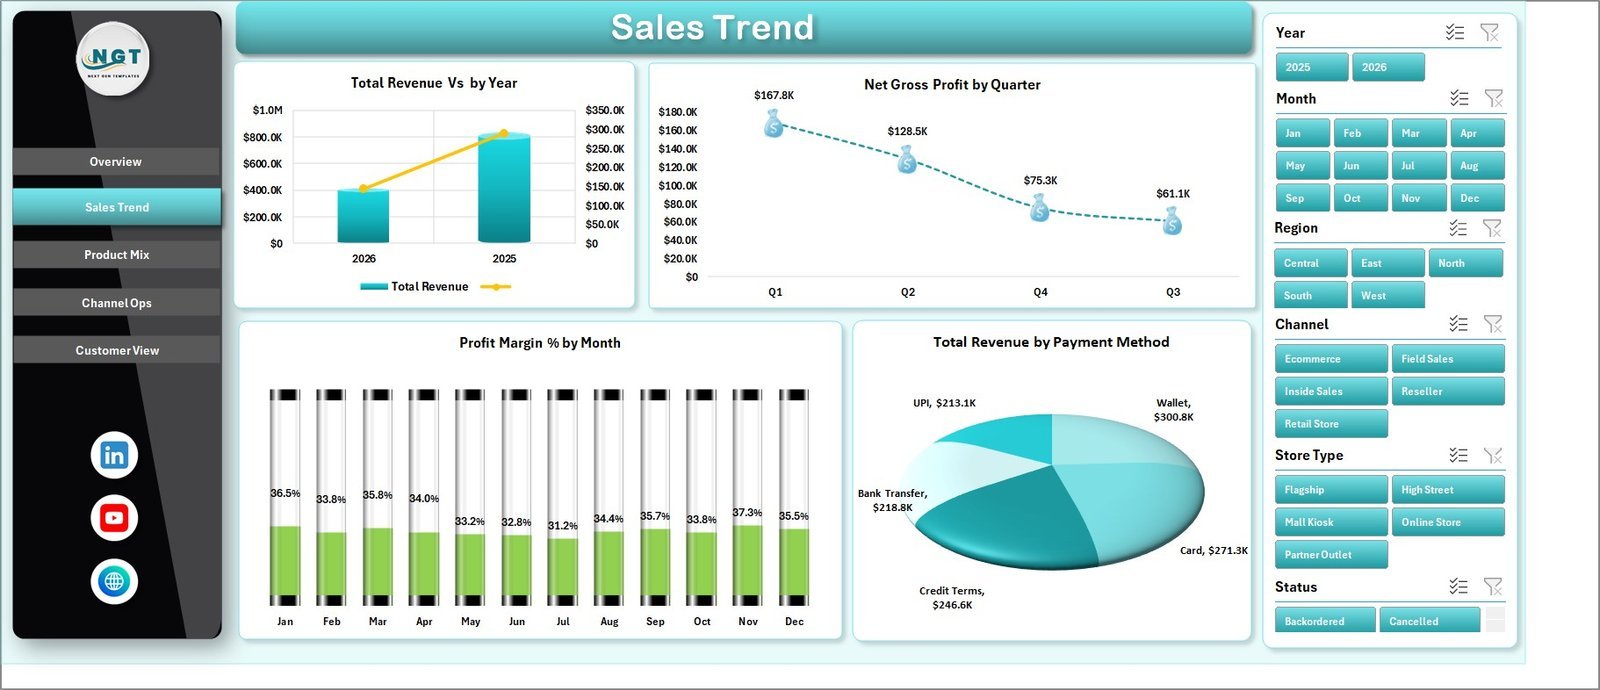
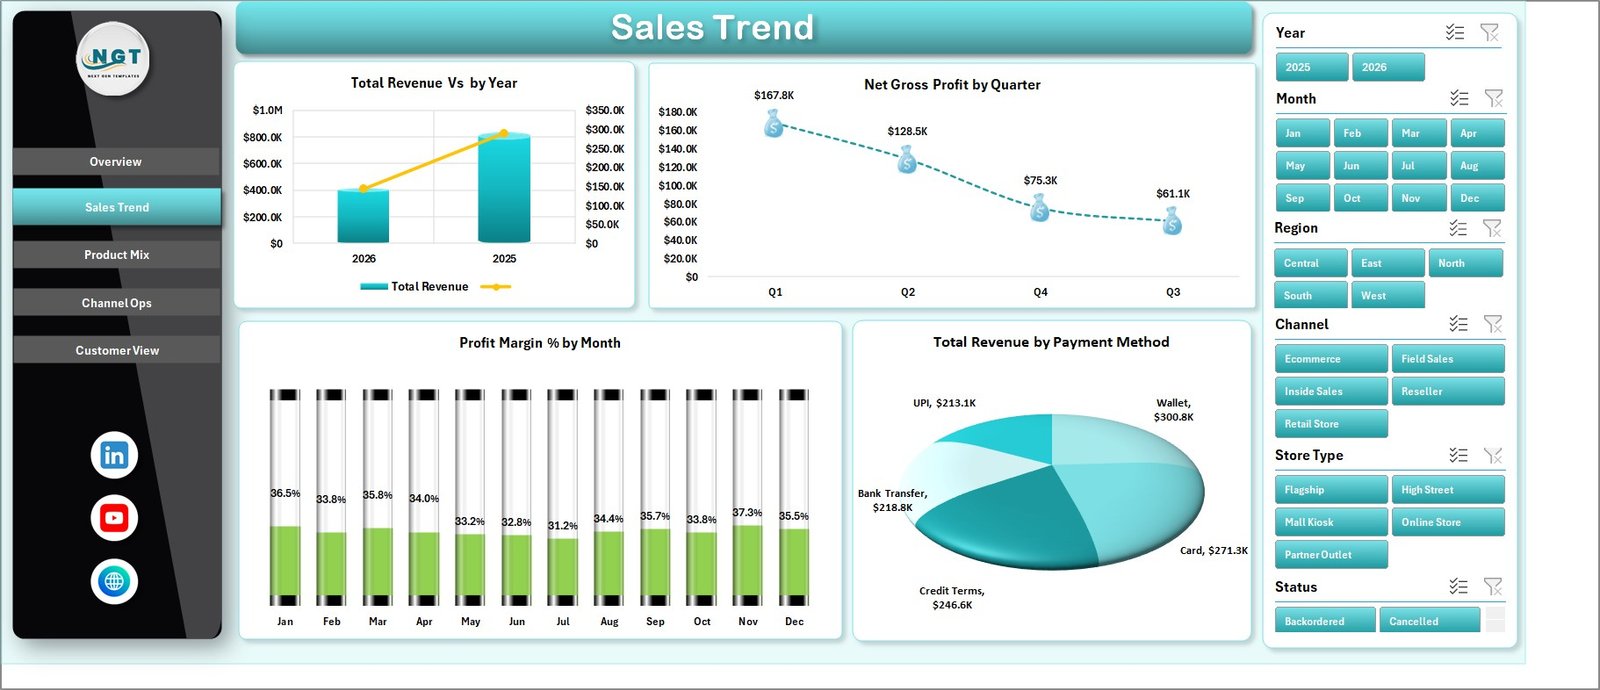
Sales Trend: This page includes Total Revenue by Year, Net Gross Profit by Quarter, Profit Margin % by Month, and Total Revenue by Payment Method. It helps retail teams review long-term growth, quarterly profitability, monthly margin movement, and payment behavior.
Sales Trend
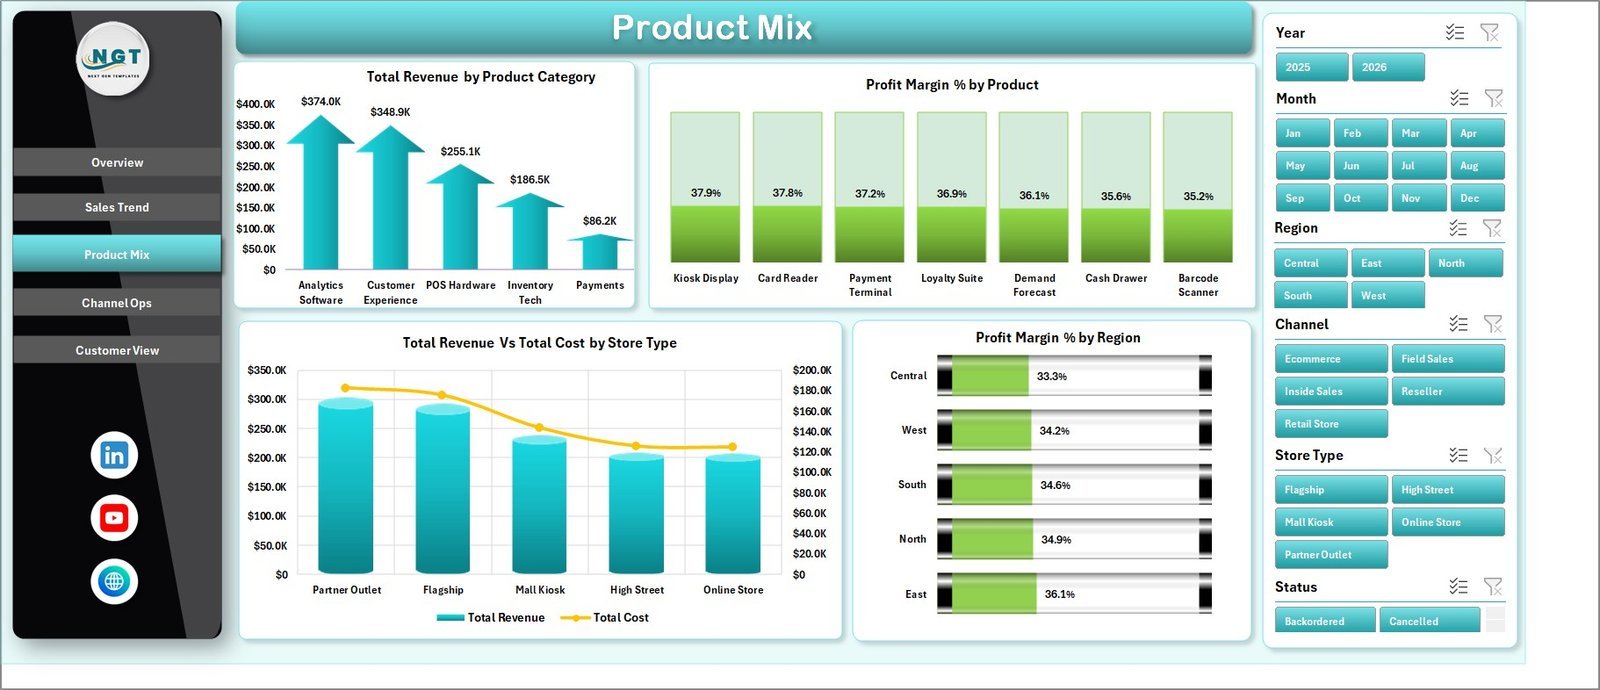
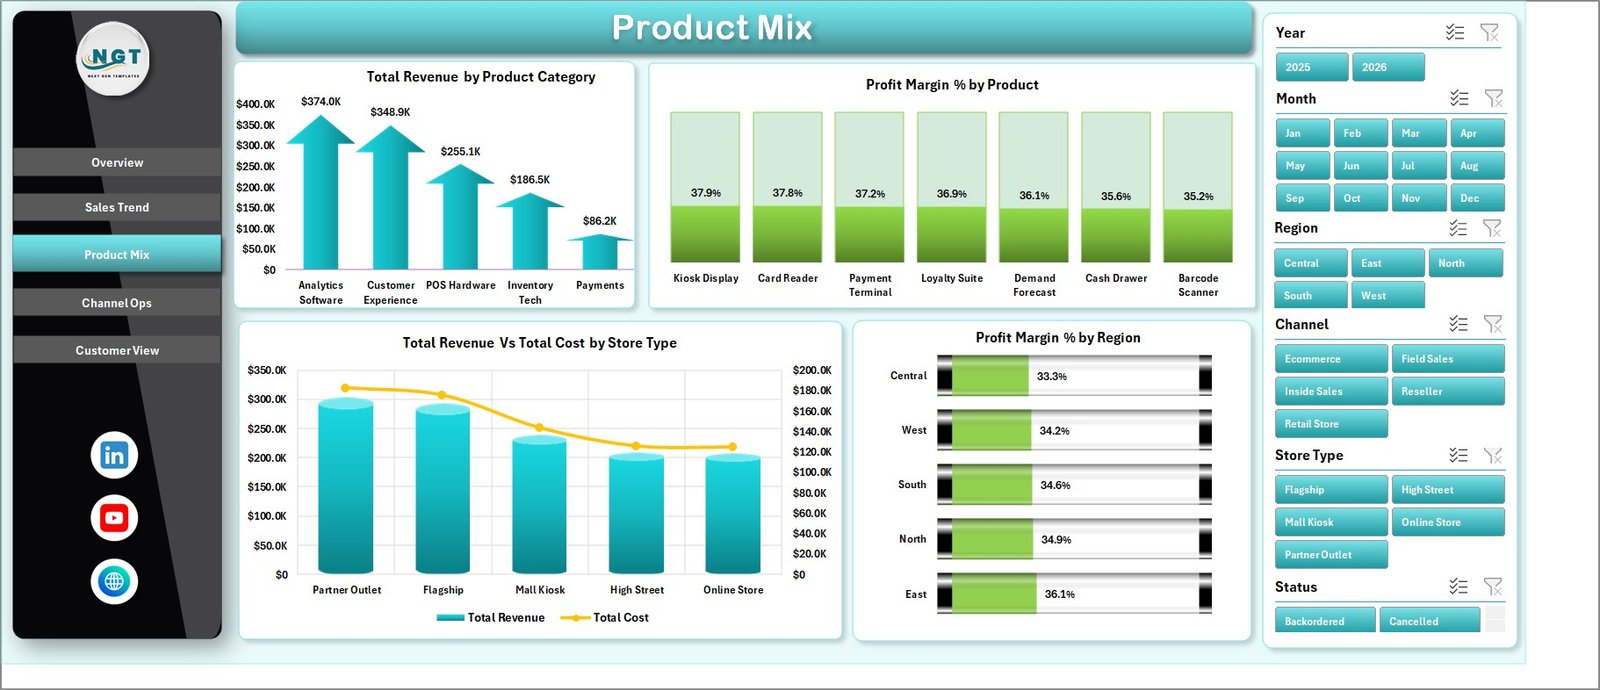
Product Mix: This page reviews Total Revenue by Product Category, Profit Margin % by Product, Total Revenue Vs Total Cost by Store Type, and Profit Margin % by Region. It is designed for decisions about category focus, product pricing, store format, and regional profitability.
Product Mix
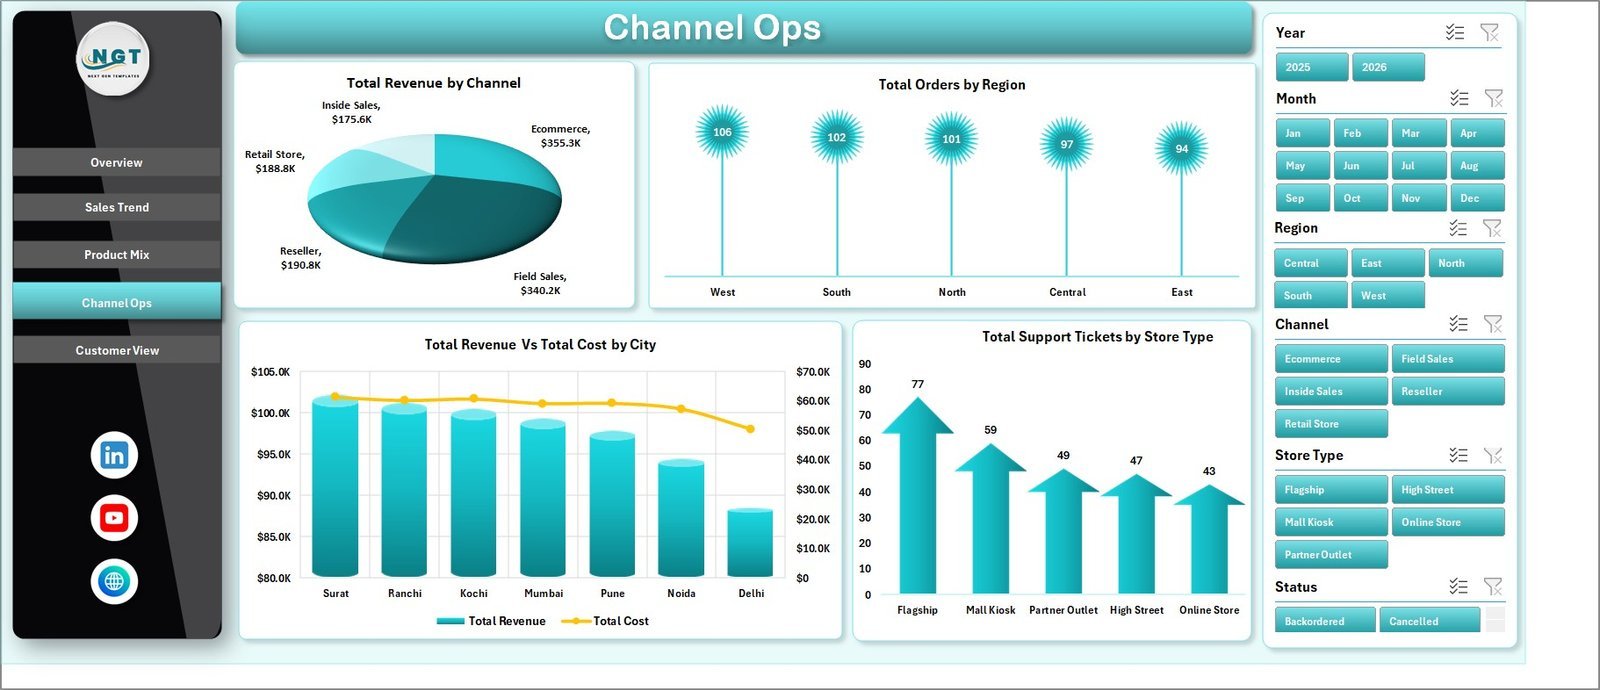
Channel Ops: This page includes Total Revenue by Channel, Total Orders by Region, Total Revenue Vs Total Cost by City, and Total Support Tickets by Store Type. It connects sales channels with operational workload so you can see where growth and service demand are coming from.
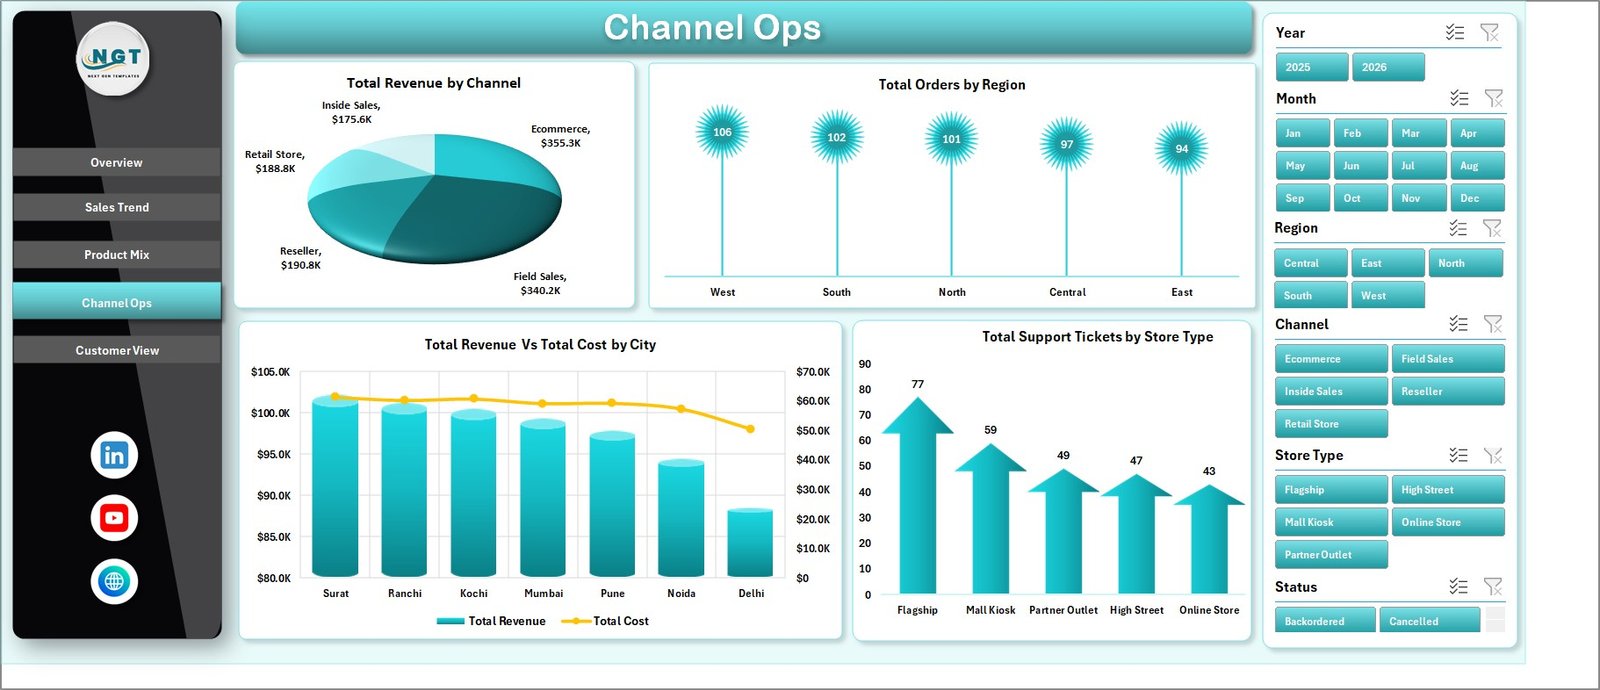
Channel Ops
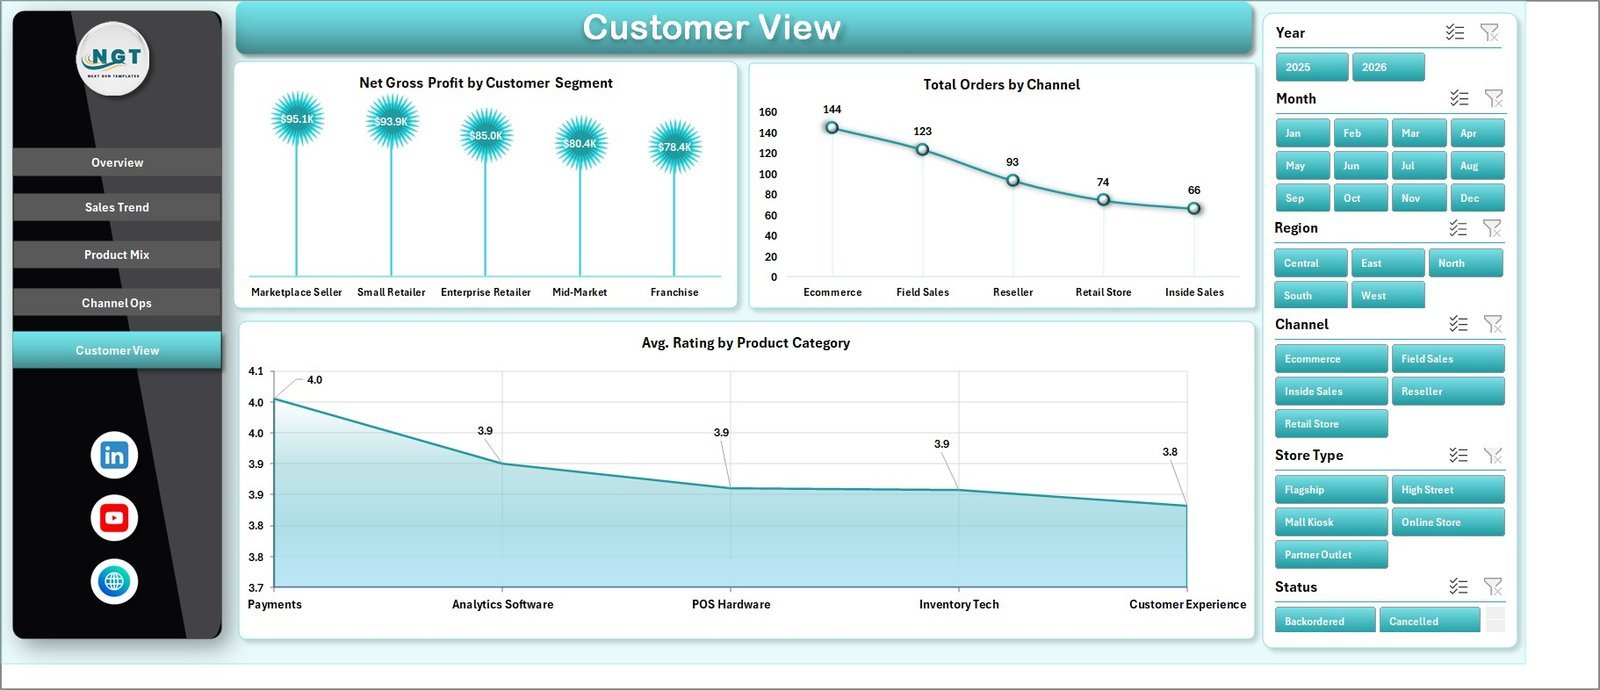
Customer View: This sheet shows Net Gross Profit by Customer Segment, Total Orders by Channel, and Avg. Rating by Product Category. It helps you understand which customer groups, channels, and categories are contributing to stronger performance and better customer experience.
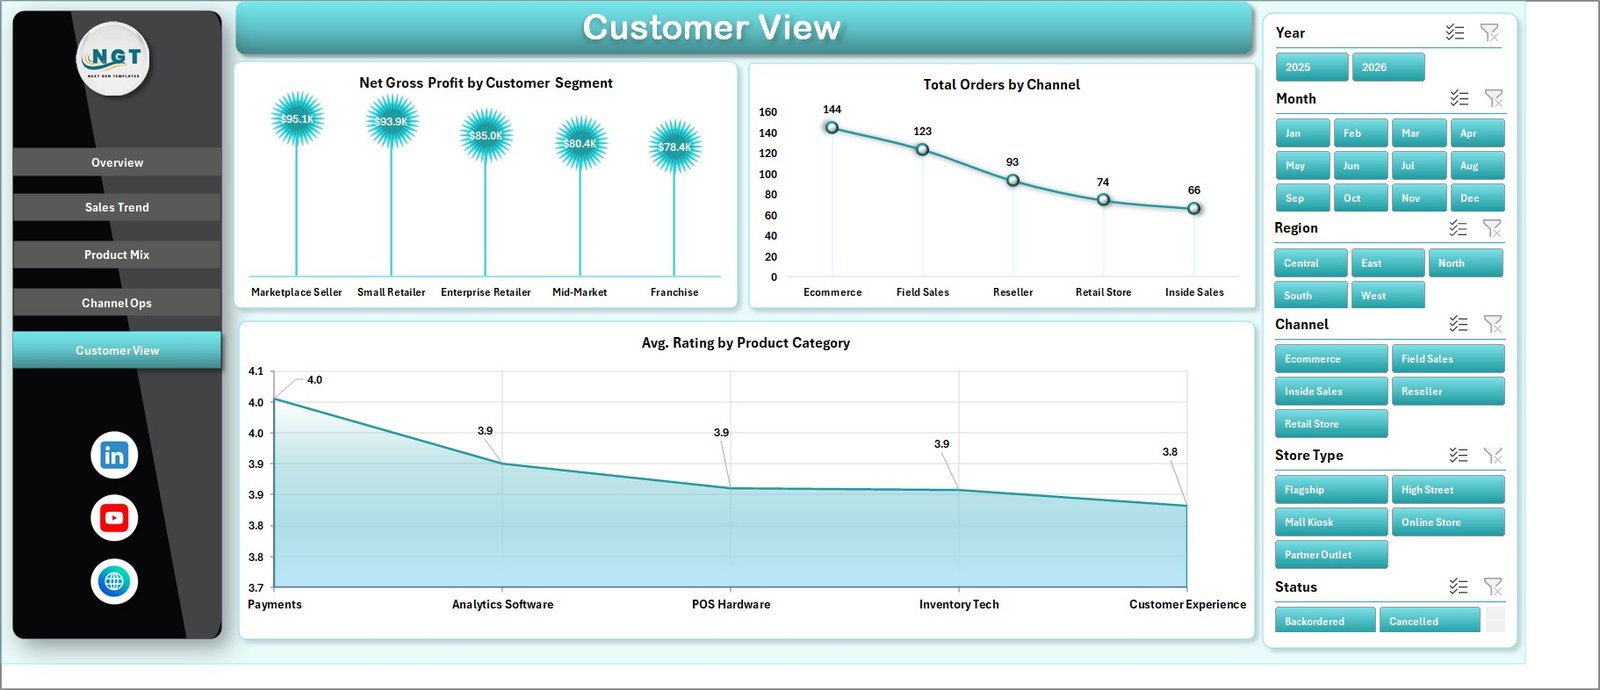
Customer View
Data Sheet Tab: The Data sheet stores the retail records used by the dashboard. Add or replace data in the same column format, then refresh the workbook to update pivots and charts.

Data Sheet tab
Support Sheet: The Support sheet contains the pivot tables used to power the dashboard. After updating the Data sheet, go to the Data tab in the Excel ribbon and click Refresh All. You can keep this sheet hidden during day-to-day use.

Support sheet tab
RetailTech Dashboard in Excel vs. Google Sheets vs. Paid CRM/SaaS – Where This Fits
| Criteria | RetailTech Dashboard in Excel | Google Sheets Alternative | Paid Retail SaaS Alternative |
|---|---|---|---|
| Cost | One-time template purchase | Usually free or workspace-based | Monthly subscription |
| Platform | Microsoft Excel desktop workbook | Browser-based spreadsheet | Cloud retail, CRM, POS, or BI platform |
| Setup time | Fast if your data can be pasted into the Data sheet | Fast for lightweight collaboration | Longer setup, mapping, permissions, and onboarding |
| Retail reporting flexibility | High for Excel users who want control | High for collaborative spreadsheet teams | Strong but tied to vendor workflow |
Who This Template Is For – and Who It’s Not For
This dashboard is for retail store owners, ecommerce managers, franchise teams, merchandising analysts, operations leaders, and Excel users who want fast reporting without building charts, slicers, and pivots from zero. It fits teams that export data from POS, Shopify, WooCommerce, ERP, CRM, or support systems and want a structured Excel report.
It is not the best fit if you need live database connections, automated API sync, role-based workflow approvals, mobile-first field operations, or enterprise governance features. In those cases, a dedicated retail BI or CRM platform may be more suitable.
How to Use the RetailTech Dashboard in Excel
- Download and unzip the RetailTech Dashboard file.
- Open the workbook in Microsoft Excel.
- Go to the Data sheet and review the sample column format.
- Replace the sample rows with your retail data in the same format.
- Go to the Excel Data ribbon and click Refresh All.
- Use the slicers and dashboard pages to review revenue, costs, orders, margin, product mix, channels, customers, and support tickets.
Real-World Use Cases
Retail Owner Priya: Priya runs three stores and wants a weekly view of revenue, cost, and order status. She uses the Overview and Channel Ops pages to understand where sales are growing and where support requests are increasing.
Ecommerce Manager Daniel: Daniel exports order and payment data every month. He uses the Sales Trend page to compare revenue by year, profit by quarter, and sales by payment method.
Merchandising Analyst Sofia: Sofia reviews product category performance and regional margins before planning the next promotion cycle. She uses the Product Mix page to identify categories with strong revenue but weaker profitability.
Frequently Asked Questions
Is this RetailTech Dashboard in Excel ready to use?
Yes. The workbook includes sample data, dashboard pages, charts, slicers, pivot tables, a data sheet, and a support sheet. Replace the sample data with your own records and refresh the workbook.
Do I need Power BI or any paid software?
No. This product is an Excel dashboard. You only need Microsoft Excel to use and customize the workbook.
Can I add my own retail data?
Yes. Add your records in the Data sheet using the same column structure. After updating the data, click Refresh All from the Excel Data ribbon.
Can I hide the Support sheet?
Yes. The Support sheet contains pivot tables used by the dashboard. You can keep it hidden once the workbook is set up.
Can I customize the charts?
Yes. Since the file is built in Excel, you can edit chart formatting, slicers, formulas, and pivot table layouts as needed.
Is this suitable for ecommerce stores?
Yes. It can be used for ecommerce, retail stores, omnichannel operations, product categories, payment methods, customer segments, and support ticket analysis.
About the Author
Built by PK – Microsoft Certified Professional with 15+ years of Excel, Google Sheets, and Power BI experience. Founder of NextGenTemplates, reaching 300K+ subscribers across YouTube channels. Every template is hand-built and tested before release.
Explore Related Templates
Explore more Excel templates in the MS Excel category and the Excel Dashboard category. You can also browse related dashboard templates on NextGenTemplates for operations, sales, inventory, finance, and customer service reporting.
Download the RetailTech Dashboard in Excel today and turn your retail data into clear, filterable Excel reports without starting from a blank workbook.
Last updated: August 4, 2026






























Reviews
There are no reviews yet.