


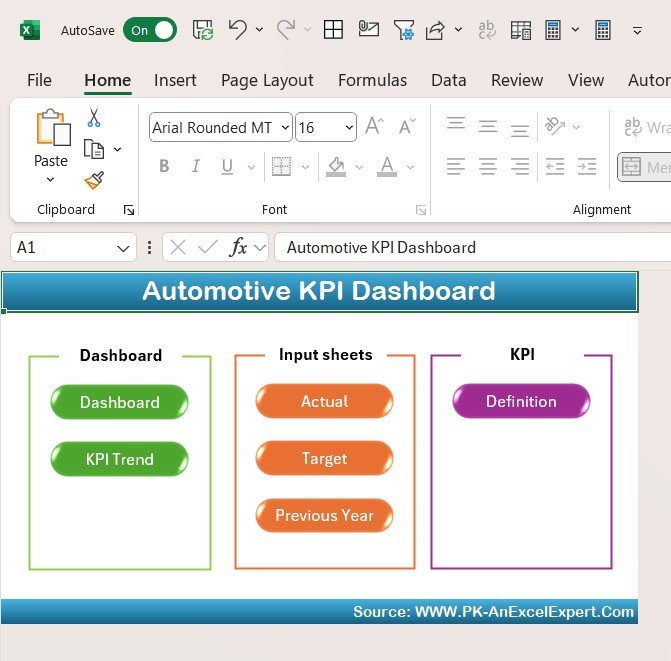



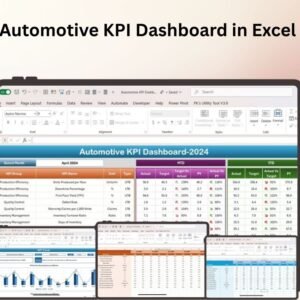
The Automotive KPI Dashboard in Excel is a comprehensive and customizable tool designed to help automotive businesses track and analyze key performance indicators (KPIs) that drive success. Whether you manage a car dealership, repair shop, or automotive service center, this dashboard provides a clear, real-time view of key metrics such as sales performance, service efficiency, inventory turnover, and customer satisfaction.
This Excel-based dashboard helps automotive professionals optimize their operations by tracking vital KPIs that impact overall business performance. With visually intuitive charts and data analysis, this tool enables managers and business owners to make data-driven decisions to enhance performance, improve customer service, and boost profitability.

Key Features of the Automotive KPI Dashboard in Excel:
📊 Comprehensive KPI Tracking
Monitor a variety of automotive KPIs, including vehicle sales, service revenue, inventory turnover, customer satisfaction, and more—all in one place.
📈 Real-Time Performance Monitoring
Track your automotive business’s performance in real-time, providing up-to-date data on sales, service efficiency, and customer satisfaction.
📅 Month-to-Date (MTD) and Year-to-Date (YTD) Tracking
Analyze performance over time with monthly and yearly comparisons, helping you spot trends and adjust strategies as needed.
🎯 Goal Setting and Performance Comparison
Set specific targets for each KPI and compare them with actual performance. This ensures that your business stays on track to meet its goals and objectives.
🛠 Customizable Inputs
Easily input your own data and adjust KPIs to fit your automotive business’s unique needs. Track metrics like car sales, parts inventory, or service appointments with ease.
🔔 Conditional Formatting Alerts
Get real-time visual alerts for key metrics, making it easy to spot underperforming areas such as low sales, service delays, or high inventory levels.
🚗 Sales and Service Insights
Gain insights into your vehicle sales, service performance, and inventory management with dynamic graphs and charts that highlight key trends.
🚀 Why You’ll Love the Automotive KPI Dashboard in Excel:
✅ Track Sales & Service Performance – Consolidate all your sales, service, and inventory data in one dashboard for easy tracking and analysis.
✅ Improve Decision-Making – Use real-time data to make informed decisions about sales strategies, service improvements, and inventory management.
✅ Optimize Inventory Management – Monitor stock levels and identify slow-moving vehicles or parts that need to be addressed.
✅ Increase Customer Satisfaction – Track customer feedback and service performance to ensure a positive customer experience.
✅ User-Friendly Interface – This easy-to-use dashboard is designed for non-technical users, making it simple for anyone in the automotive industry to use.
What’s Inside the Automotive KPI Dashboard in Excel:
- Vehicle Sales KPI: Track the number of vehicles sold, total sales revenue, and sales per product category.
- Service Revenue KPI: Measure the income generated from automotive services like repairs, maintenance, and customizations.
- Inventory Turnover KPI: Monitor the rate at which parts or vehicles are sold or replaced, helping you optimize stock levels.
- Customer Satisfaction KPI: Track customer feedback and satisfaction scores to improve service quality and retention.
- Service Efficiency KPI: Measure how efficiently your service department operates, including the time it takes to complete repairs or service tasks.
- Parts and Supplies KPI: Monitor parts usage, inventory levels, and reorder points to avoid stock-outs or overstocking.
How to Use the Automotive KPI Dashboard in Excel:
1️⃣ Download the Template – Get immediate access to your Excel file upon purchase.
2️⃣ Input Your Data – Enter your automotive business data, such as vehicle sales, service performance, and customer satisfaction.
3️⃣ Set Targets – Define KPI targets for vehicle sales, service revenue, inventory turnover, and more.
4️⃣ Track Performance – Monitor the performance in real time and adjust strategies as necessary.
5️⃣ Generate Reports – Use the dashboard to create performance reports for management or client presentations.
Who Can Benefit from the Automotive KPI Dashboard in Excel:
- Car Dealerships
- Auto Repair Shops
- Automotive Service Centers
- Sales Managers
- Service Managers
- Business Owners
- Fleet Managers
- Automotive Inventory Managers
This Automotive KPI Dashboard in Excel is the ultimate solution for tracking, analyzing, and optimizing the performance of your automotive business. Drive better results with real-time insights, improved decision-making, and enhanced customer satisfaction.
Click here to read the Detailed blog post
https://www.pk-anexcelexpert.com/automotive-kpi-dashboard-in-excel/
Visit our YouTube channel to learn step-by-step video tutorials
Youtube.com/@PKAnExcelExpert
Compatibility and Requirements
- Works in Microsoft Excel desktop (Excel 2016 or later, or Microsoft 365).
- Charts are standard Excel charts. Microsoft explains them in Create a chart from start to finish.
Frequently Asked Questions
Which KPIs are included?
Vehicle sales, service revenue, inventory turnover, customer satisfaction, service efficiency, and parts and supplies.
Does it show MTD and YTD figures?
Yes. You can compare month to date and year to date performance against the targets you set.
How are weak areas flagged?
Conditional formatting highlights metrics such as low sales, service delays or high inventory levels.
Can I add my own KPIs?
Yes. You can enter your own data and adjust the KPIs to fit your dealership or service center.
Who is it for?
Car dealerships, auto repair shops, service centers, sales and service managers, fleet managers and inventory managers.
Related Automotive Templates
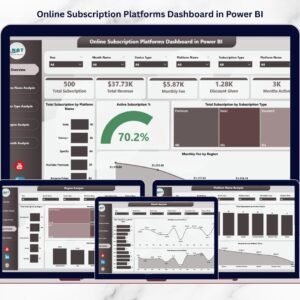
- Automotive KPI Dashboard in Power BI: the same KPIs in Power BI
- Automotive KPI Dashboard in Google Sheets: the same KPIs in Google Sheets
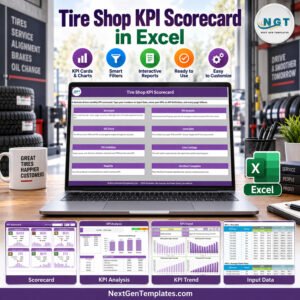
- Automotive KPI Scorecard in Excel: a scorecard view of automotive KPIs
- Car Dealership Dashboard in Excel: focus on dealership sales
- Auto Repair Dashboard in Excel: focus on repair shop work
Browse all Excel KPI Dashboards.





























Reviews
There are no reviews yet.