

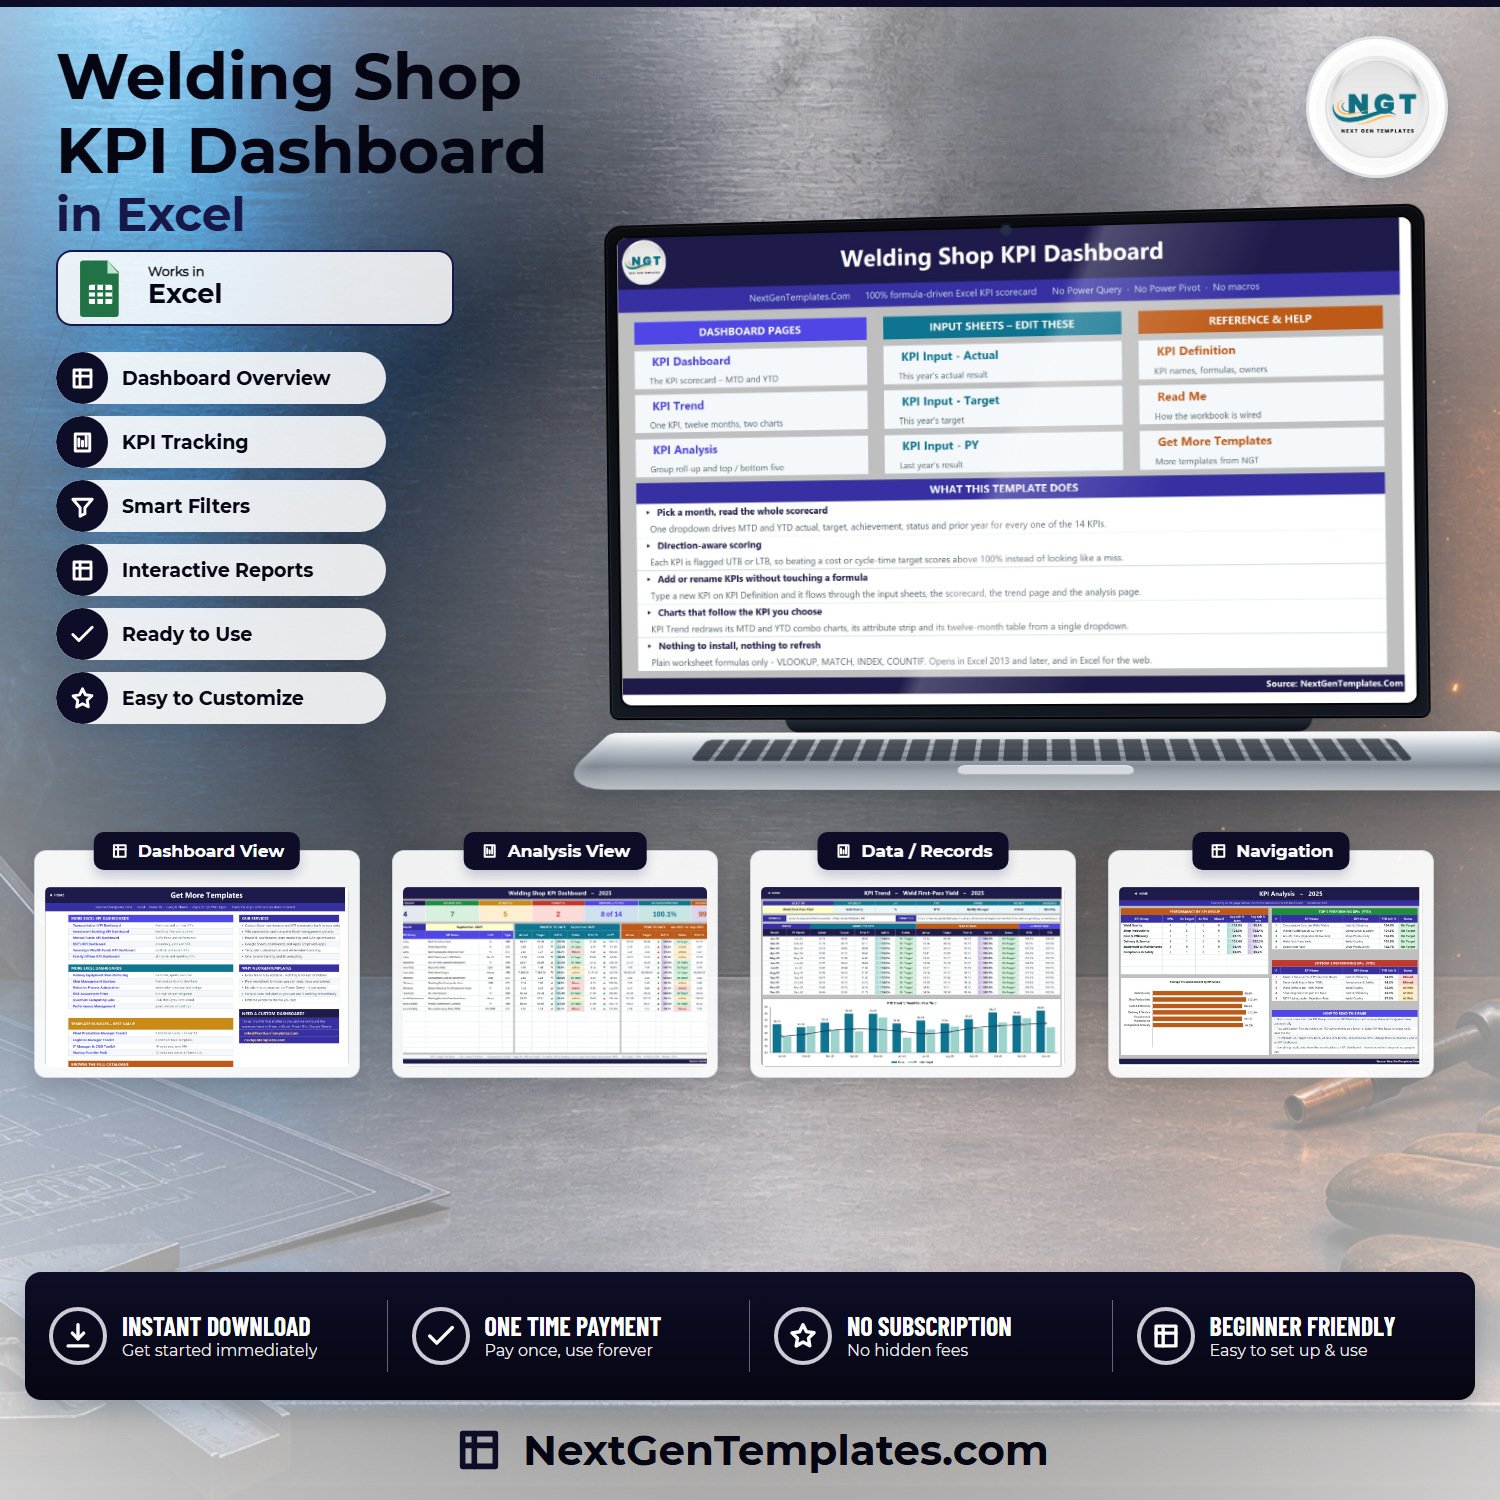

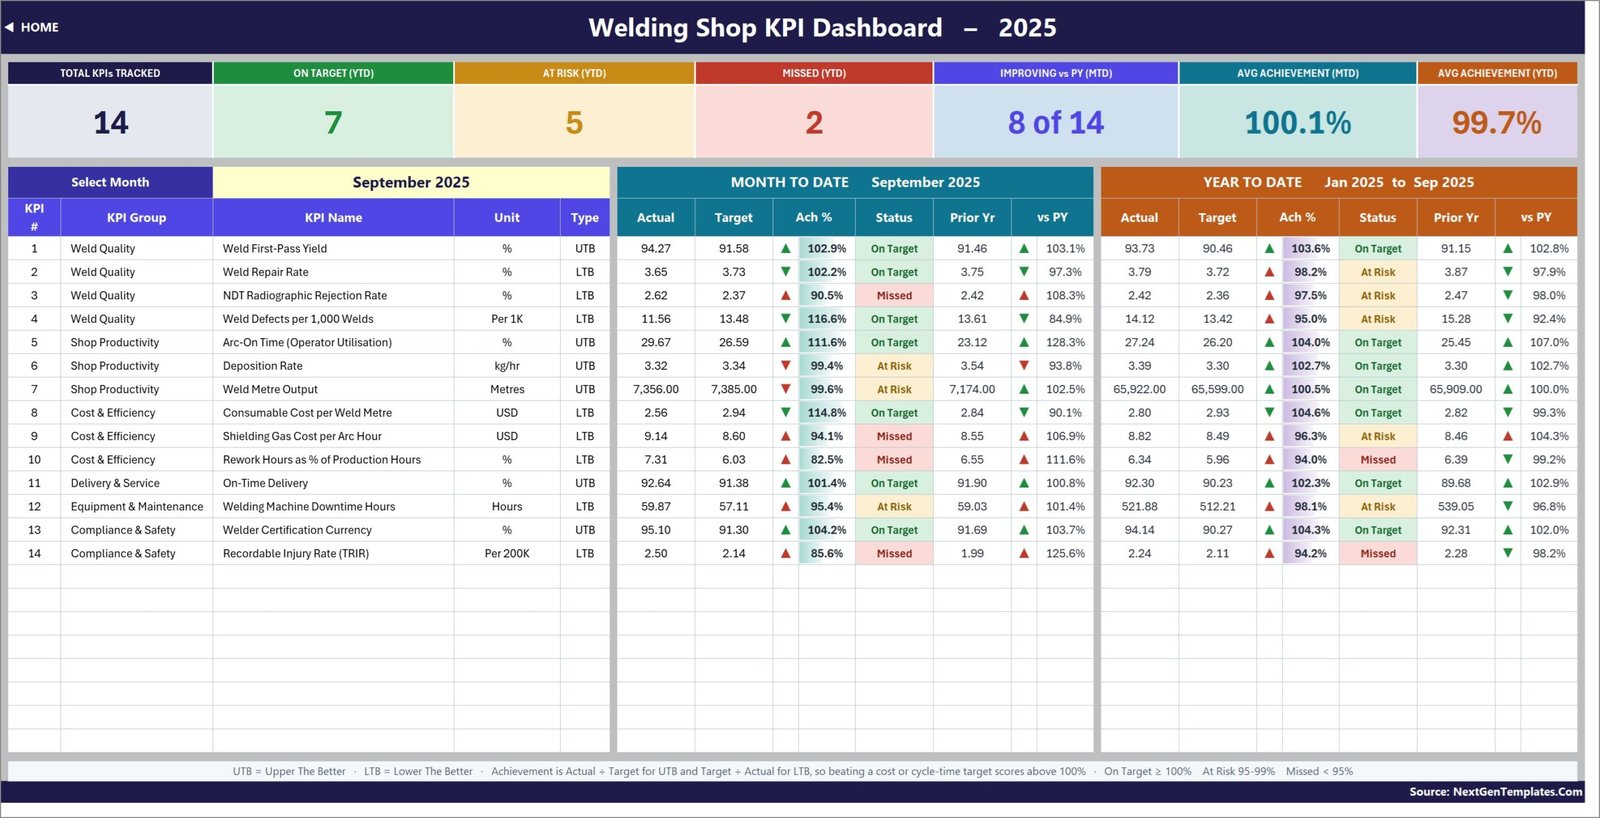
The Welding Shop KPI Dashboard in Excel is a month-picker KPI scorecard for a fabrication and welding shop: 14 named welding KPIs in 6 groups, each carrying MTD and YTD actual, target, achievement percentage, a traffic-light status and a prior-year comparison on a single row. It ships as one .xlsx workbook of 11 sheets with a full sample year (2025) already filled in and a user manual PDF in the download. Every number is a plain worksheet formula – VLOOKUP, MATCH, INDEX, COUNTIF – so there is no Power Query, no data model, no macro and no add-in. It opens in Excel 2013 and later and in Excel for the web. Instant download, lifetime access to the file, and one-time payment with no subscription.
Key Features of the Welding Shop KPI Dashboard in Excel
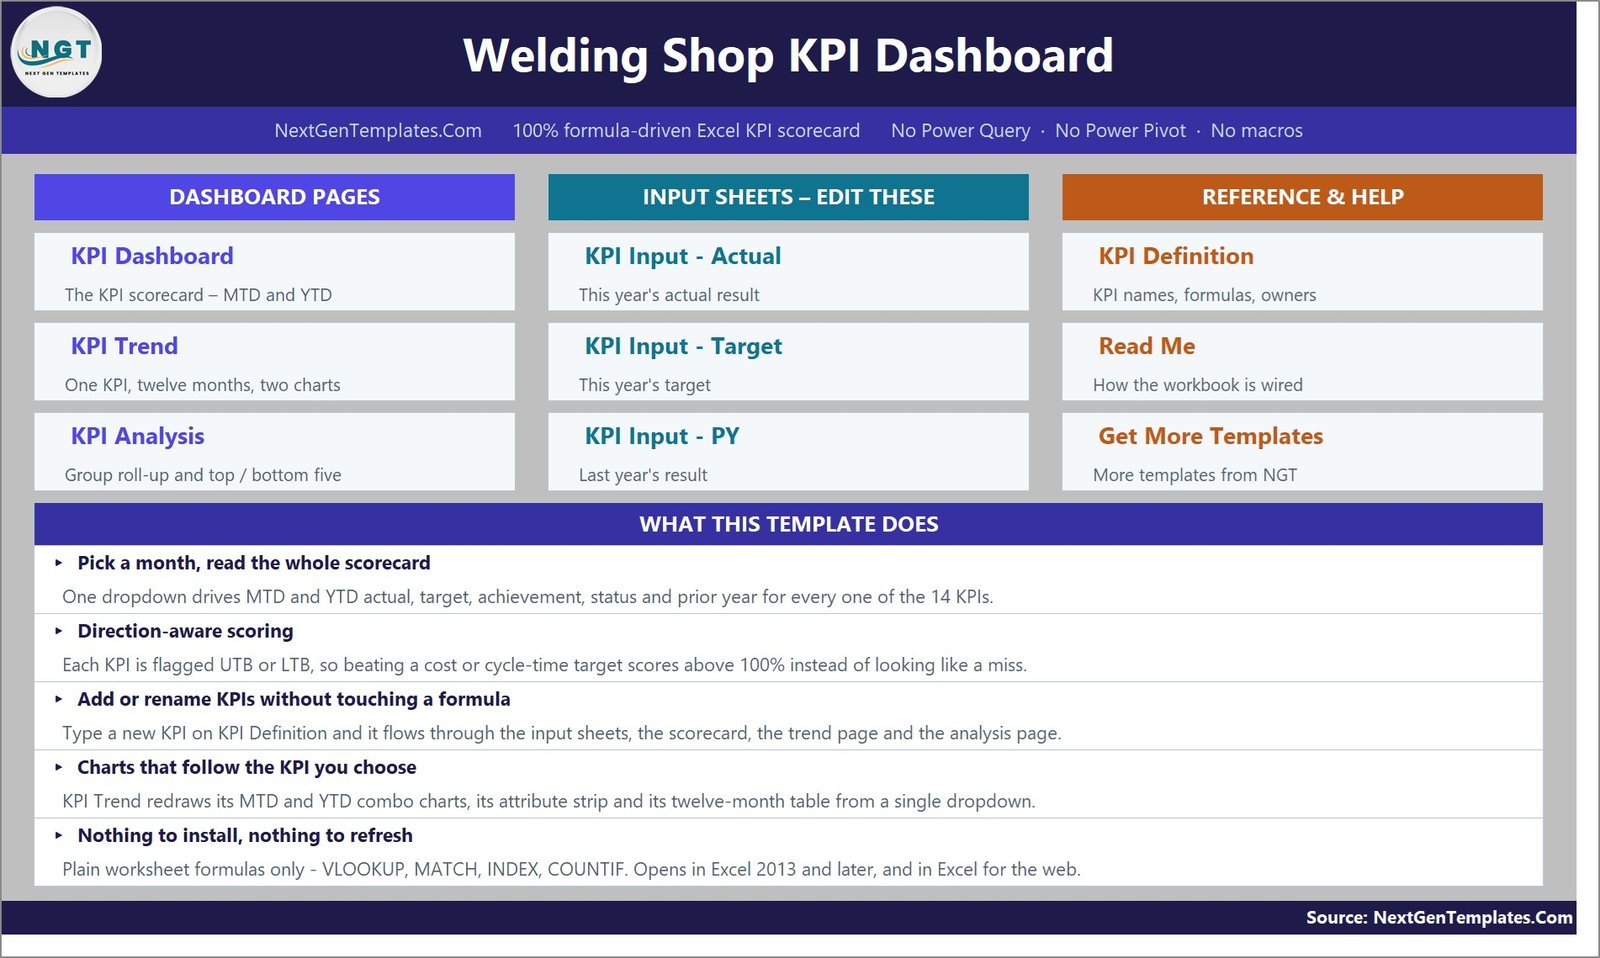
- One month dropdown drives everything. Cell D6 on KPI Dashboard lists the twelve months of the reporting year. The 14 KPI rows, the seven summary cards and the whole KPI Analysis page follow it. There is no refresh step.
- Direction-aware scoring. Each KPI is tagged UTB (upper the better) or LTB (lower the better) in column G of KPI Definition. Achievement is Actual divided by Target for a UTB KPI and Target divided by Actual for an LTB KPI, so beating a repair-rate or gas-cost target scores above 100 percent instead of reading as a miss.
- Traffic lights you can edit. On Target from 100 percent, At Risk from 95 to 99 percent, Missed below 95 percent. The thresholds sit in the formulas in columns L and U on KPI Dashboard – change them to match your own governance.
- Seven summary cards across the top: Total KPIs Tracked, On Target (YTD), At Risk (YTD), Missed (YTD), Improving vs PY (MTD), Avg Achievement (MTD) and Avg Achievement (YTD). In the shipped sample year they read 14, 7, 5, 2, 8 of 14, 100.1 percent and 99.7 percent for September 2025.
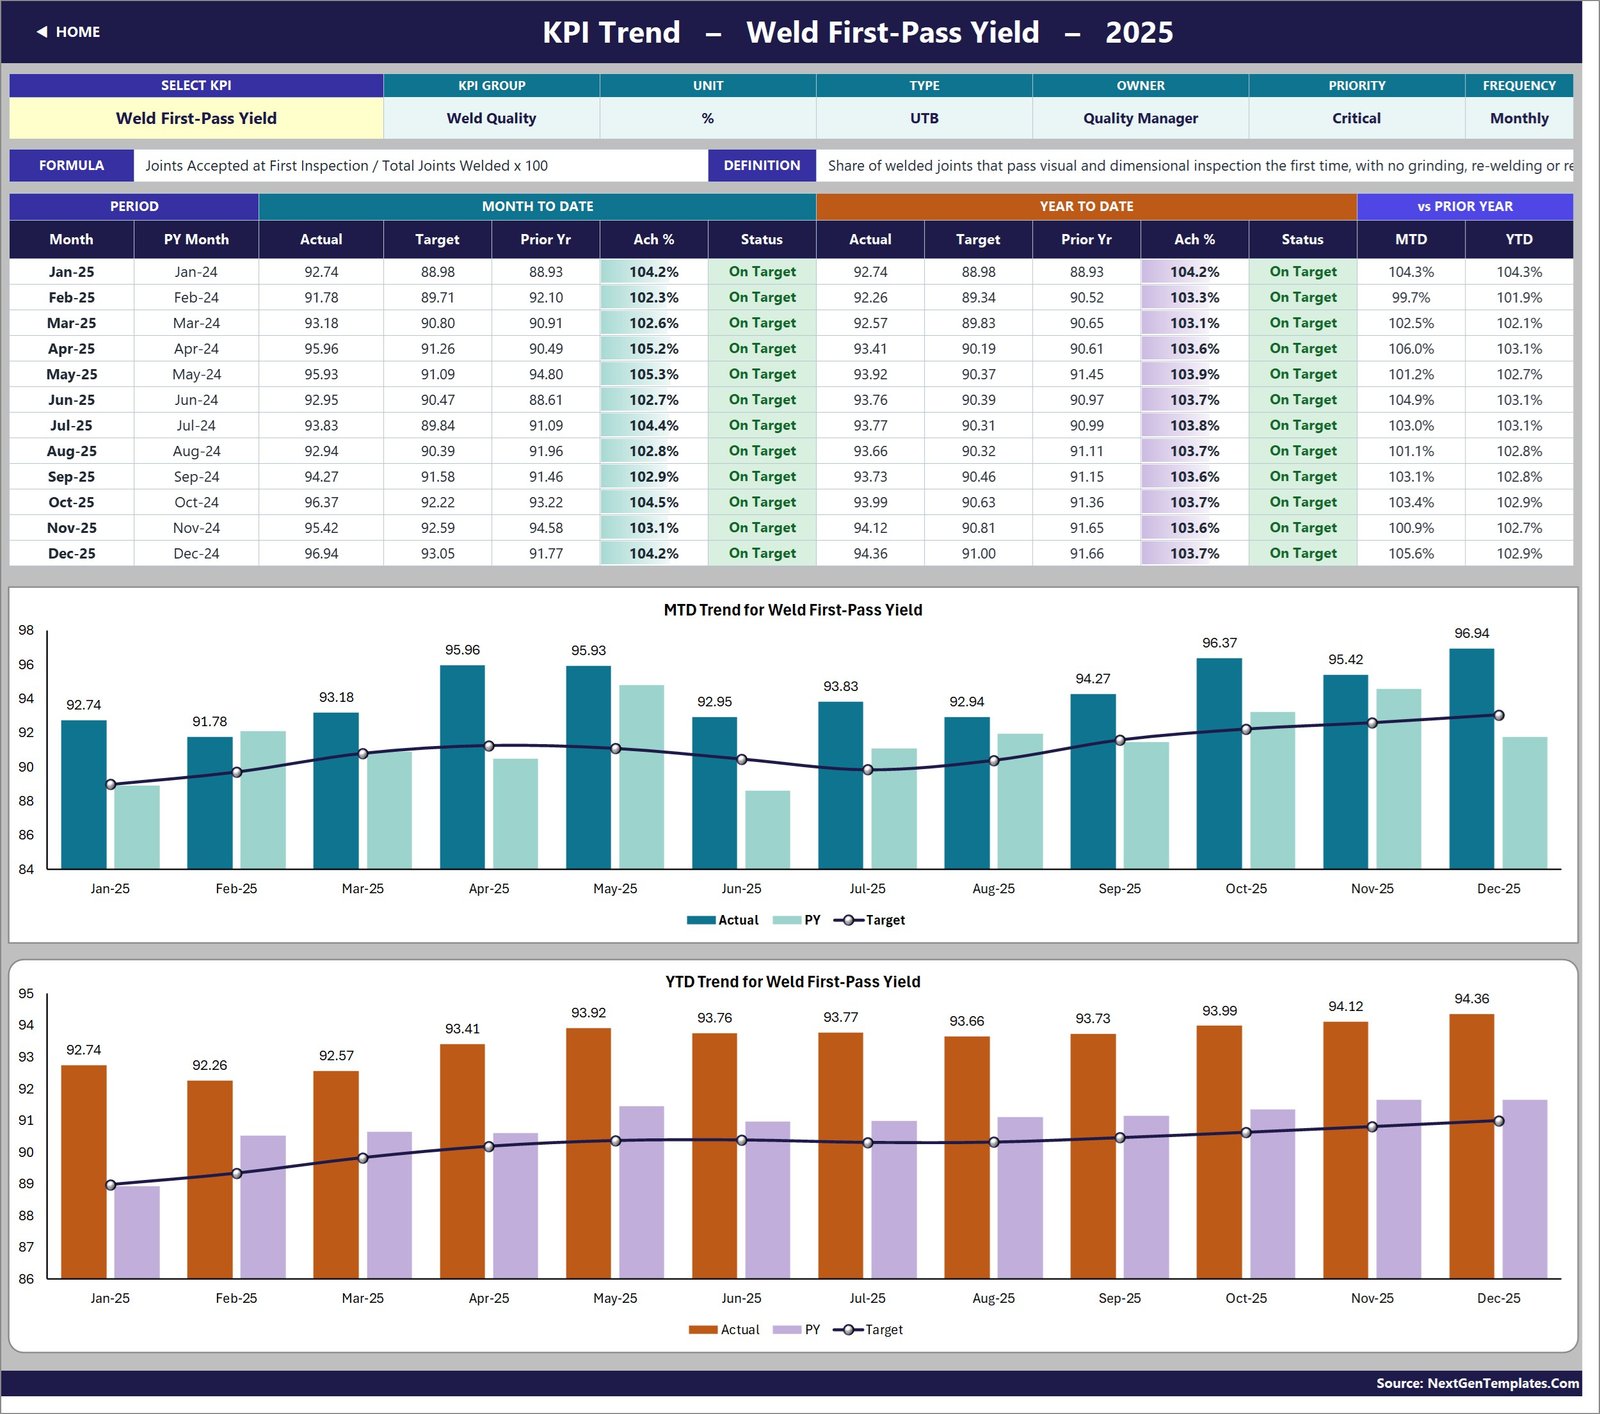
- A KPI Trend page that redraws for any KPI you pick from a dropdown – the attribute strip (group, unit, type, owner, priority, frequency), the formula and definition text, a twelve-month table, and MTD and YTD combo charts with actual and prior-year columns against a target line.
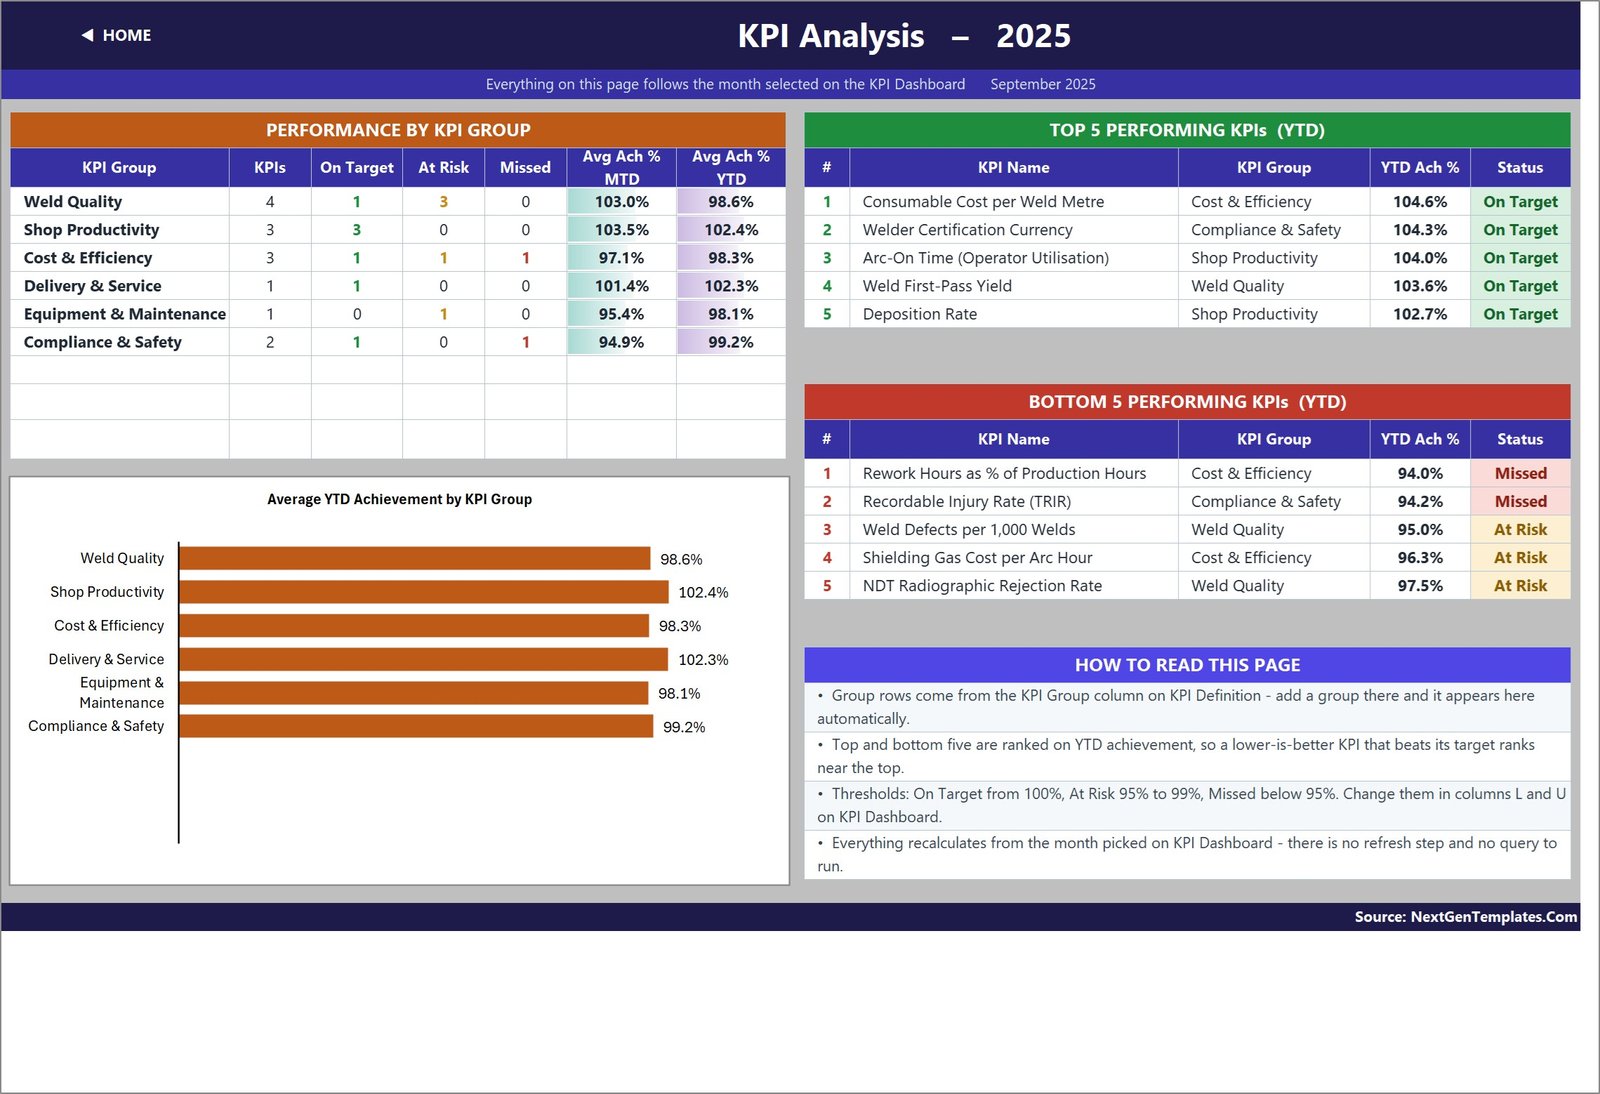
- A KPI Analysis page with achievement rolled up by KPI group, a bar chart of average YTD achievement per group, and ranked Top 5 and Bottom 5 performers for the year to date.
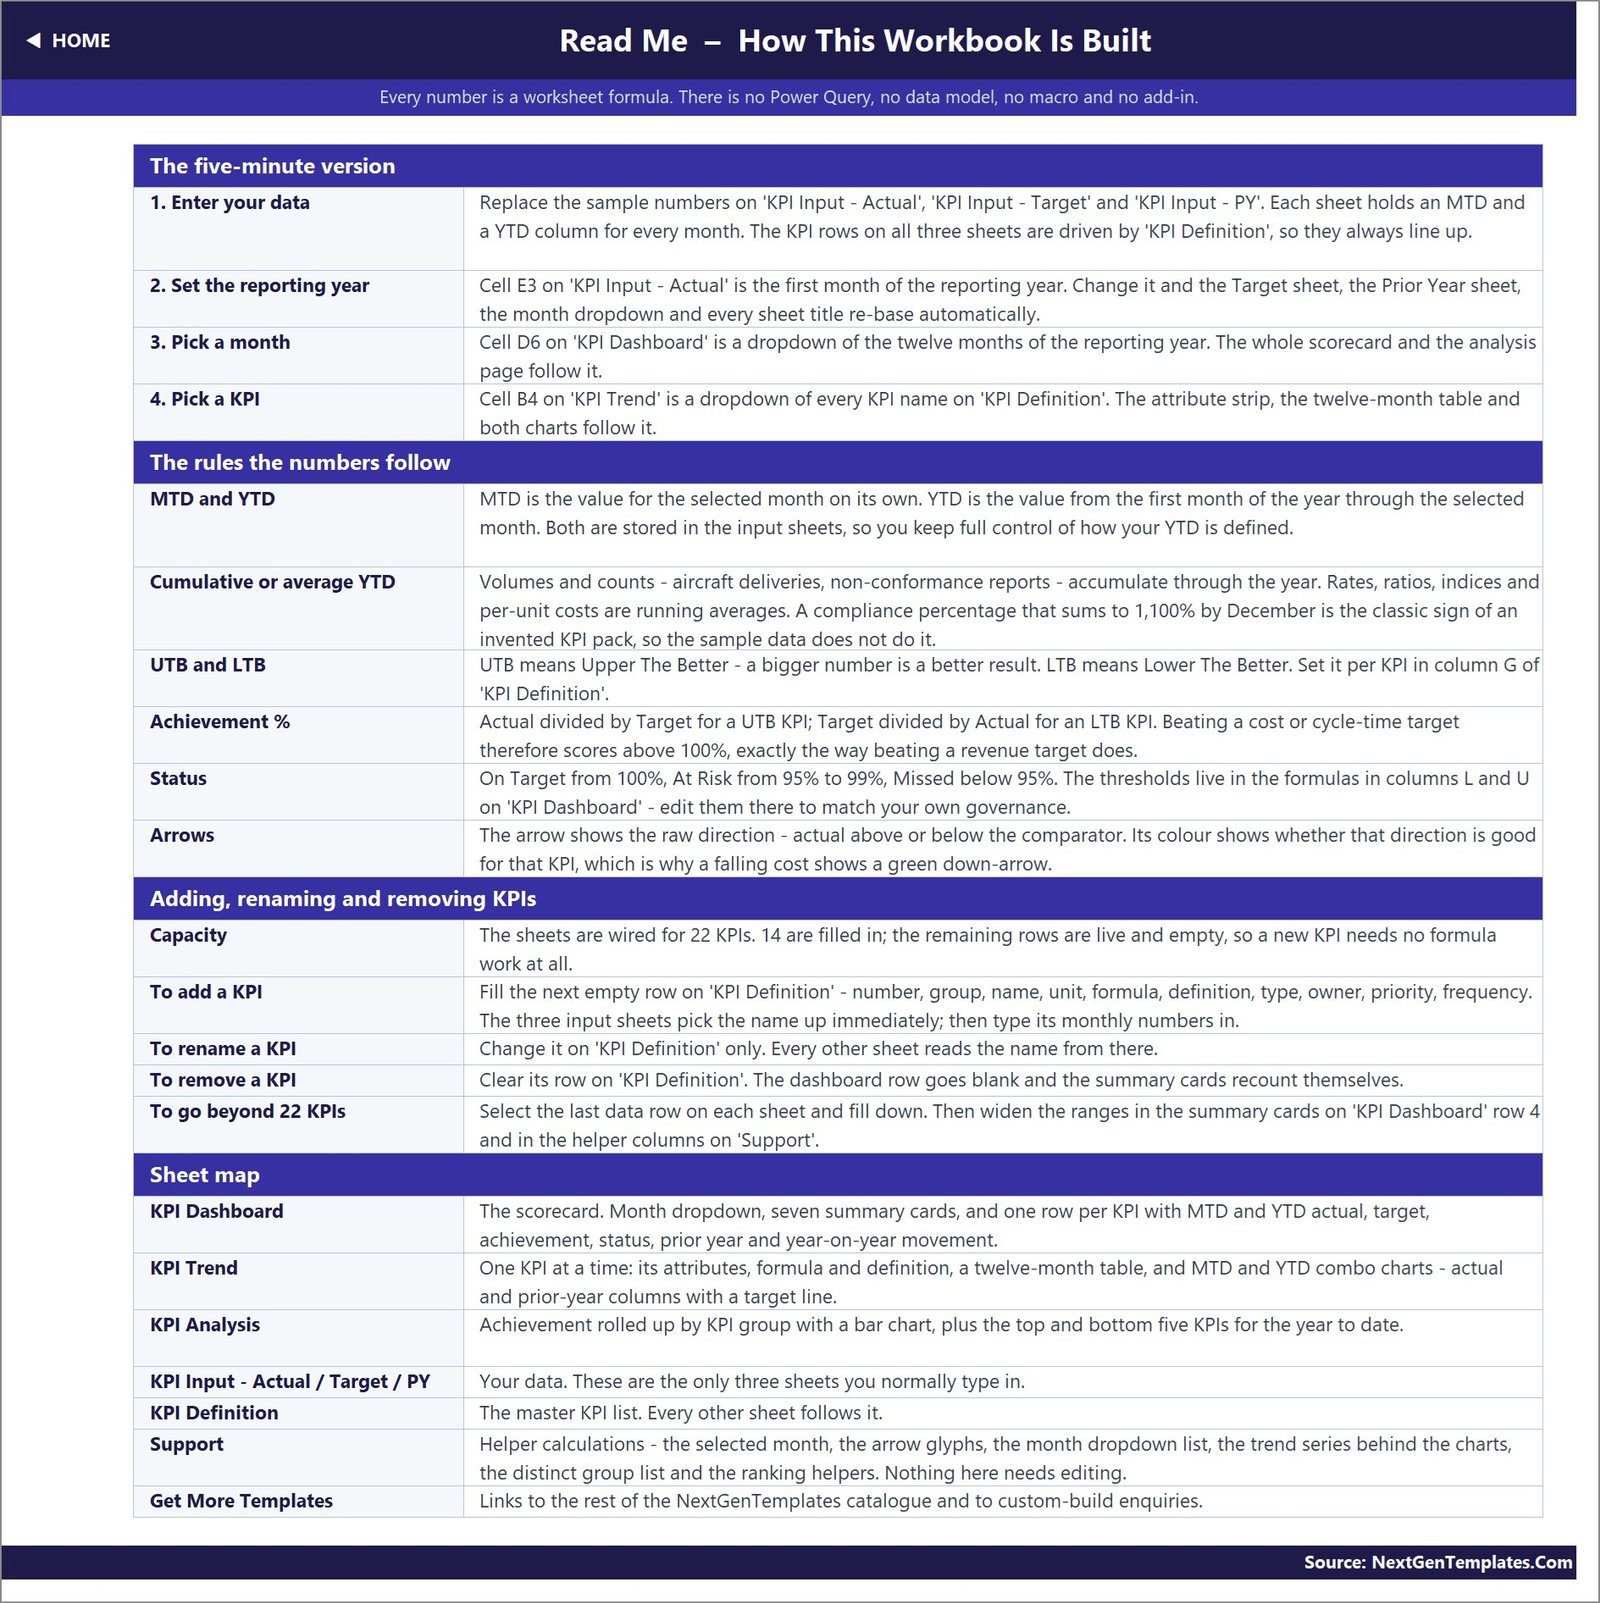
- Add or rename KPIs with no formula work. KPI Definition is the master list; the three input sheets, the scorecard, the trend page and the analysis page all read names from it. The sheets are wired for 22 KPI rows and 14 are filled, so eight more need nothing but typing.
- Owner, priority and frequency per KPI – Quality Manager, Welding Supervisor, NDT Level III Inspector, Quality Engineer, Production Manager, Welding Engineer, Purchasing Lead, Scheduling Lead, Maintenance Lead, QA/QC Coordinator and EHS Manager are all pre-assigned in the sample.
What’s Inside the Welding Shop KPI Dashboard in Excel
Eleven sheets: Home (navigation), KPI Dashboard (the scorecard), KPI Trend, KPI Analysis, KPI Input – Actual, KPI Input – Target, KPI Input – PY, KPI Definition, a hidden Support helper sheet, Read Me and Get More Templates.
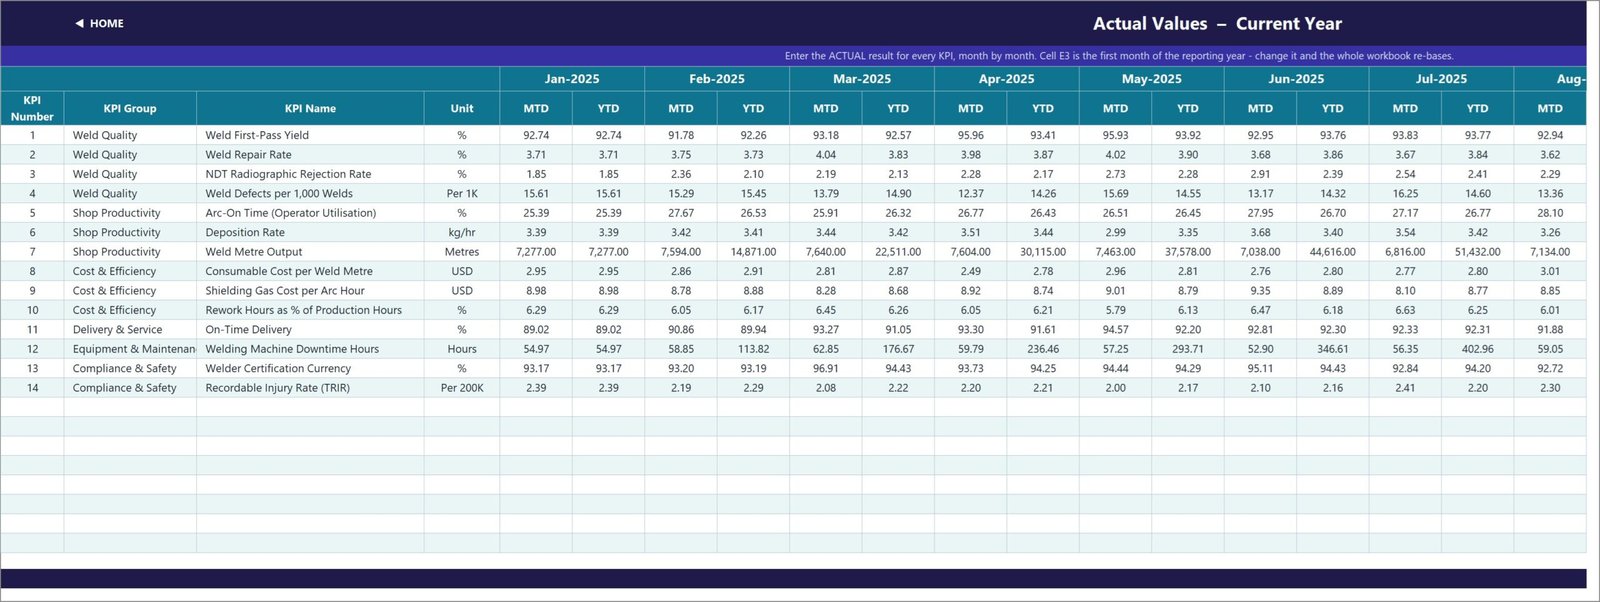
The 14 KPIs, exactly as they ship:
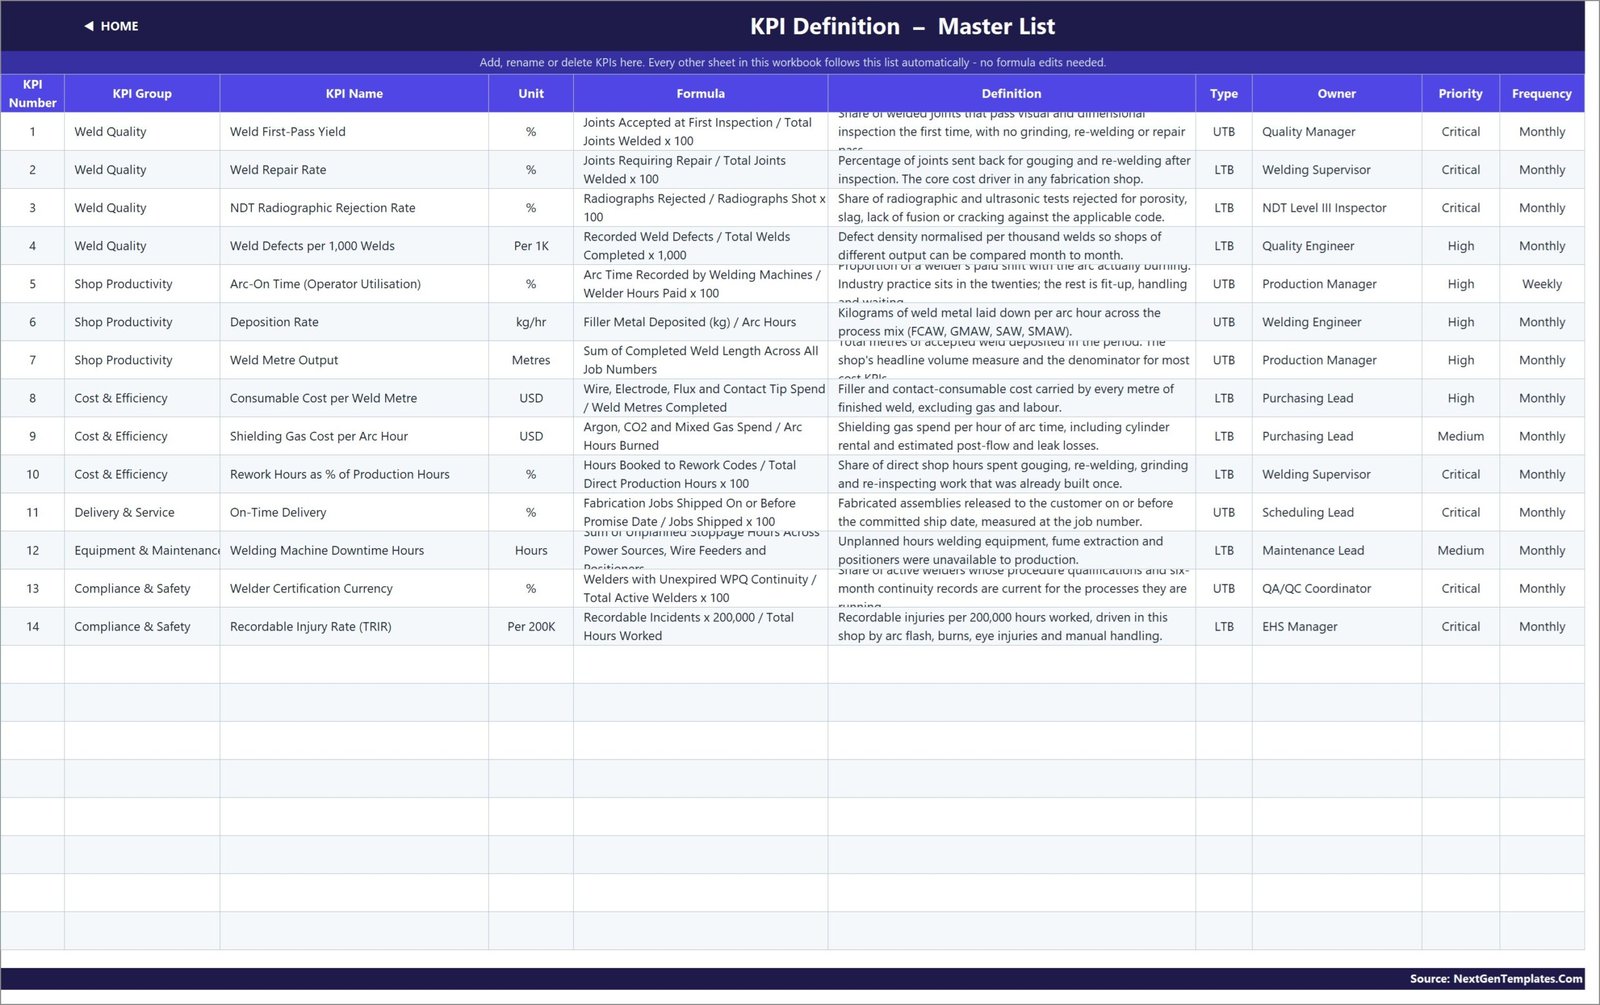
- Weld Quality (4): Weld First-Pass Yield (%, UTB), Weld Repair Rate (%, LTB), NDT Radiographic Rejection Rate (%, LTB), Weld Defects per 1,000 Welds (Per 1K, LTB).
- Shop Productivity (3): Arc-On Time / Operator Utilisation (%, UTB), Deposition Rate (kg/hr, UTB), Weld Metre Output (Metres, UTB).
- Cost & Efficiency (3): Consumable Cost per Weld Metre (USD, LTB), Shielding Gas Cost per Arc Hour (USD, LTB), Rework Hours as % of Production Hours (%, LTB).
- Delivery & Service (1): On-Time Delivery (%, UTB).
- Equipment & Maintenance (1): Welding Machine Downtime Hours (Hours, LTB).
- Compliance & Safety (2): Welder Certification Currency (%, UTB), Recordable Injury Rate / TRIR (Per 200K, LTB).
Every KPI carries its own calculation text on KPI Definition – for example “Arc Time Recorded by Welding Machines / Welder Hours Paid x 100” and “Recordable Incidents x 200,000 / Total Hours Worked” – so the person typing the numbers knows what the number is supposed to be.
Excel vs. Google Sheets vs. Paid Manufacturing Analytics – Where This Fits
| This Excel dashboard | Google Sheets KPI scorecard | Paid MES / analytics suite | |
|---|---|---|---|
| Cost | 19.99 one time (12.99 on sale) | Similar one-time template price | Typically 40-150 per user per month |
| Platform | Excel 2013+ and Excel for the web | Browser, Google account required | Vendor cloud, sometimes an on-premise agent |
| Setup time | Under an hour – type over the sample year | Under an hour | Weeks: shop-floor data collection, mapping, training |
| Real-time team collaboration | Only through OneDrive or SharePoint co-authoring | Yes, native | Yes |
| Mobile access | Excel mobile app, read-first | Yes, browser and app | Yes, usually a dedicated app |
| Customizable KPI names and units | Yes – one master list, no formula edits | Yes | Usually configurable, often billable |
| Share with link | Via OneDrive or SharePoint | Yes, native | Yes |
| Year-1 cost at 5 users | 19.99 total | Roughly the same | 2,400 – 9,000 |
| UTB / LTB direction-aware scoring | Built in per KPI | Built in per KPI | Usually configurable |
| Reads welding machine or NDT data automatically | No – figures are typed in monthly | No | Yes, that is what you are paying for |
Who This Template Is For – and Who It’s Not For
It fits a fabrication or structural steel shop that already produces monthly numbers – from an ERP, a job-costing package, an NDT log and a timesheet system – and needs one page that turns them into a governed scorecard for a management review. It fits a welding supervisor or QA/QC coordinator who has to defend repair rate and rework hours in front of a production manager, and a shop that wants MTD and YTD side by side without building the reporting layer twice.
It does not fit a shop that wants figures pulled automatically from welding power sources, an MES or an NDT database – this workbook is typed, by design. It is not a job-level or weld-level tracker: there is one row per KPI per month, not one row per joint. And it is not a safety, quality or compliance management system. Welder Certification Currency and TRIR are management reporting metrics here; the workbook records what you type and makes no AWS, ASME, ISO or OSHA compliance claim, and it is not a system of record for WPS, WPQ or continuity documentation.
How to Use the Welding Shop KPI Dashboard in Excel
- Unzip the download and open the .xlsx in Excel. The user manual PDF is in the same zip.
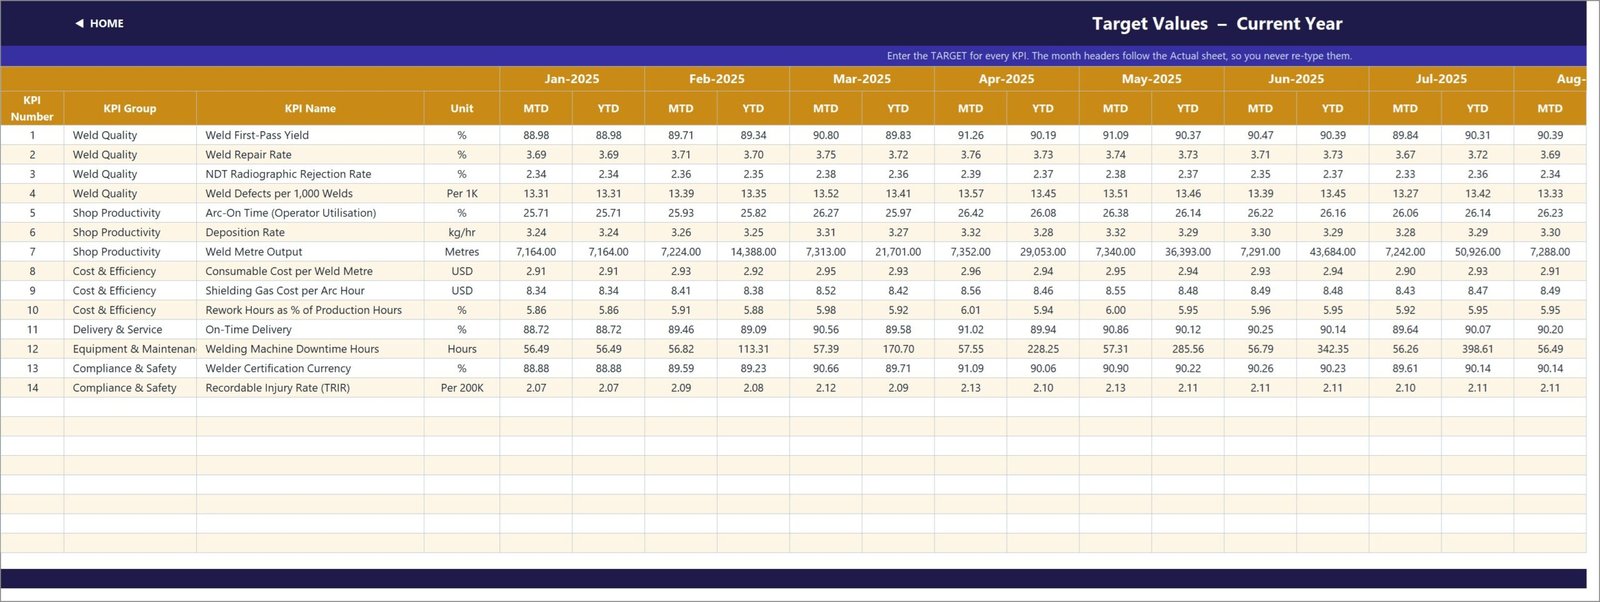
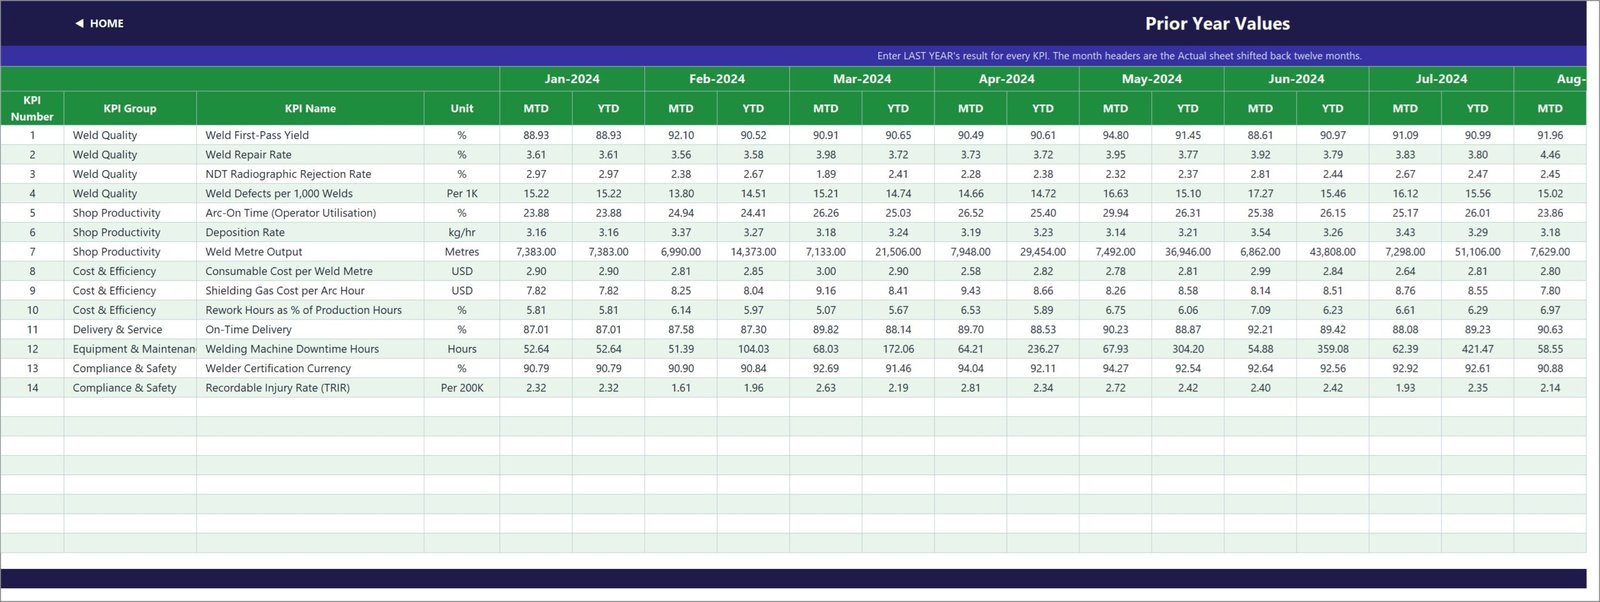
- Set your reporting year: cell E3 on ‘KPI Input – Actual’ is the first month. Change it and the Target sheet, the Prior Year sheet, the month dropdown and every sheet title re-base automatically.
- Edit the KPI list on ‘KPI Definition’ – rename, delete, or add rows for your own metrics with their group, unit, formula, definition, UTB/LTB type, owner, priority and frequency.
- Type your figures over the sample year on the three input sheets – Actual, Target and PY. Each holds an MTD and a YTD column for every month.
- Pick a month in cell D6 on ‘KPI Dashboard’ and read the scorecard. Pick a KPI in cell B4 on ‘KPI Trend’ to see its twelve months and both charts.
- If your review uses different bands, edit the On Target / At Risk / Missed thresholds in the formulas in columns L and U on ‘KPI Dashboard’.
Real-World Use Cases
Rakesh, QA/QC Coordinator at a 40-welder structural steel shop. His monthly quality meeting used to be three printouts. He now types first-pass yield, repair rate, NDT rejection rate and defects per 1,000 welds into the Actual sheet, picks the month, and walks in with one page showing which of the four Weld Quality KPIs are green and how each moved against last year.
Meera, Production Manager at a pipe-spool fabricator. She tracks Arc-On Time, deposition rate and weld metre output. Because Arc-On Time is a UTB KPI and consumable cost is LTB, both score above 100 percent when the shop does well, so her one-page summary needs no explanation of why a falling number is good news.
Daniel, Owner-Operator of a 9-person job shop. He does not have an MES and does not want one. Once a month he types fourteen numbers, sets the month, and the Top 5 / Bottom 5 panel on KPI Analysis tells him where to spend the next four weeks.
Frequently Asked Questions
Is this the KPI scorecard style dashboard, or the analytical Excel dashboard?
This is the KPI dashboard (scorecard) line: a month picker, traffic lights, a KPI Trend page and a KPI Analysis page, built on typed monthly figures. It is not the analytical Excel dashboard line, which is pivot-and-slicer driven off a transaction table. Both exist on this site under similar names – check the page images before you buy.
How is it different from the Welding Shop KPI Scorecard in Excel?
They are different builds from different template families with a different KPI set and a different page layout. The Welding Shop KPI Scorecard in Excel is the lighter scorecard product; this one adds the dedicated KPI Trend and KPI Analysis pages and the seven-card summary strip. Owning one does not make the other redundant, but most buyers need only one.
Do I need macros, Power Query or a data model?
No. Every value is a plain worksheet formula. There is no VBA, no query, no Power Pivot model and no add-in, which is why the file also works in Excel for the web.
Does the workbook calculate YTD from my monthly numbers?
No – and this is deliberate. Both MTD and YTD are typed by you on all three input sheets, so you keep full control of how YTD is defined. In the sample, rates and per-unit costs run as averages and volumes such as weld metres and downtime hours accumulate.
Can I add more than 14 KPIs?
Yes. The sheets are wired for 22 KPI rows, so eight more need nothing but typing on ‘KPI Definition’. To go beyond 22, select the last data row on each sheet and fill down, then widen the ranges in the summary-card formulas on ‘KPI Dashboard’ row 4 and in the helper columns on ‘Support’.
Are the sample numbers real welding benchmarks?
No. The 2025 sample year is fictional demonstration data built to exercise every formula and every status band. Replace it with your own figures before you report anything.
Can I change the currency and units?
Yes. The Unit column on ‘KPI Definition’ is free text and the number formats on the input sheets are ordinary Excel formats – USD, metres and kg/hr in the sample are all editable.
About the Author
Built by PK – Microsoft Certified Professional with 15+ years of Excel, Google Sheets, and Power BI experience. Founder of NextGenTemplates, reaching 300K+ subscribers across YouTube channels. Every template is hand-built and tested before release.
Explore Related Templates
A Welding Shop KPI Dashboard in Power BI – the same KPI concept rebuilt as a .pbix report – is being prepared as the cross-platform sibling of this workbook and will be linked here once it is live.
Other trade and fabrication scorecards on the same line: Masonry Contractor KPI Dashboard in Excel, Flooring Installation KPI Dashboard in Excel, Roofing Contractor KPI Dashboard in Excel and Shipbuilding KPI Dashboard in Excel. To capture the shop-floor detail that feeds these KPIs, pair it with the Job Work Order Data Entry System in Excel or the Scrap Record Data Entry System in Excel. Browse the full KPI Dashboard category and the MS Excel category.
Get the Welding Shop KPI Dashboard in Excel now – instant download, a full sample year included, and lifetime access to the file you buy. One-time payment, no subscription, nothing to install.
Last updated: 31 August 2026.
Watch the demo video:
Compatibility and Requirements
- Works in Microsoft Excel desktop (Excel 2016 or later, or Microsoft 365). The page also says it opens in Excel 2013 and later and in Excel for the web.
- Every number is a plain worksheet formula. There is no macro, Power Query, data model or add-in.
- You pick the month from a dropdown on the KPI Dashboard sheet. Microsoft explains dropdowns in Create a drop-down list.
More Questions About This Template
Is there a Google Sheets or Power BI version?
Yes. See the Welding Shop KPI Dashboard in Google Sheets and the Welding Shop KPI Dashboard in Power BI.
Do I need to enter YTD figures myself?
Yes. MTD and YTD are both typed on the Actual, Target and PY input sheets, so you decide how YTD is defined.
Can I change the On Target, At Risk and Missed bands?
Yes. The thresholds sit in the formulas in columns L and U on the KPI Dashboard sheet. The shipped bands are On Target from 100 percent, At Risk from 95 to 99 percent and Missed below 95 percent.
Does the file include sample data?
Yes. A full sample year (2025) is filled in. It is demonstration data, so replace it with your own figures before you report anything.
Related Welding and KPI Templates
- Welding Shop KPI Dashboard in Power BI: the same welding KPIs as a Power BI report
- Welding Shop KPI Dashboard in Google Sheets: the Google Sheets edition
- Welding Shop KPI Scorecard in Google Sheets: a lighter scorecard for welding shops
- Carpentry Workshop KPI Dashboard in Excel: the same dashboard style for a workshop
- KPI Dashboard Library (Excel): 15 KPI dashboard templates in one download
Browse all Excel KPI dashboards.


































Reviews
There are no reviews yet.