

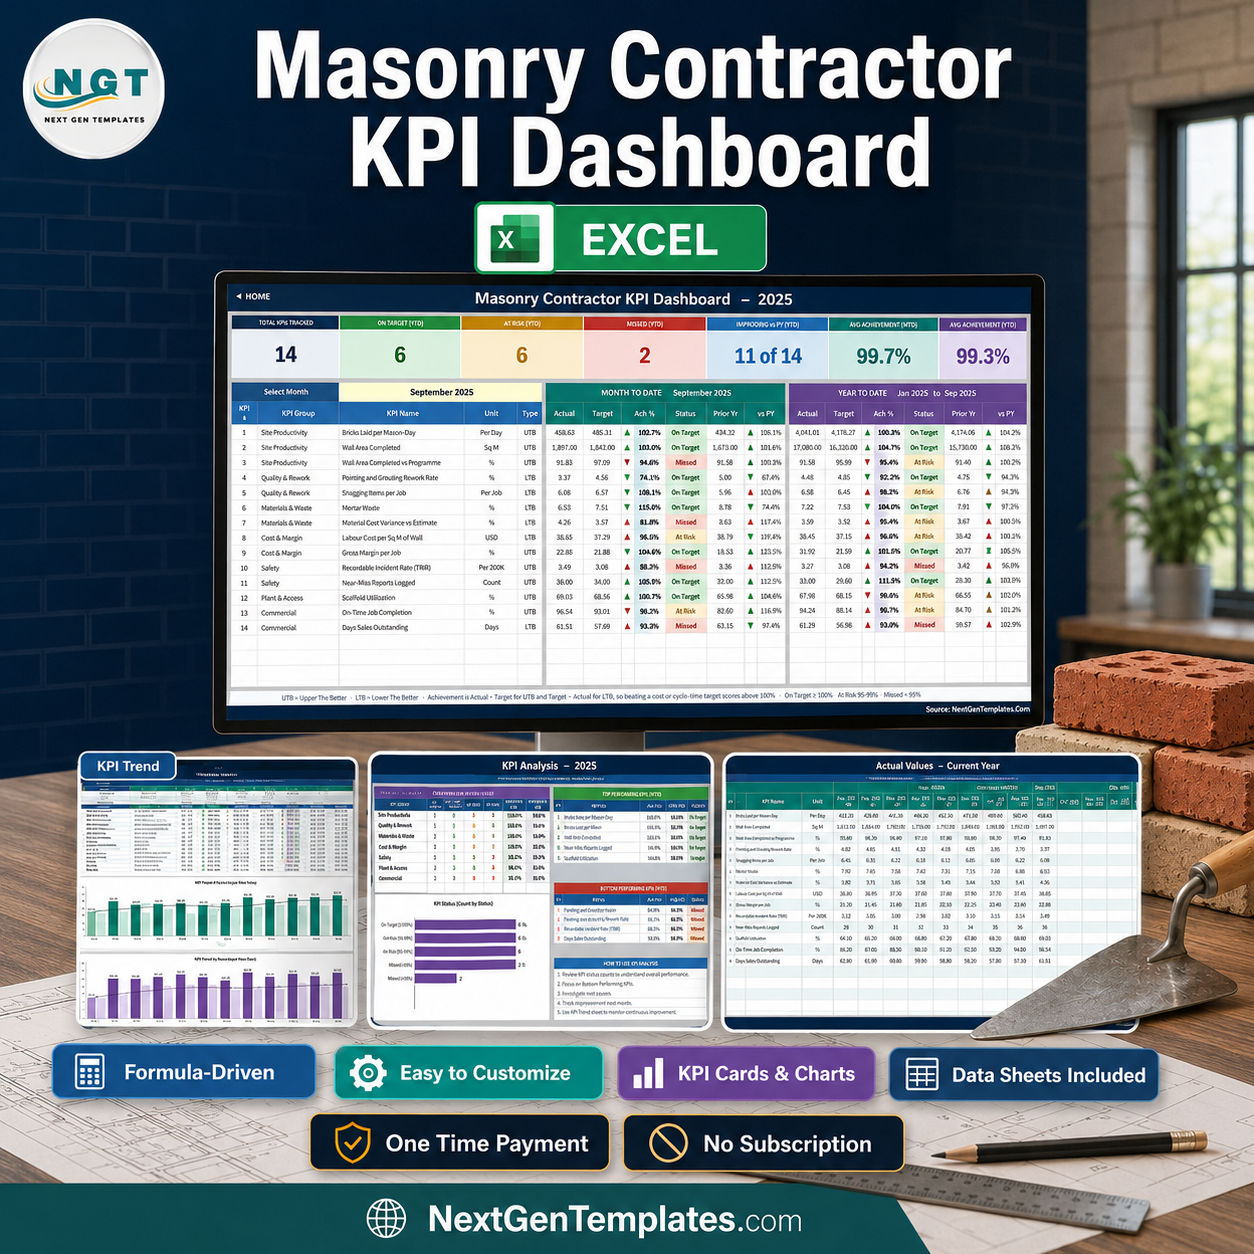

The Masonry Contractor KPI Dashboard in Excel scores 14 bricklaying KPIs across 7 groups from a single month dropdown, in an 11-sheet workbook that runs on plain worksheet formulas – no macros, no Power Query, no data model. Type your numbers on three input sheets, pick a month, and the scorecard, the trend page and the analysis page all move together. Sample data for a full 2025 year and its 2024 comparative is already in the file, so you can see it working before you replace a single figure. Instant download, lifetime access to the file you buy, and every formula is visible and editable.
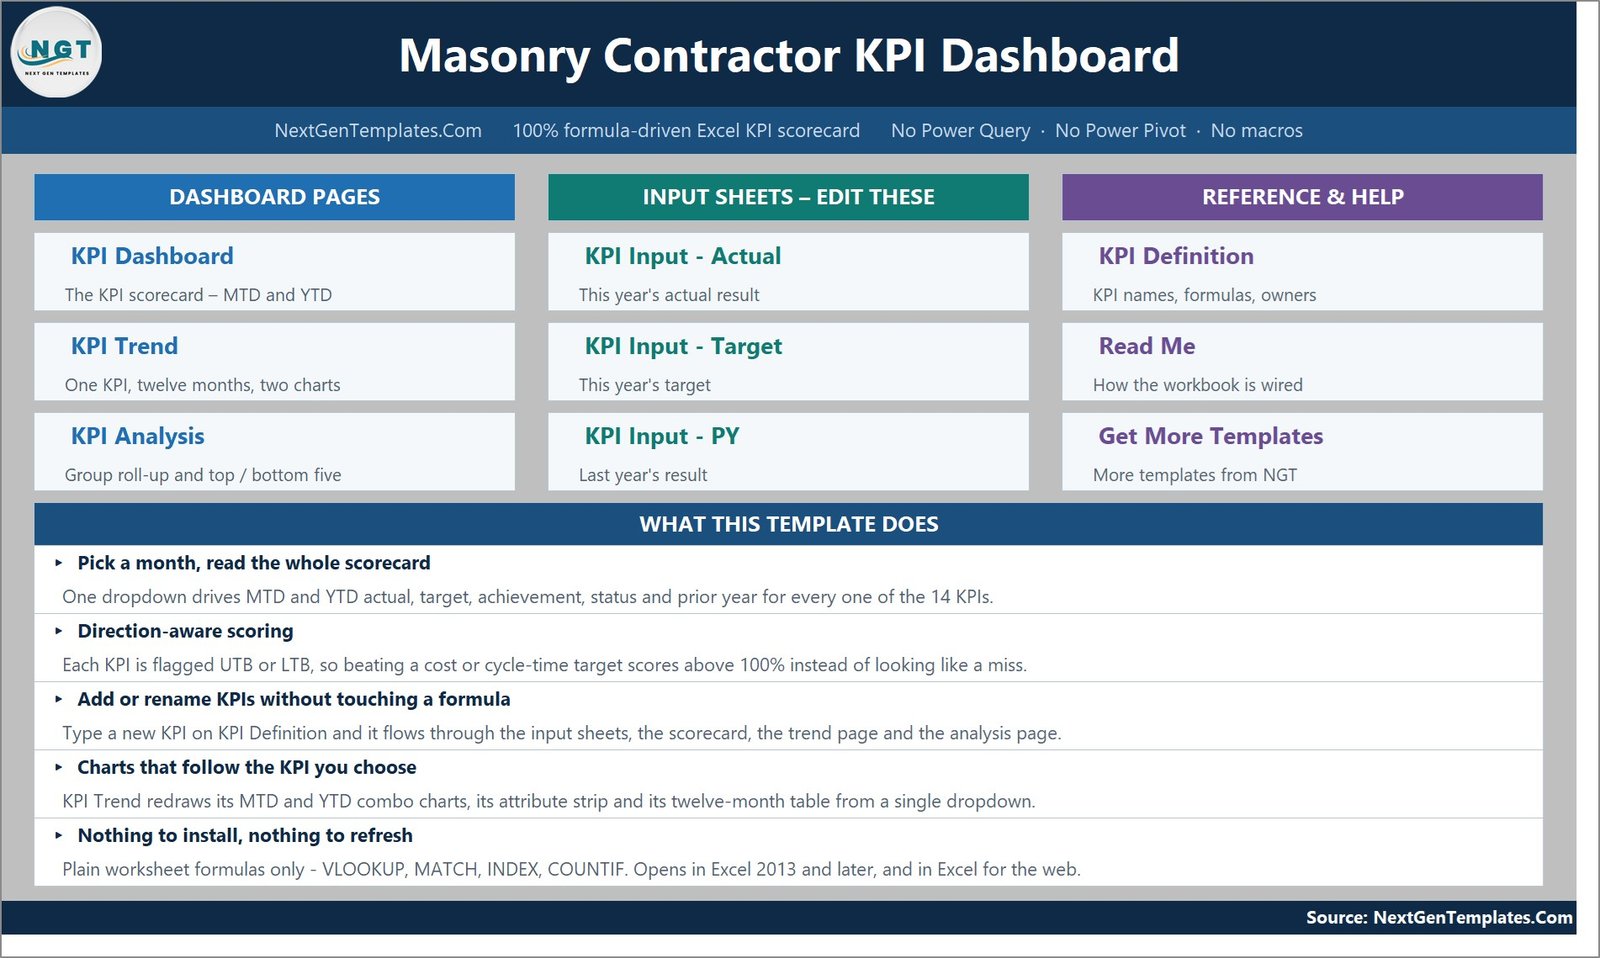
This is the KPI Dashboard line, not the analytics line and not the scorecard line. It is a month-picker scorecard: one row per KPI with MTD and YTD actual, target, achievement, status, prior year and vs-PY, plus a KPI Trend page and a KPI Analysis page. It is not the chart-led analytical Excel dashboard built on a transaction table, and it is not the shorter 10-KPI KPI Scorecard format. Read that paragraph before you buy so you get the shape you actually want.
Key Features of the Masonry Contractor KPI Dashboard in Excel
- 14 masonry KPIs in 7 groups – Site Productivity (3), Quality & Rework (2), Materials & Waste (2), Cost & Margin (2), Safety (2), Plant & Access (1) and Commercial (2).
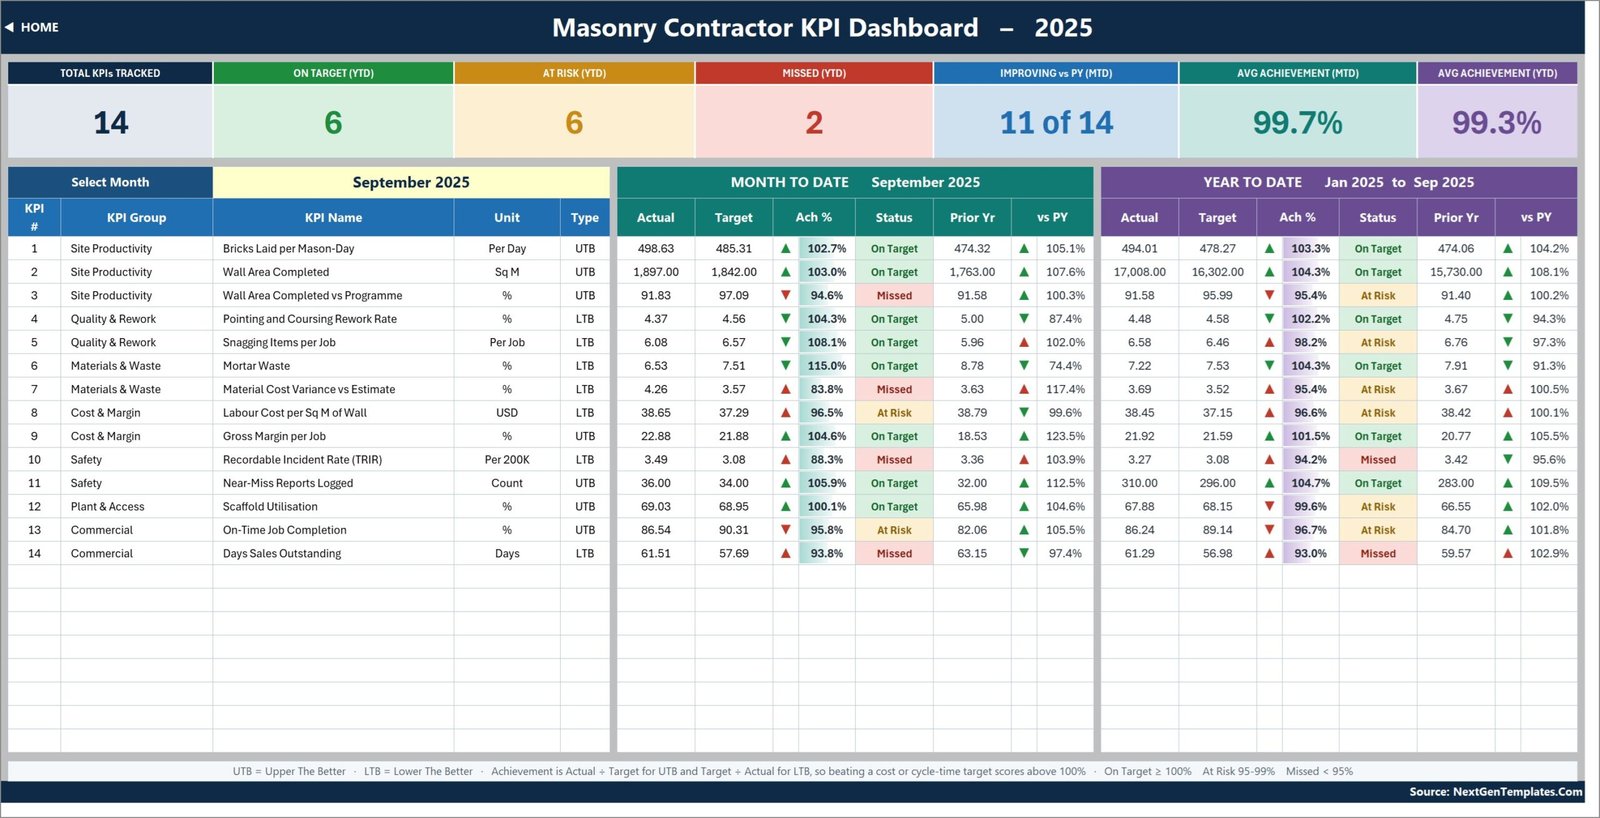
- One month dropdown drives everything – cell D6 on the KPI Dashboard sheet re-points the whole scorecard, the seven summary cards and the KPI Analysis page.
- MTD and YTD side by side – each KPI row carries actual, target, achievement %, status, prior year and vs-PY for both periods.
- Direction-aware scoring – every KPI is flagged UTB or LTB, so beating a cost, waste or DSO target scores above 100% instead of reading as a miss.
- Editable traffic lights – On Target from 100%, At Risk 95-99%, Missed below 95%; the thresholds live in columns L and U on the KPI Dashboard sheet.
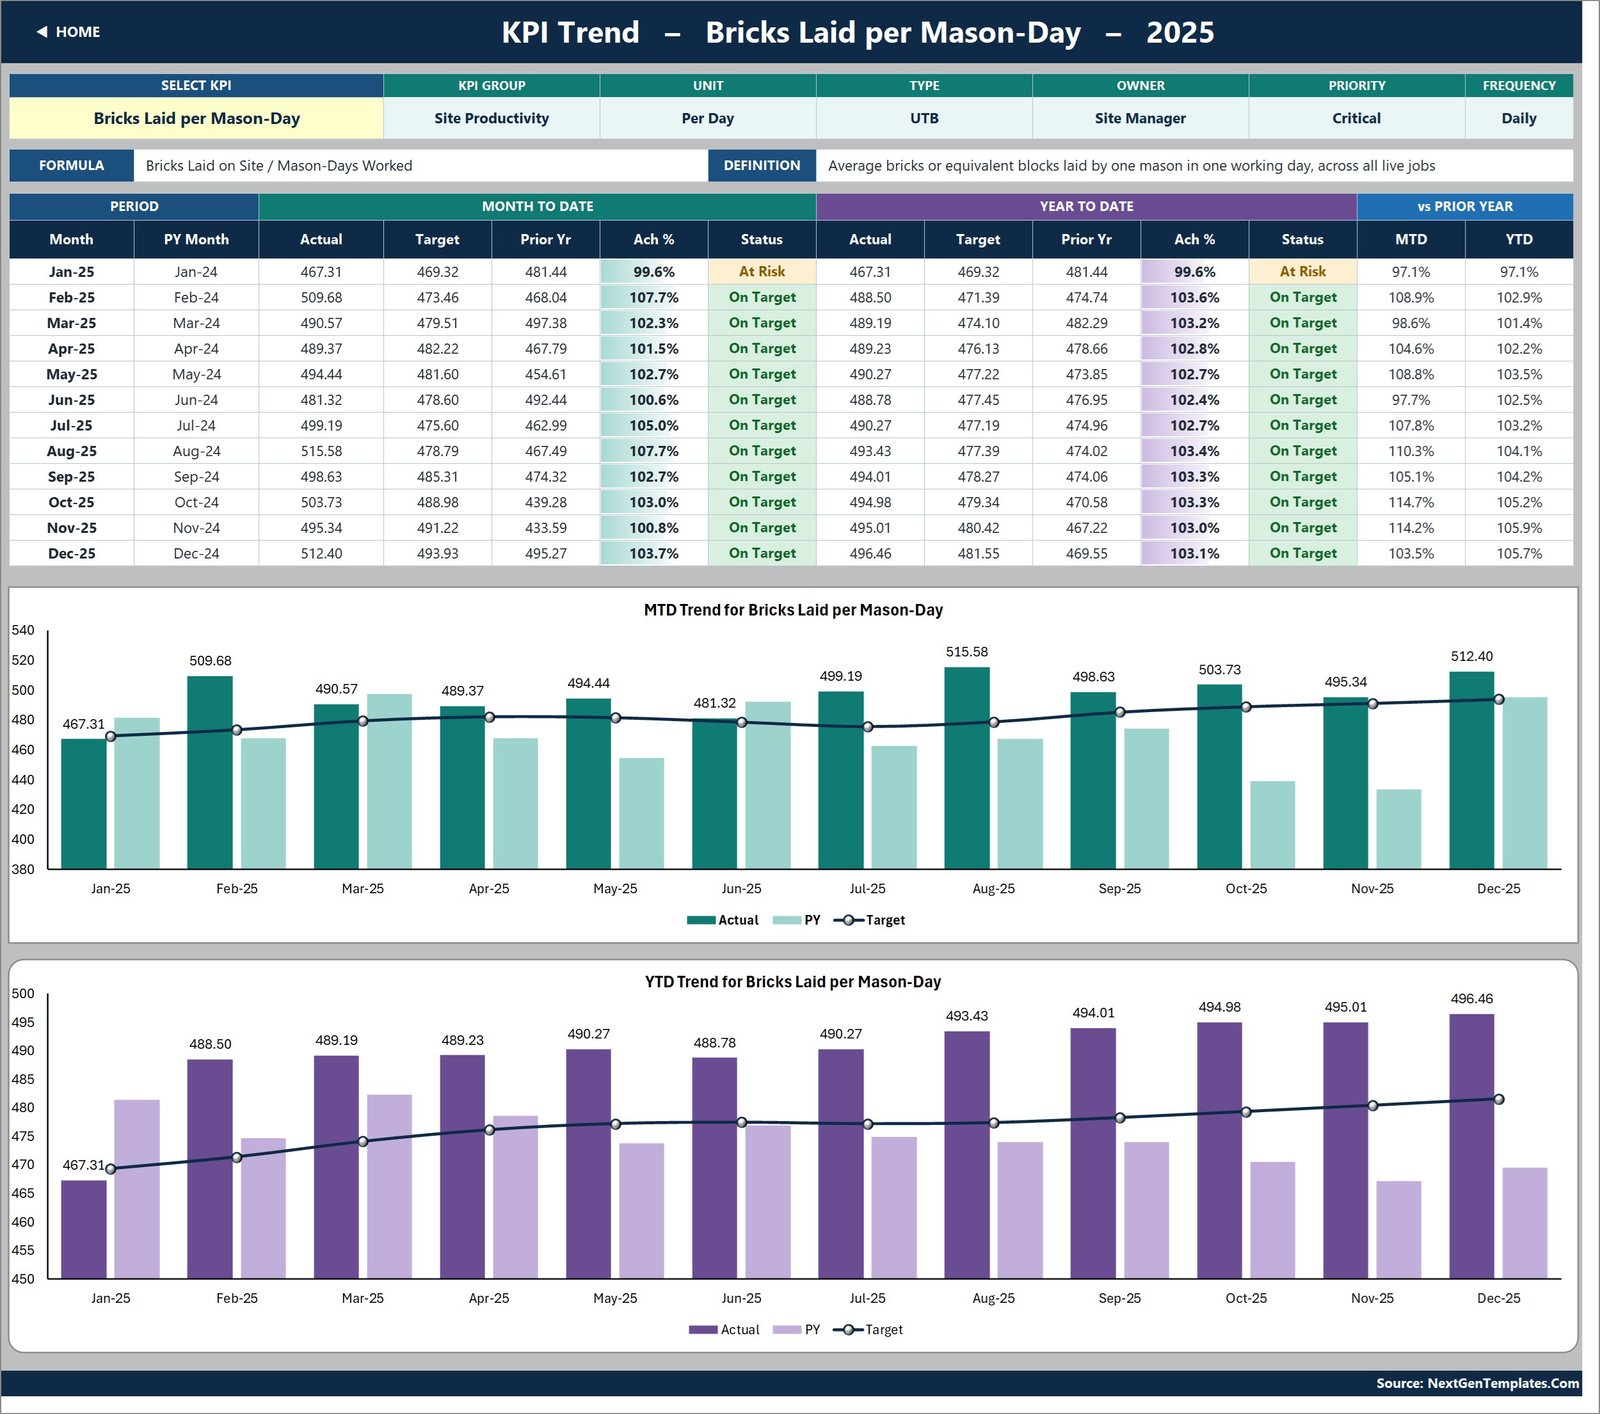
- KPI Trend page – pick any KPI in cell B4 and get its attribute strip, formula, definition, a twelve-month table and two combo charts (actual and prior-year columns with a target line).
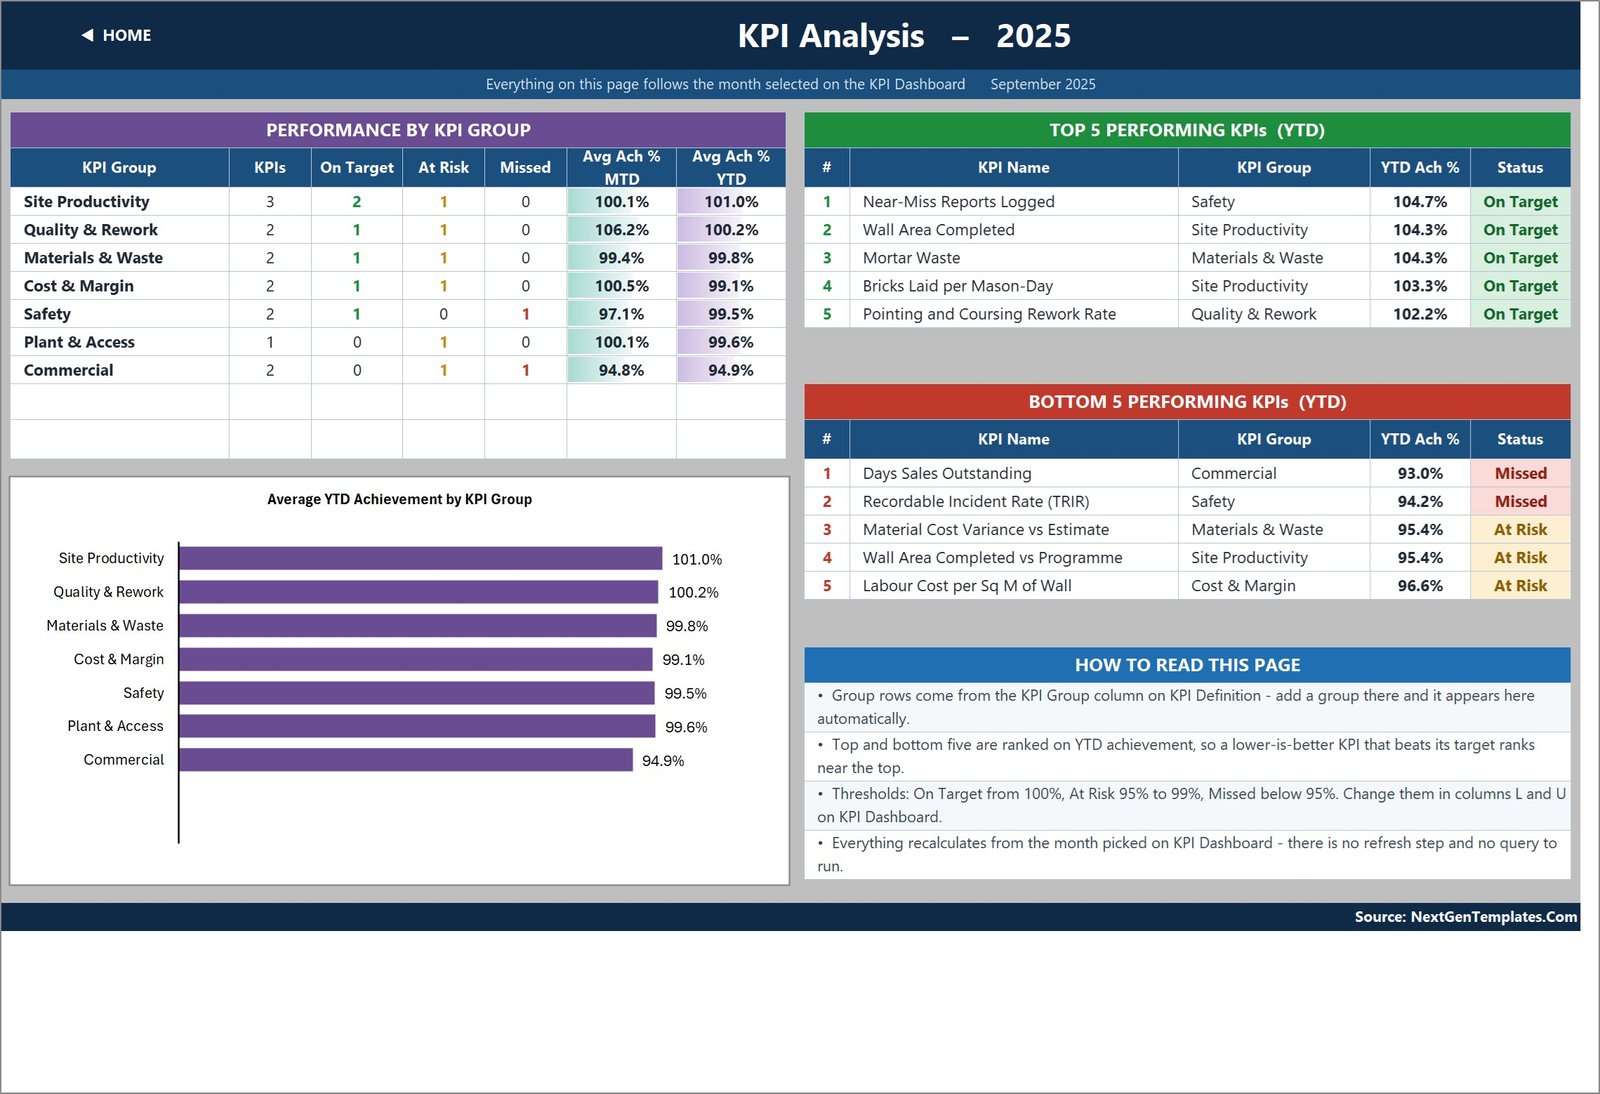
- KPI Analysis page – achievement rolled up by KPI group with a bar chart, plus Top 5 and Bottom 5 performing KPIs for the year to date.
- Add or rename KPIs without touching a formula – the KPI Definition sheet is the master list and every other sheet follows it; the sheets are wired for 22 rows, 14 filled.
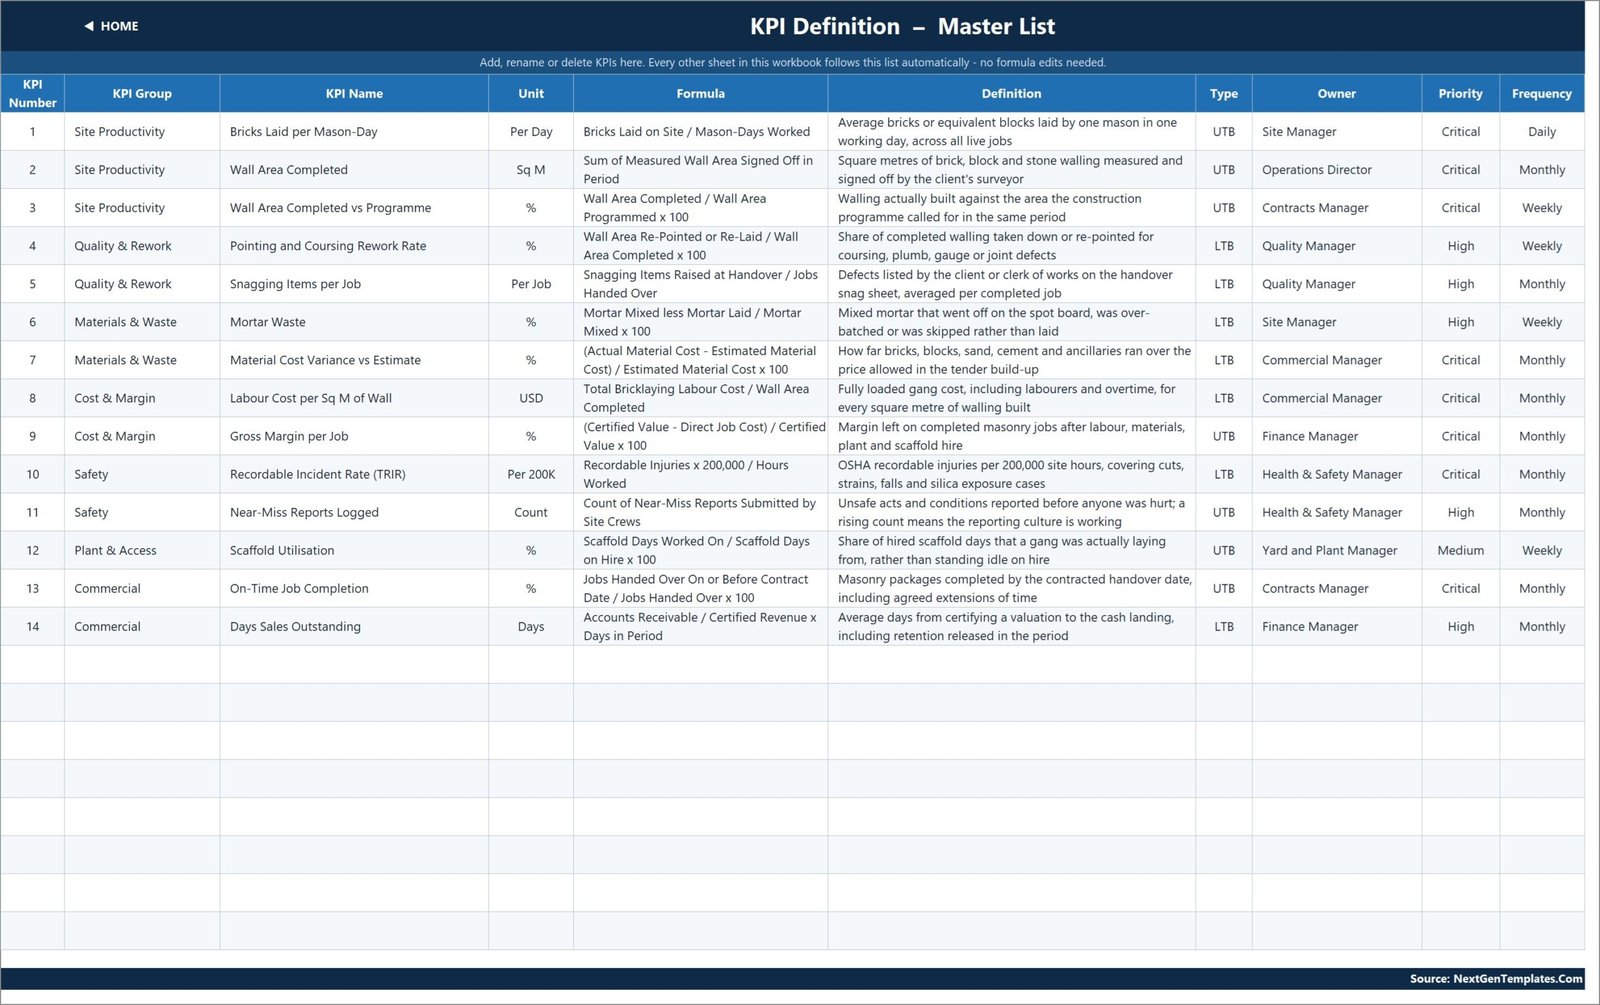
- Owner, priority and frequency per KPI – Site Manager, Contracts Manager, Quality Manager, Commercial Manager, Finance Manager, Health & Safety Manager, Yard and Plant Manager and Operations Director are all assigned in the file.
- Nothing to install or refresh – VLOOKUP, MATCH, INDEX and COUNTIF only; opens in Excel 2013 and later and in Excel for the web.
What’s Inside the Masonry Contractor KPI Dashboard in Excel
The download is one ZIP holding the .xlsx workbook and the Excel KPI Dashboard user manual (PDF). The workbook has 11 sheets – 10 you use and one hidden Support sheet that holds the helper calculations.
- Home – a navigation page linking the three dashboard pages, the three input sheets and the three reference sheets.
- KPI Dashboard – the scorecard. Seven summary cards (Total KPIs Tracked, On Target YTD, At Risk YTD, Missed YTD, Improving vs PY MTD, Avg Achievement MTD, Avg Achievement YTD) sit above one row per KPI.
- KPI Trend – one KPI, twelve months, two charts. The sample file opens on Bricks Laid per Mason-Day.
- KPI Analysis – group performance table, Average YTD Achievement by KPI Group bar chart, Top 5 and Bottom 5 tables and a short “How to read this page” panel.
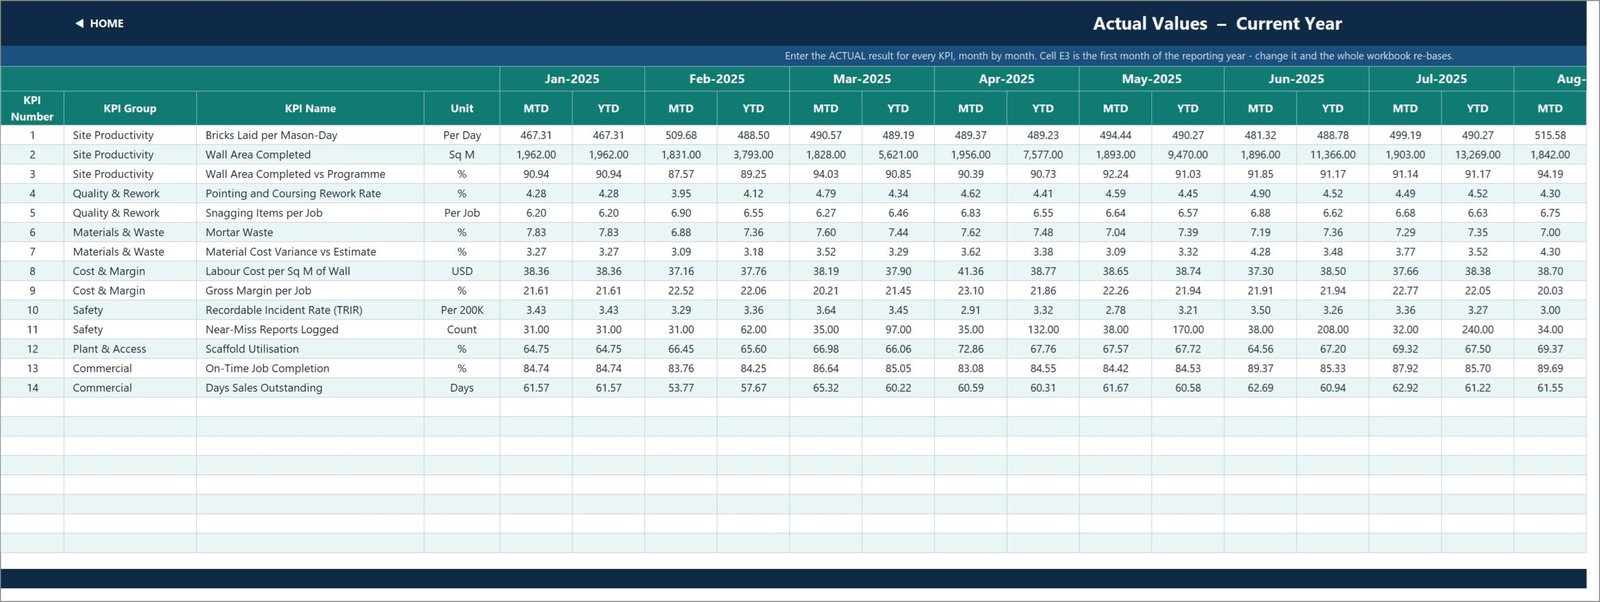
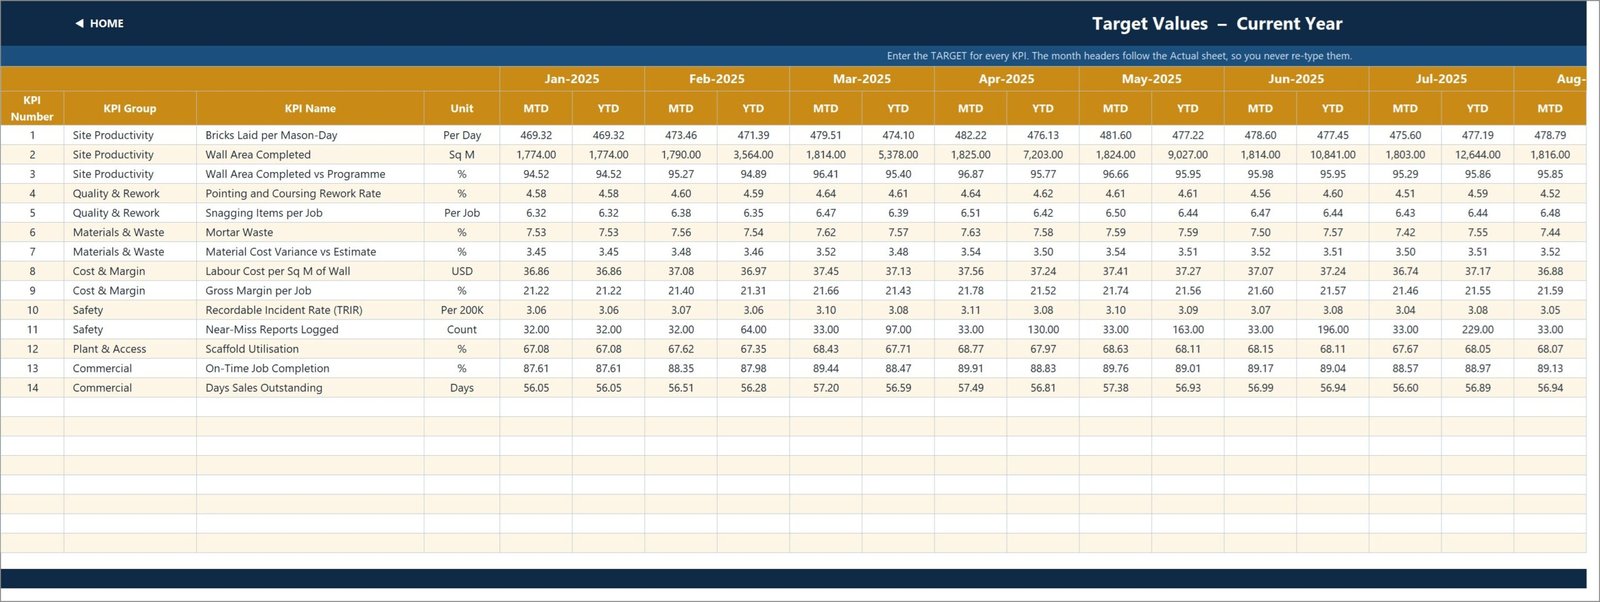
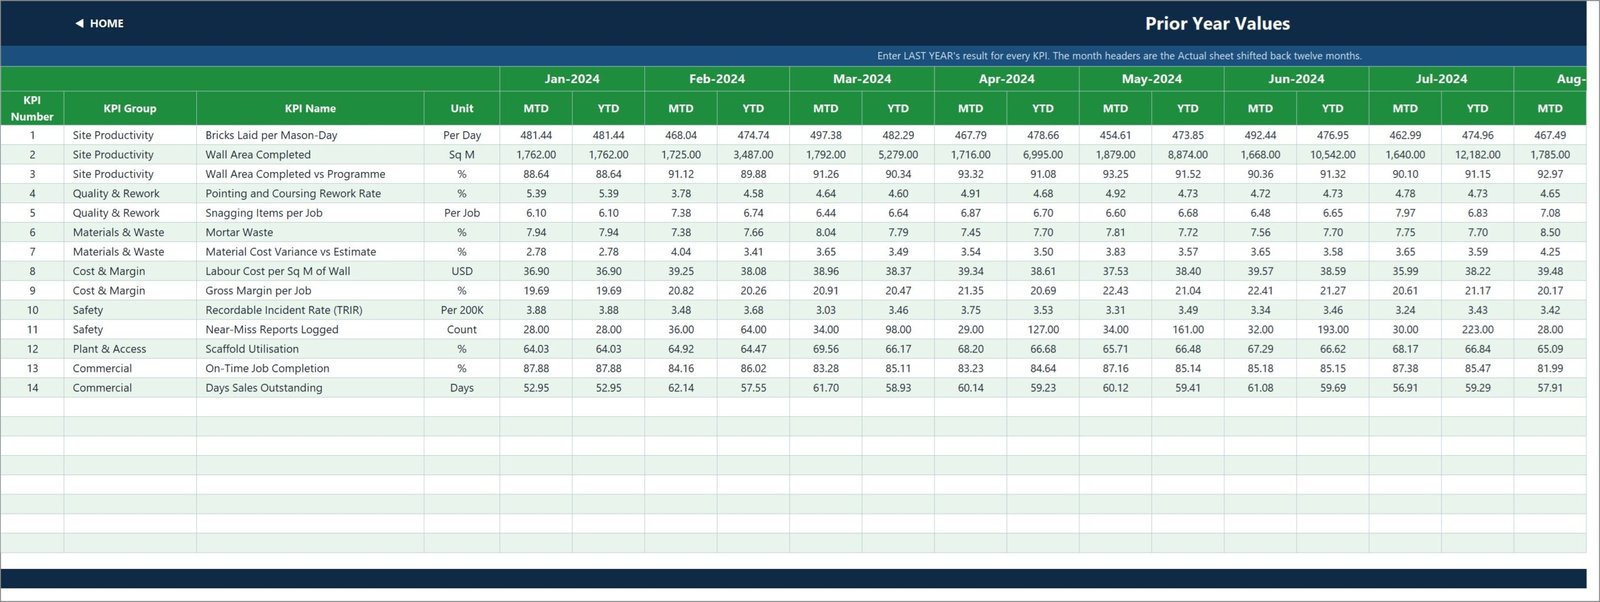
- KPI Input – Actual / Target / PY – the only three sheets you normally type into, each with an MTD and a YTD column per month. Cell E3 on the Actual sheet sets the first month of the reporting year and every other sheet re-bases from it.
- KPI Definition – the master list: number, group, name, unit, formula, definition, type, owner, priority and frequency.
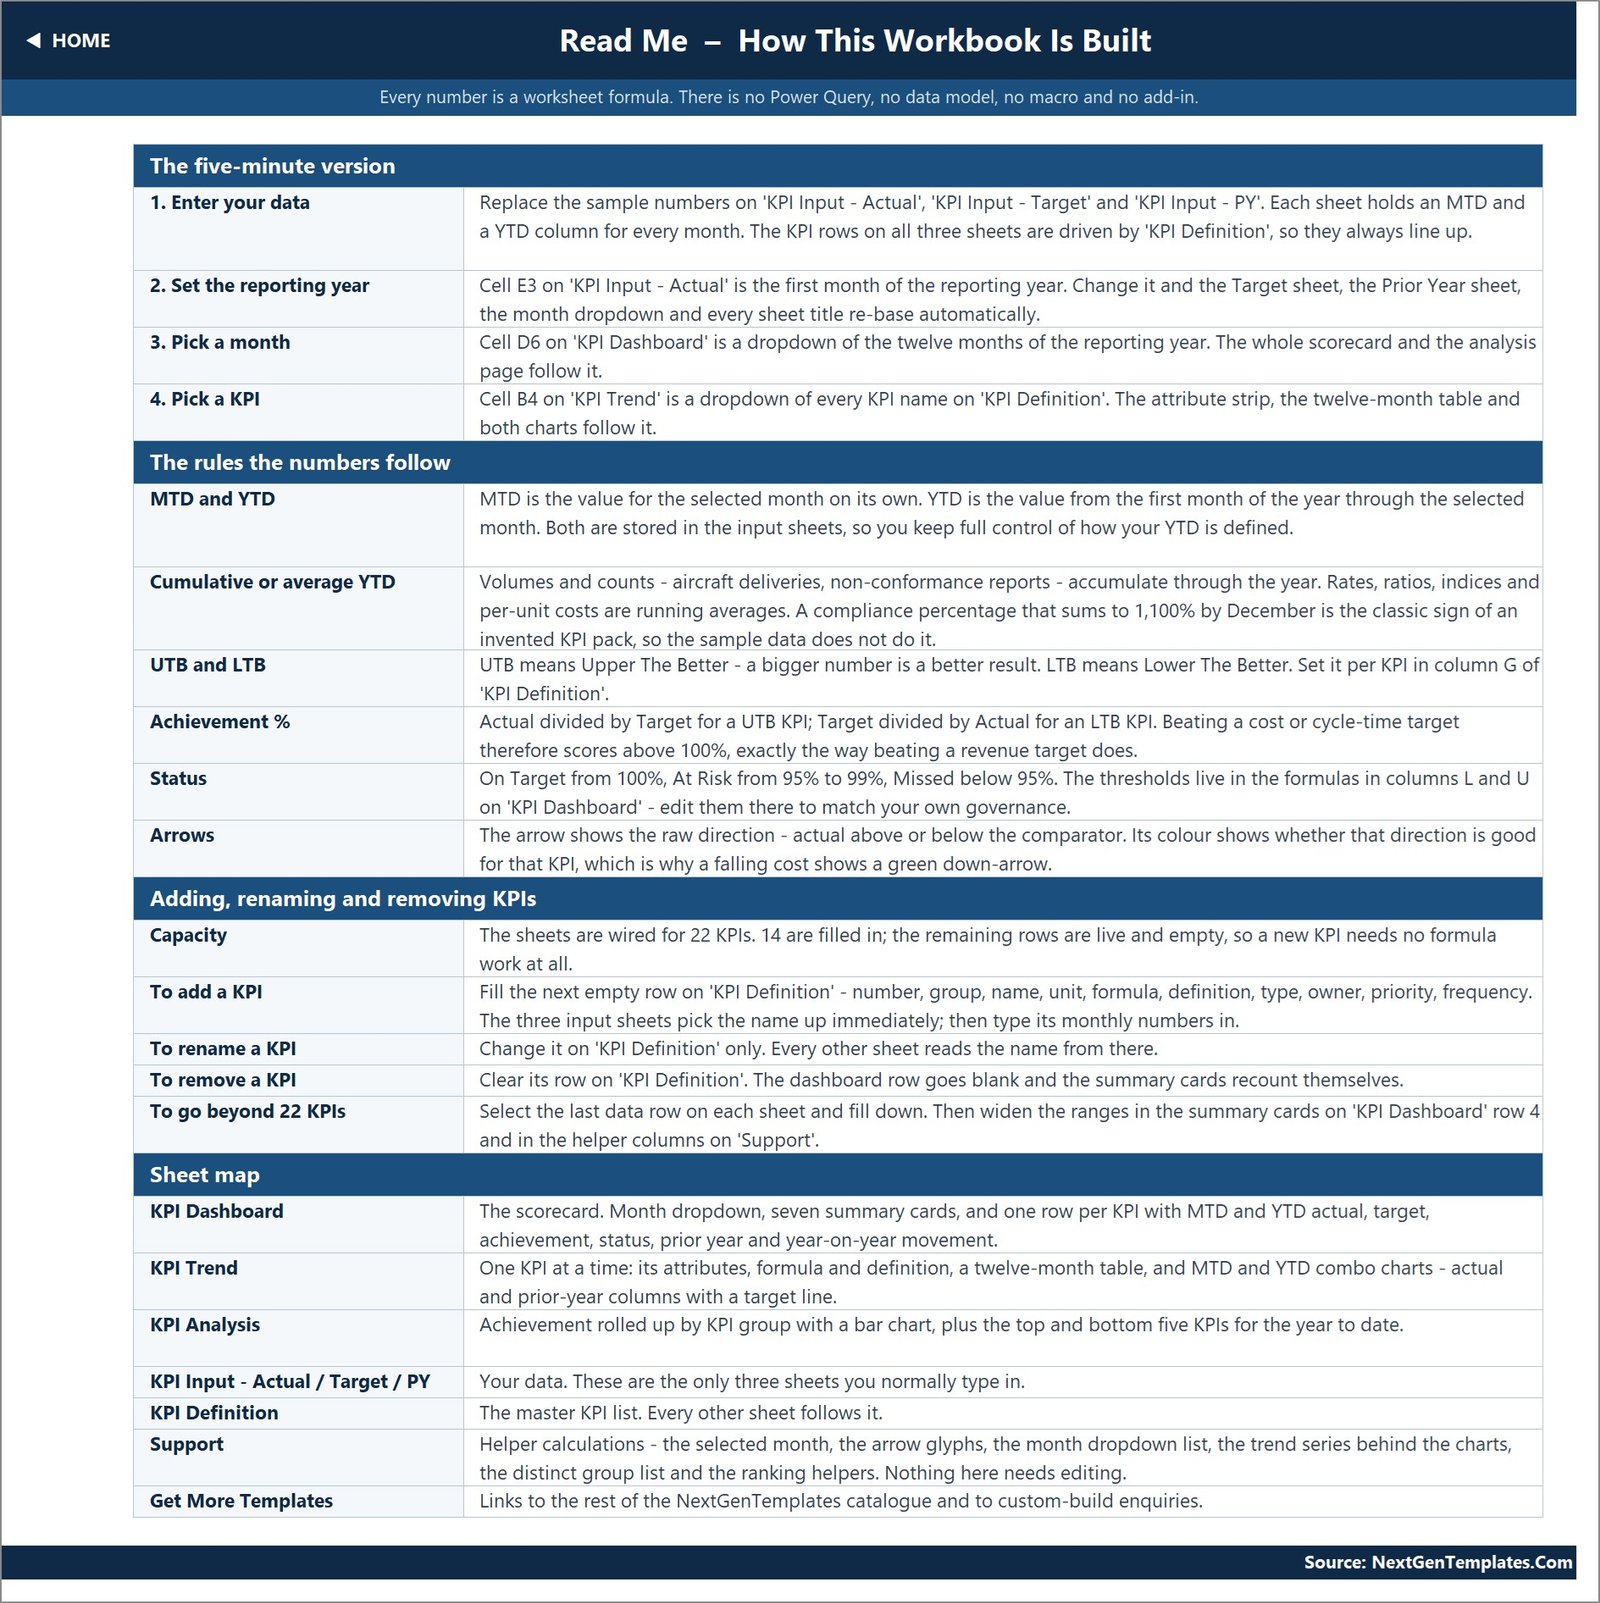
- Read Me – how the workbook is wired, the MTD/YTD and UTB/LTB rules, and how to add, rename or remove a KPI.
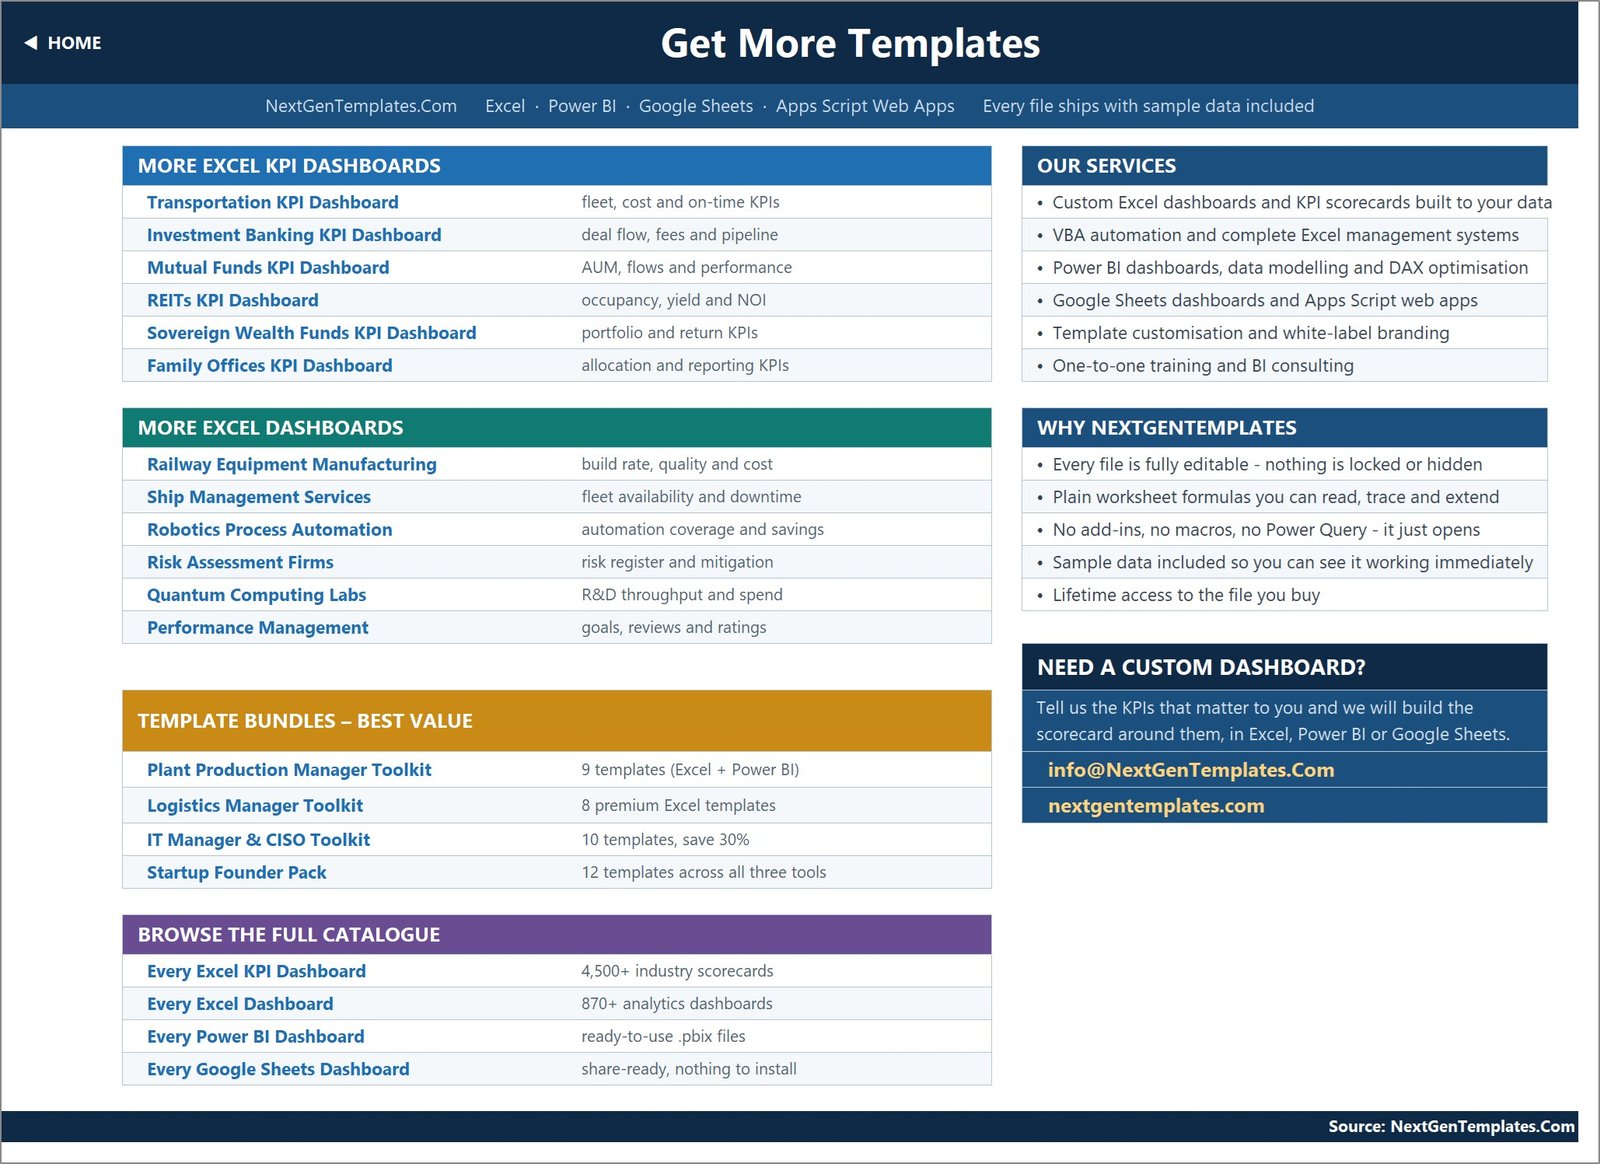
- Get More Templates – links to the rest of the catalogue and to custom-build enquiries.
Masonry Contractor KPI Dashboard in Excel vs. Google Sheets vs. Paid Construction SaaS – Where This Fits
| This Excel KPI Dashboard | Google Sheets KPI template | Procore / Buildertrend | |
|---|---|---|---|
| Cost | $12.99 one time | $8.99 one time | $300-$1,000+ per month |
| Platform | Excel 2013+, Excel for the web | Browser, Google account | Web and mobile app |
| Setup time | Under 30 minutes | Under 30 minutes | Weeks, with onboarding |
| Real-time team collaboration | Via OneDrive or SharePoint | Yes, native | Yes, native |
| Mobile access | Excel mobile app | Yes | Yes |
| Customisable KPI list | Yes – rename or add on one sheet | Yes | Limited to vendor fields |
| Share with a link | Via cloud storage | Yes | Yes, per seat |
| Year-1 cost at 5 users | $12.99 | $8.99 | $3,600-$12,000+ |
| Direction-aware (UTB/LTB) scoring | Yes, per KPI | Yes, per KPI | Varies by module |
| Owns your data | Yes – a file on your disk | Yes – your Drive | Vendor hosted |
Who This Template Is For – and Who It’s Not For
It is for bricklaying and stonework subcontractors reporting monthly to a main contractor, small-to-mid masonry firms running several jobs at once, contracts and commercial managers who need one page to take into a monthly review, and anyone who wants site productivity, rework, mortar waste, margin, safety and cash on one screen.
It is not for live site data capture – there is no app or form here. It is not a takeoff or estimating tool, and it will not price a job. It does not import from Procore, Sage or Xero; you enter monthly figures yourself. If you want charts built from a job-by-job transaction table rather than a KPI scorecard, the analytical Excel dashboards are the better fit.
How to Use the Masonry Contractor KPI Dashboard in Excel
- Unzip the download and open the .xlsx in Microsoft Excel. Nothing to enable, nothing to install.
- On KPI Input – Actual, set cell E3 to the first month of your reporting year. Every sheet title, the Target sheet, the Prior Year sheet and the month dropdown re-base to it.
- Open KPI Definition and edit the 14 KPI rows to match your own reporting pack – name, unit, formula, definition, UTB or LTB, owner, priority, frequency. Free rows are live and empty up to 22.
- Type your monthly numbers on KPI Input – Actual, Target and PY. Each month has an MTD and a YTD column, so you keep control of how your YTD is defined.
- Go to KPI Dashboard, pick a month in cell D6, and read the scorecard.
- Pick any KPI in cell B4 on KPI Trend to see its twelve-month table and both charts.
- Adjust the On Target / At Risk / Missed thresholds in columns L and U if your governance uses different bands.
Real-World Use Cases
Daniel, contracts manager at a 40-mason subcontractor. He takes the KPI Dashboard sheet into the monthly commercial review. Wall Area Completed vs Programme is the row the main contractor asks about first; when it reads 94.6% and flags Missed for the month, the Bottom 5 table on KPI Analysis already shows it sitting third from the bottom on the year, which turns a defensive conversation into a planned recovery.
Priya, commercial manager pricing the next tender. She reads Labour Cost per Sq M of Wall and Material Cost Variance vs Estimate on the twelve-month KPI Trend page rather than a single month, so the rate she puts in the build-up reflects the real run of the year instead of one bad valuation period.
Tom, health and safety manager. He owns two rows – Recordable Incident Rate (TRIR), scored lower-is-better, and Near-Miss Reports Logged, scored higher-is-better. Having both on the same scorecard is the point: a falling near-miss count next to a rising TRIR is the pattern he needs to catch early.
Frequently Asked Questions
Does this workbook need macros, Power Query or the data model?
No. Every number is a plain worksheet formula – VLOOKUP, MATCH, INDEX and COUNTIF. There is no macro, no query to refresh and no add-in. It opens in Excel 2013 and later, and in Excel for the web.
Can I change the KPIs to my own?
Yes. Rename or replace them on the KPI Definition sheet only; the three input sheets, the scorecard, the trend page and the analysis page all read the names from there. The sheets are wired for 22 KPI rows and 14 are filled, so you can add eight more with no formula work at all.
What does UTB and LTB mean, and why do some rows score above 100%?
UTB is Upper The Better and LTB is Lower The Better. Achievement is Actual / Target for a UTB KPI and Target / Actual for an LTB KPI, so beating a mortar-waste or DSO target correctly scores above 100% instead of looking like a shortfall.
Is the sample data real?
No. The workbook ships with a complete, internally consistent sample year for 2025 and its 2024 comparative so you can see every formula working. Replace it with your own figures.
How is this different from the Masonry Contractor KPI Scorecard?
The scorecard is a shorter 10-KPI format. This KPI Dashboard is the fuller month-picker build: 14 KPIs, seven summary cards, a dedicated KPI Trend page and a KPI Analysis page with group roll-up and Top 5 / Bottom 5 tables.
Can more than one person use it?
Yes. Put the file on OneDrive or SharePoint and co-author it like any other Excel workbook. There is no licence server and no seat count.
What exactly do I get in the download?
One ZIP containing the .xlsx workbook and the Excel KPI Dashboard user manual as a PDF. Instant download, lifetime access to the file.
About the Author
Built by PK – Microsoft Certified Professional with 15+ years of Excel, Google Sheets, and Power BI experience. Founder of NextGenTemplates, reaching 300K+ subscribers across YouTube channels. Every template is hand-built and tested before release.
Explore Related Templates
- HVAC Contractor KPI Dashboard in Excel – the same scorecard build for service and installation work.
- Electrical Contractor KPI Dashboard in Excel – first-fix, testing and compliance KPIs.
- Plumbing Business KPI Dashboard in Excel – another trade in the same format.
- Masonry Contractor KPI Scorecard in Google Sheets – the shorter browser-based sibling.
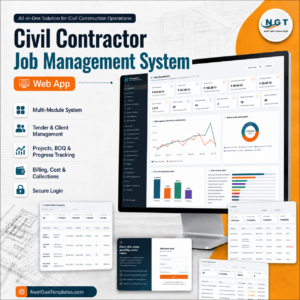
- Civil Contractor Job Management System Web App – when you need job capture, not just reporting.
- Browse every Excel KPI Dashboard or the full MS Excel catalogue.
Get the Masonry Contractor KPI Dashboard in Excel for $12.99 (regular $19.99). Instant download, lifetime access, fully editable, no subscription and no add-ins. Add it to your cart and you can be reading your own September scorecard this afternoon.
Last updated: 29 August 2026.

































Reviews
There are no reviews yet.