

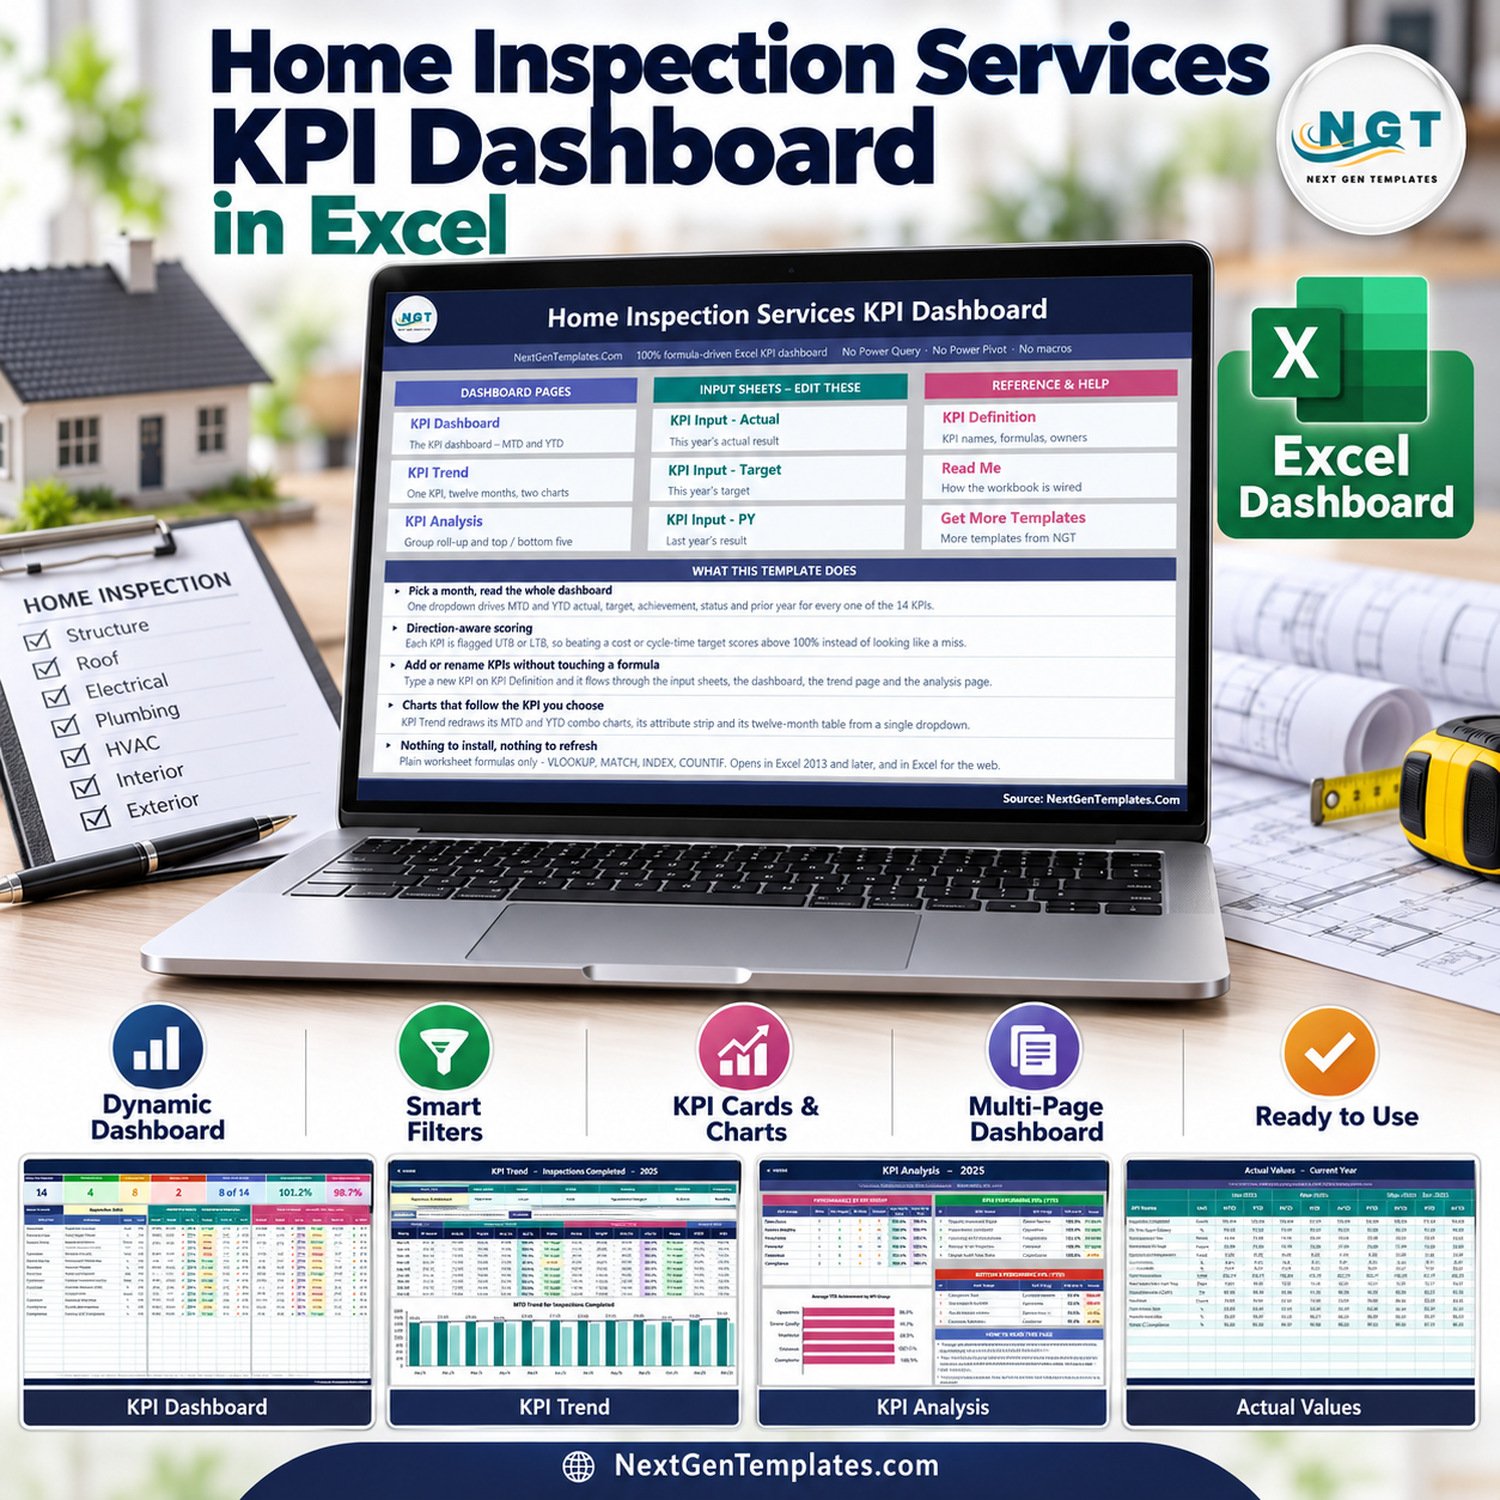
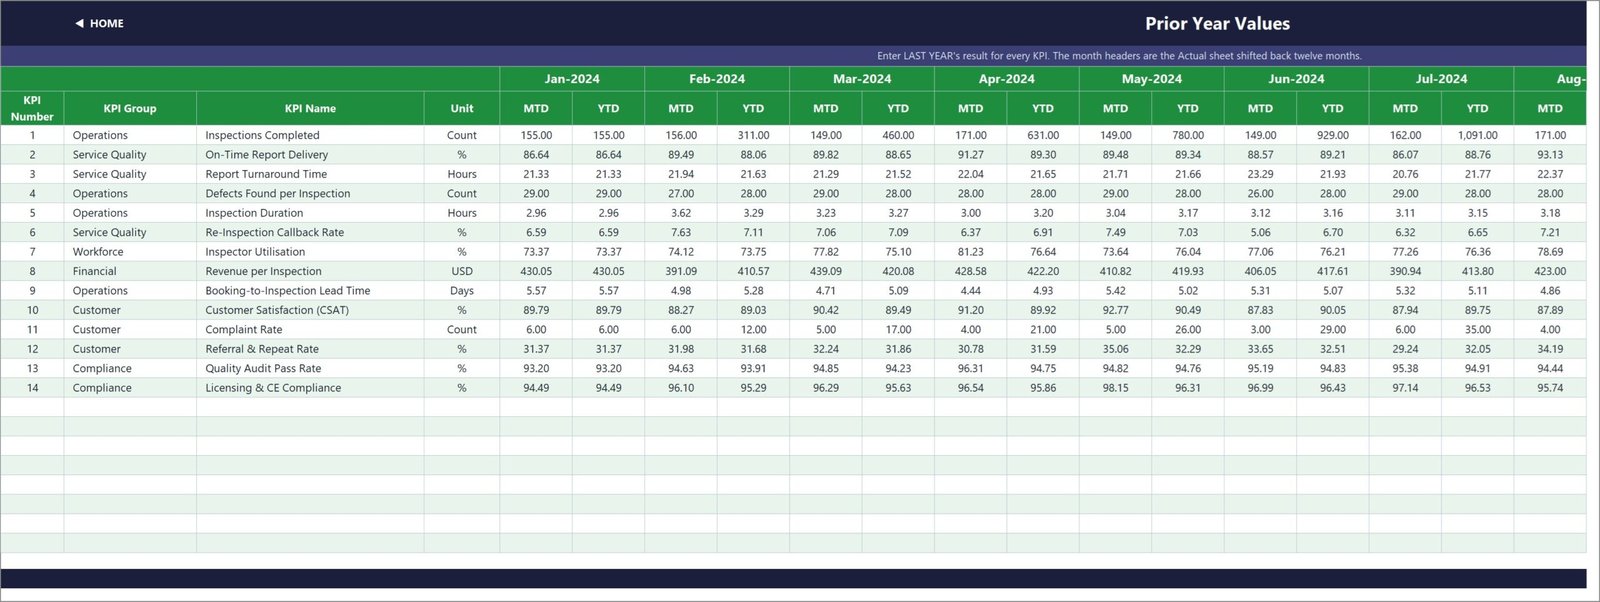
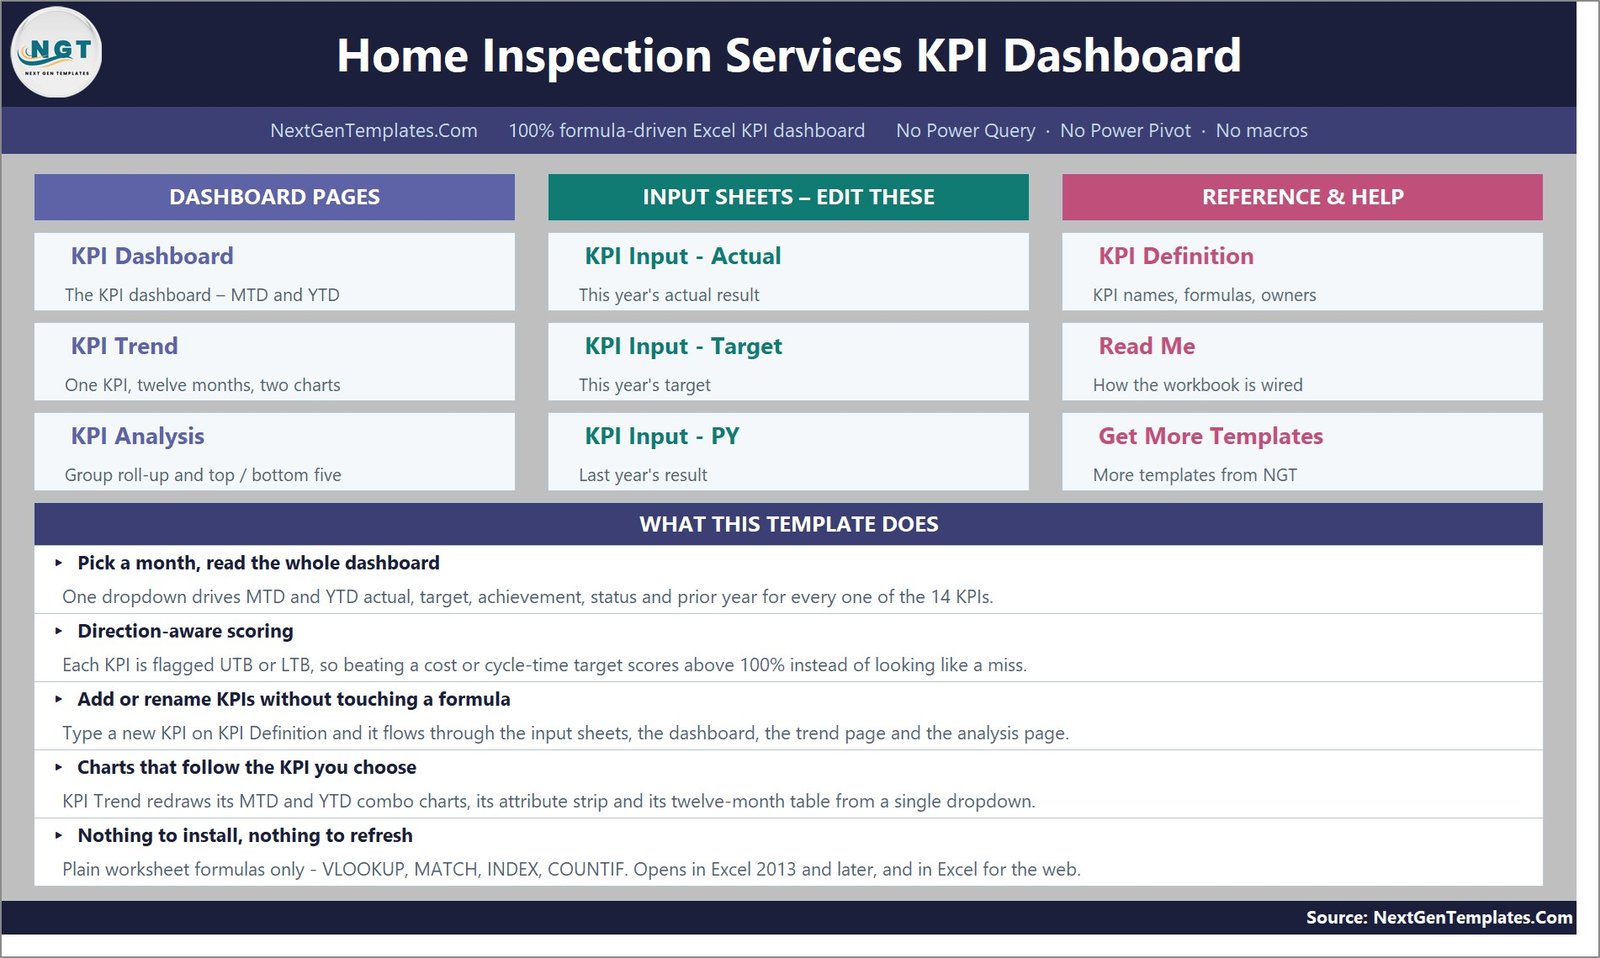
Home inspection services KPI dashboard in Excel gives inspection-company owners and operations managers one formula-driven workbook for reviewing 14 service, quality, workforce, financial, customer, and compliance KPIs. Seven summary cards show total KPIs, on-target, at-risk, missed, prior-year improvement, and average MTD/YTD achievement. The file includes sample data, so you can inspect the working logic immediately; after purchase, replace the sample values with your own actuals, targets, and prior-year figures.
Key Features of Home Inspection Services KPI Dashboard in Excel
- 14 home inspection KPIs: ready-made measures for operations, service quality, workforce, finance, customers, and compliance.
- Month-driven reporting: one dropdown updates MTD and YTD actual, target, achievement, status, and prior-year comparisons.
- Direction-aware scoring: UTB and LTB logic evaluates higher-is-better and lower-is-better measures correctly.
- Seven dashboard cards: quickly see total KPIs, on-target, at-risk, missed, improving, and average achievement results.
- KPI Trend page: choose one KPI to review a 12-month table plus MTD and YTD charts.
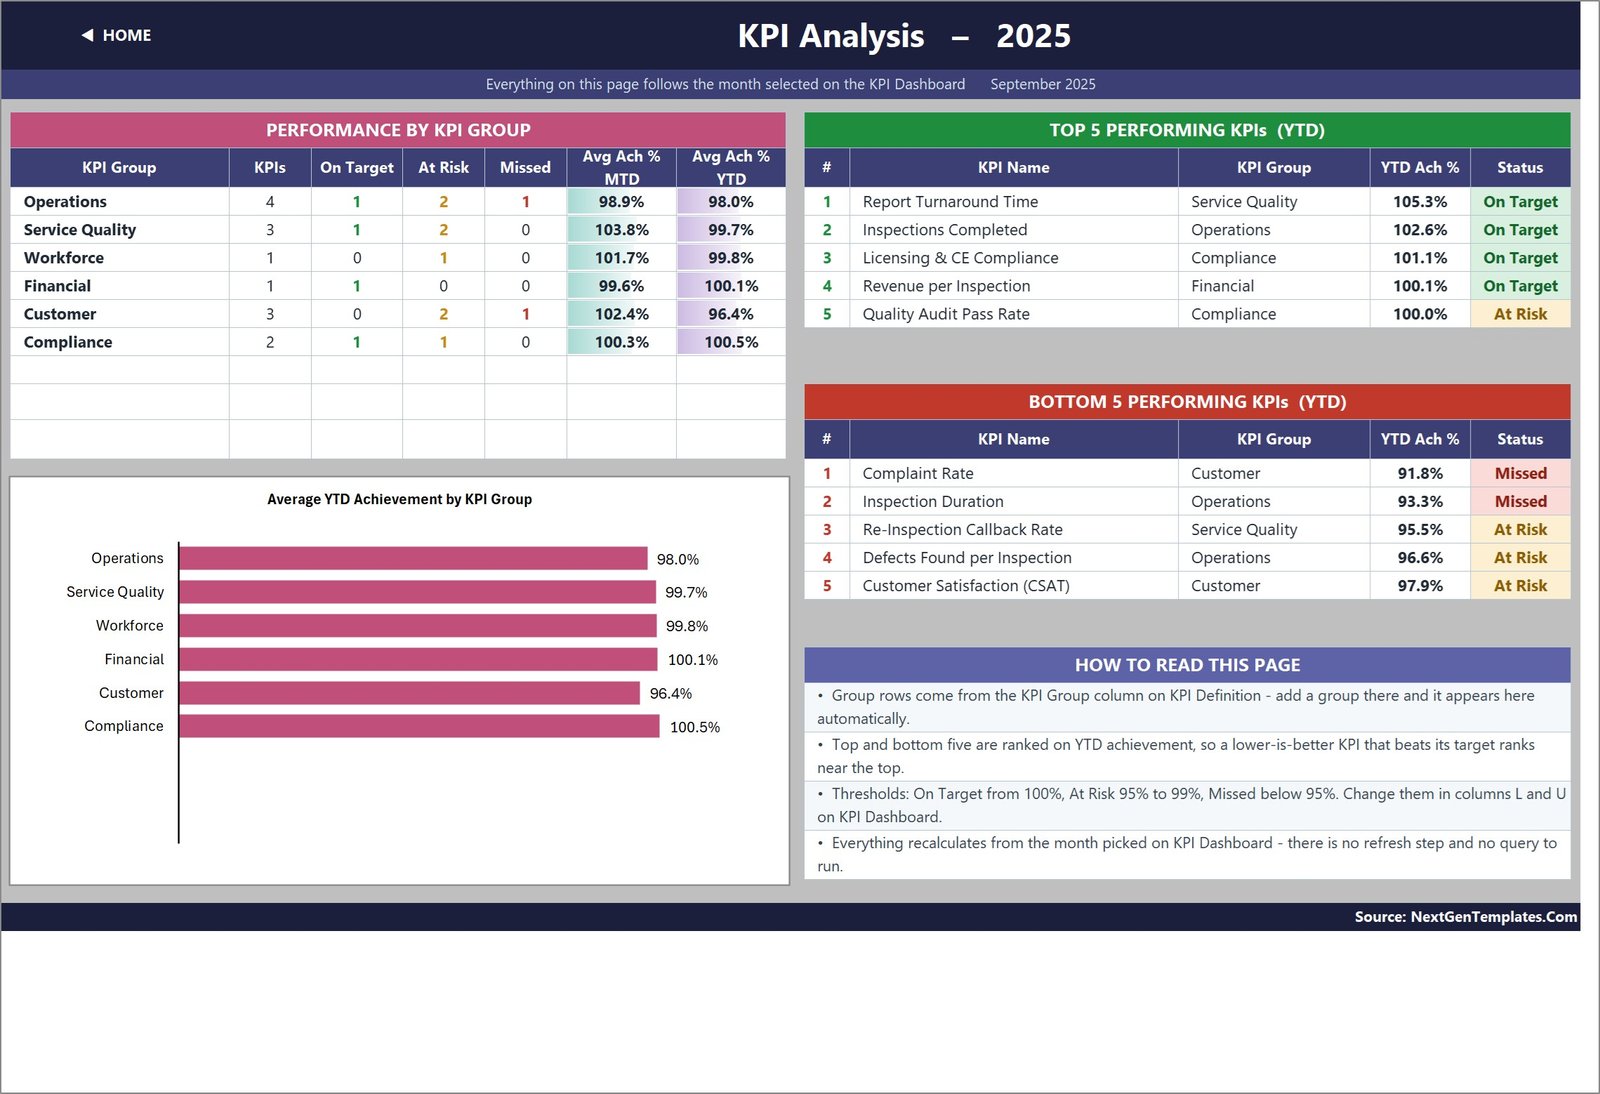
- KPI Analysis page: compare KPI groups and identify the top and bottom five performers.
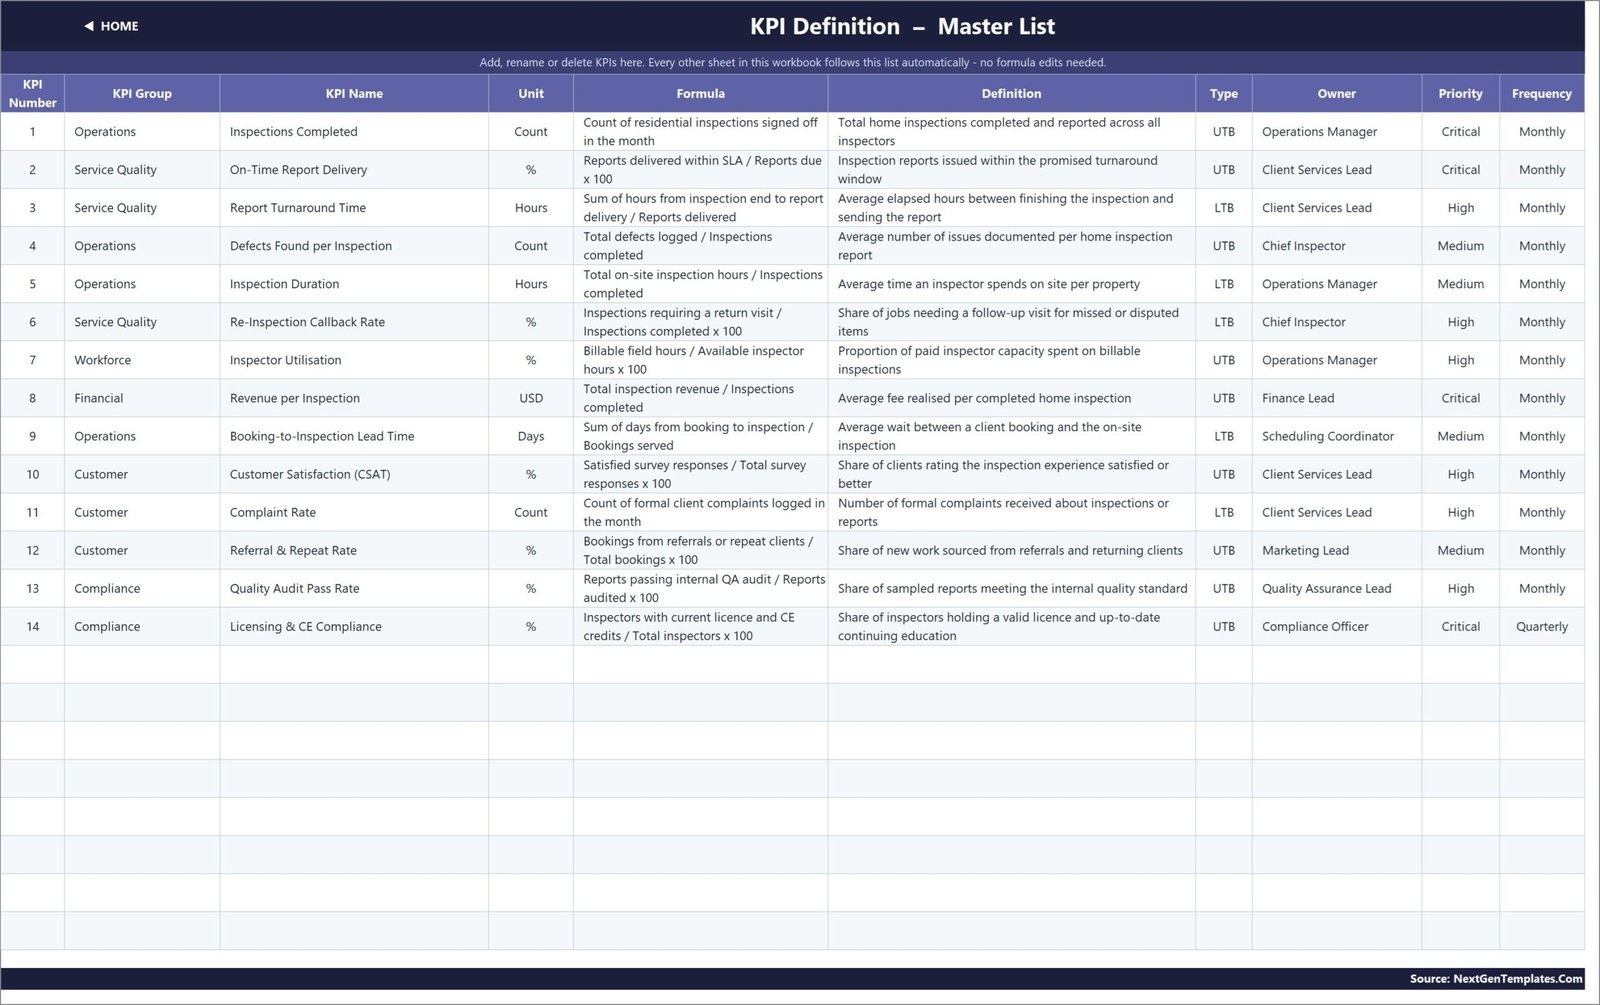
- Editable definitions: change KPI names, groups, units, formulas, definitions, types, owners, priorities, and frequencies.
- No macros or add-ins: the workbook uses standard Excel formulas without Power Query or Power Pivot.
The phrase home inspection KPI dashboard Excel describes exactly what buyers receive: a ready-to-edit .xlsx workbook supported by a PDF user manual.
What’s Inside the Home Inspection KPI Workbook
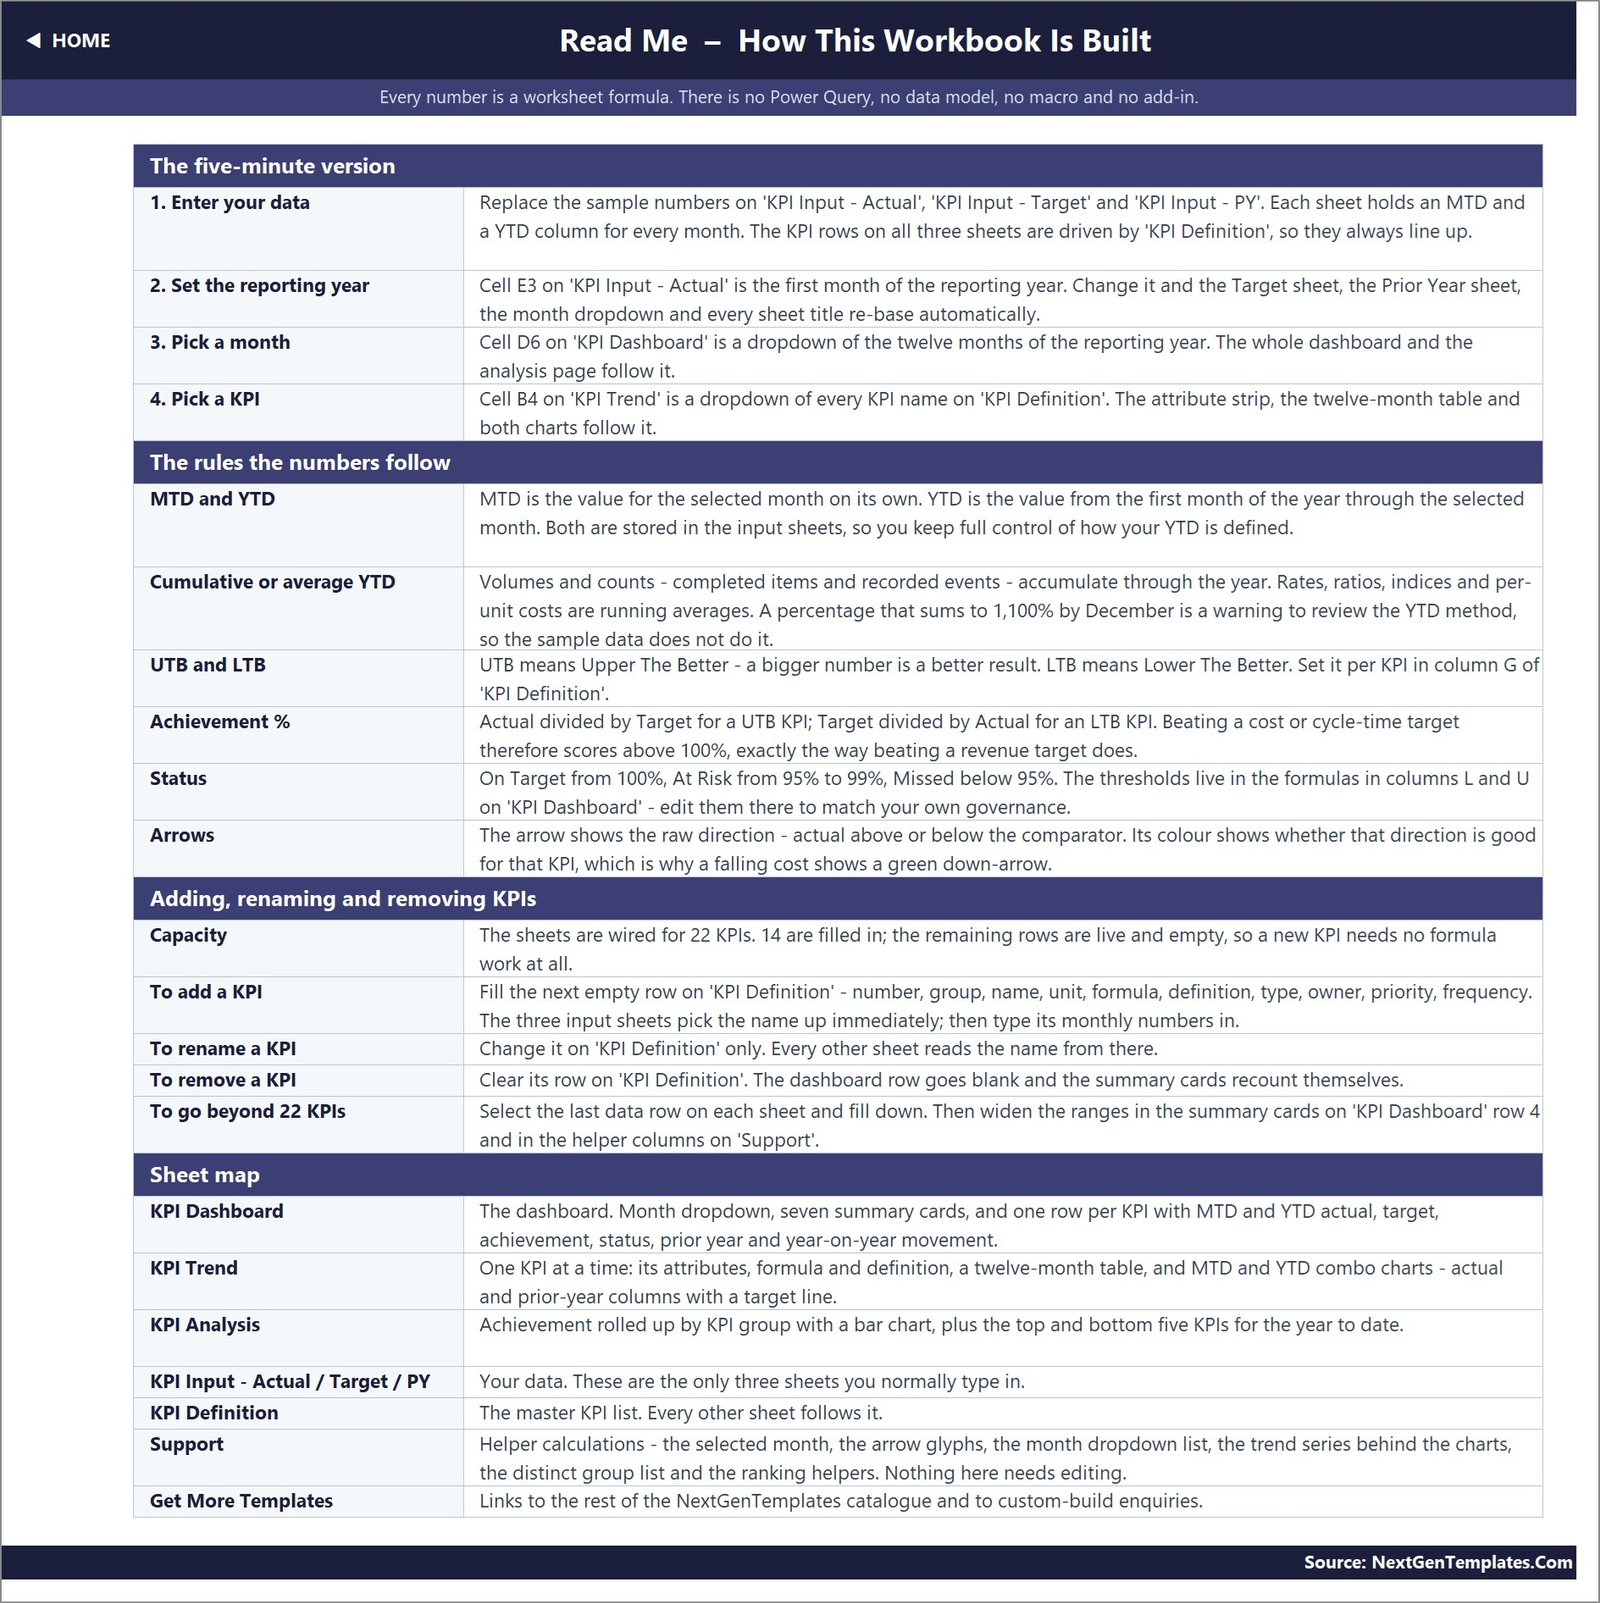
The ZIP includes the Excel workbook and the Excel KPI Dashboard user manual. The workbook contains Home, KPI Dashboard, KPI Trend, KPI Analysis, KPI Input – Actual, KPI Input – Target, KPI Input – PY, KPI Definition, Support, Read Me, and Get More Templates sheets.
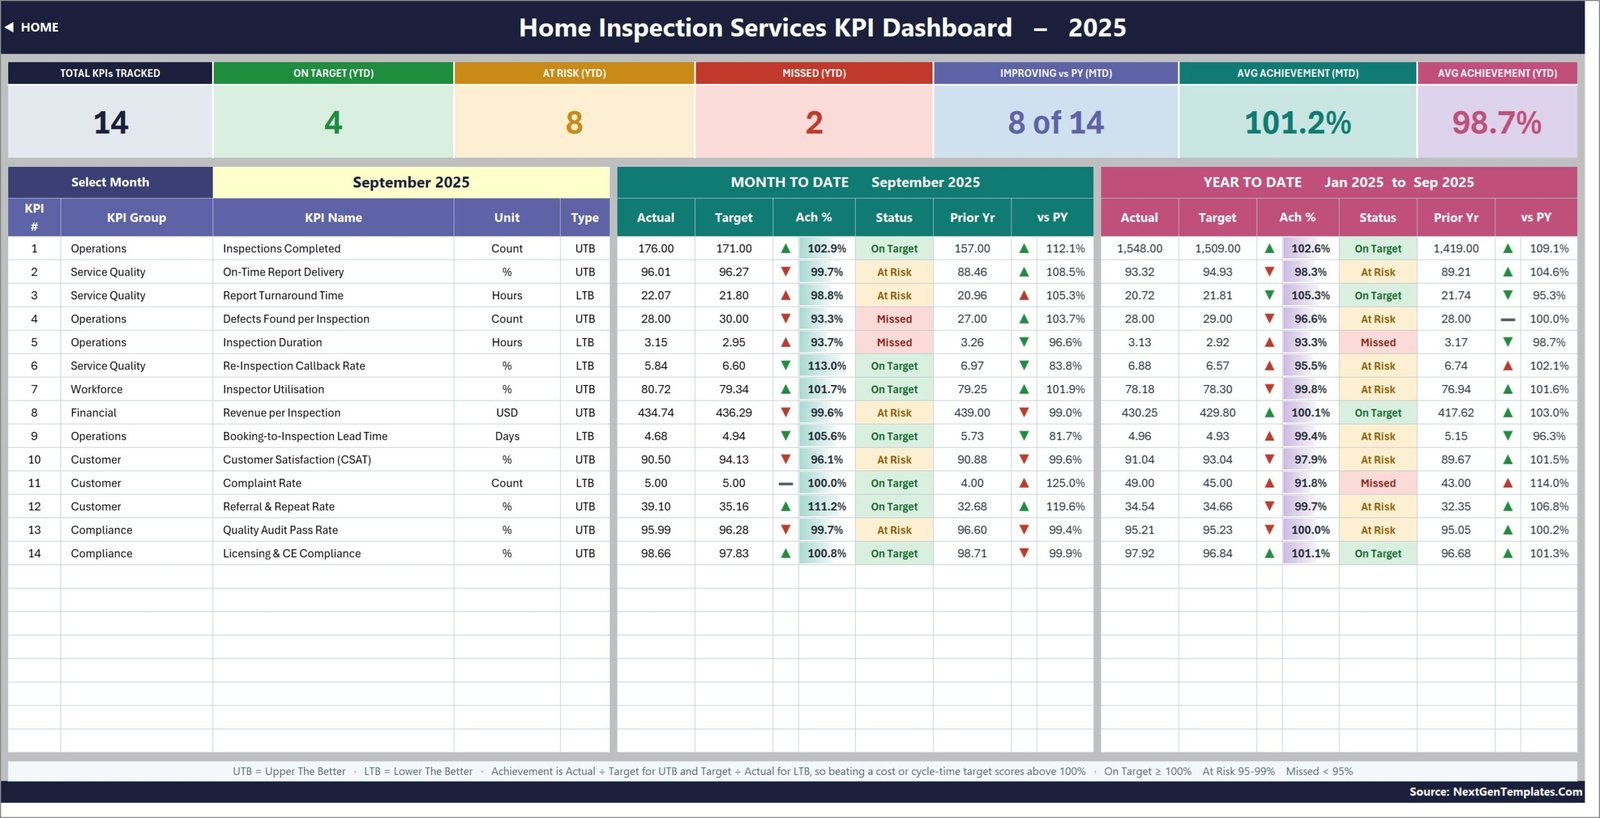
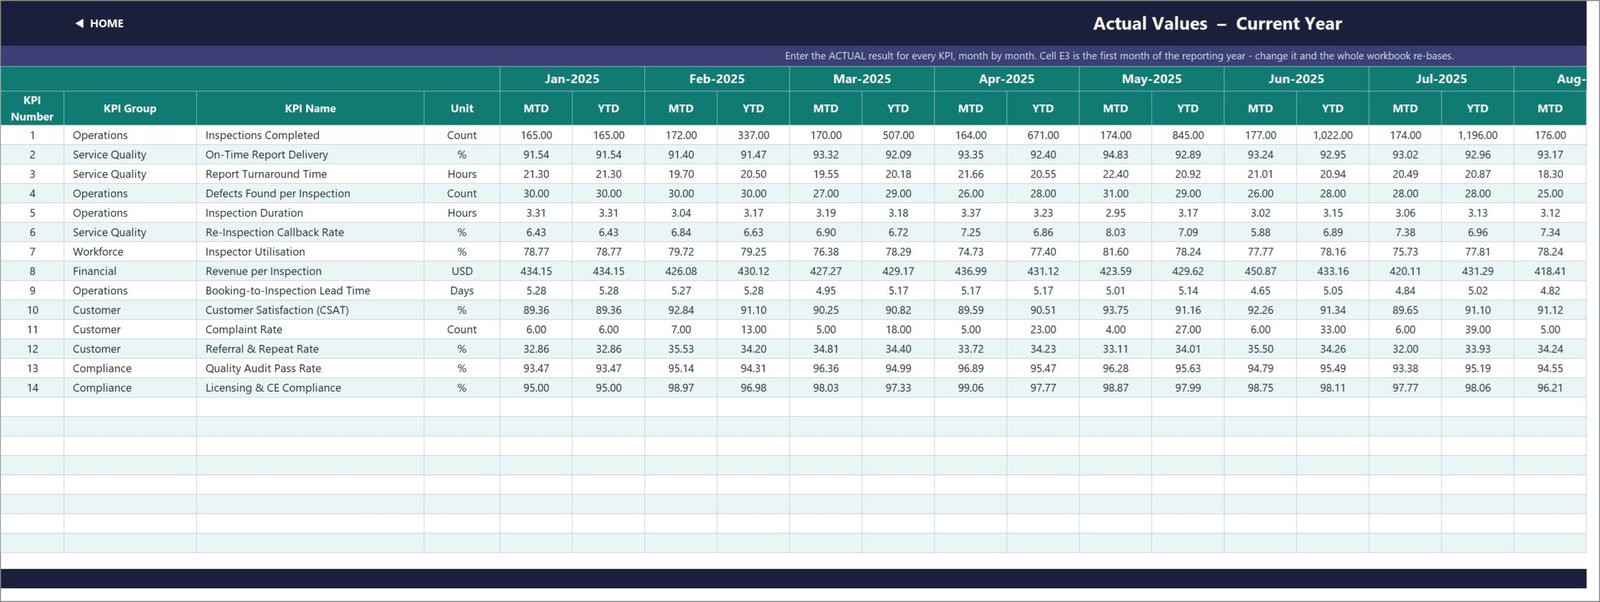
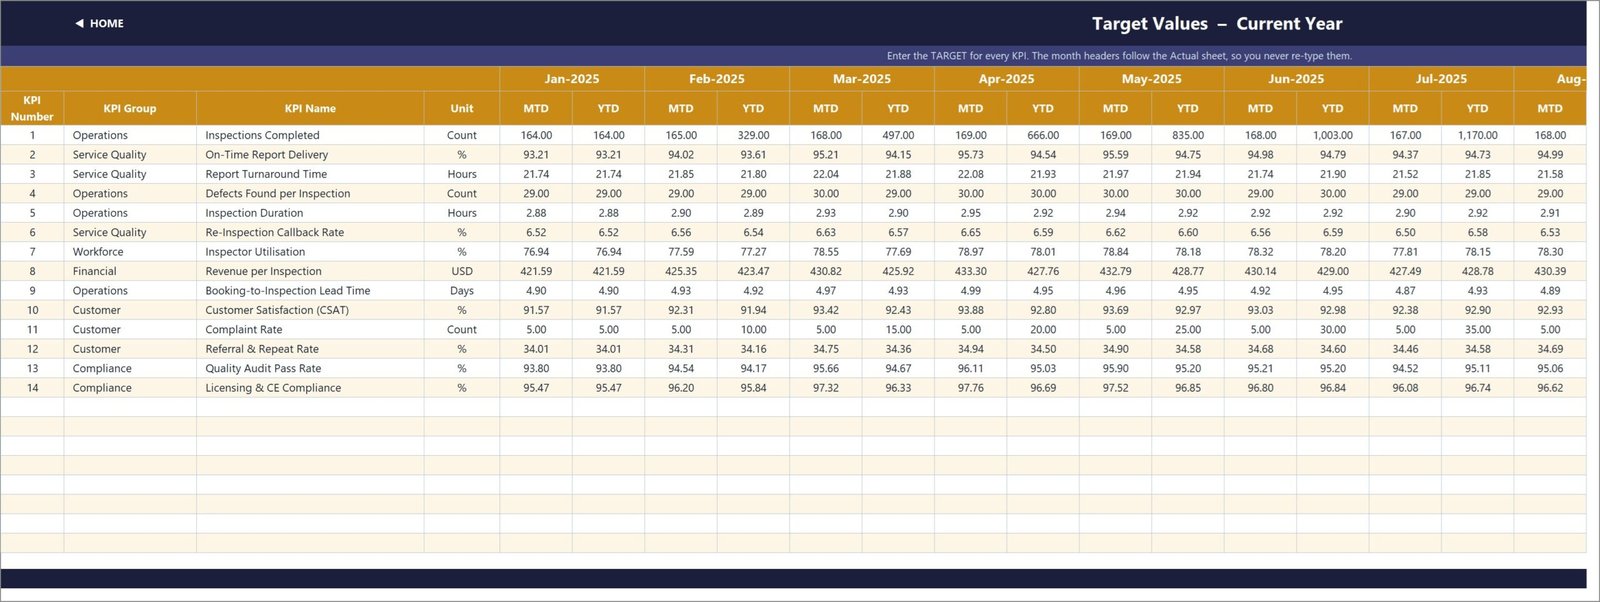
The main home inspection performance dashboard tracks Inspections Completed, On-Time Report Delivery, Report Turnaround Time, Defects Found per Inspection, Inspection Duration, Re-Inspection Callback Rate, Inspector Utilisation, Revenue per Inspection, Booking-to-Inspection Lead Time, Customer Satisfaction, Complaint Rate, Referral and Repeat Rate, Quality Audit Pass Rate, and Licensing and CE Compliance.
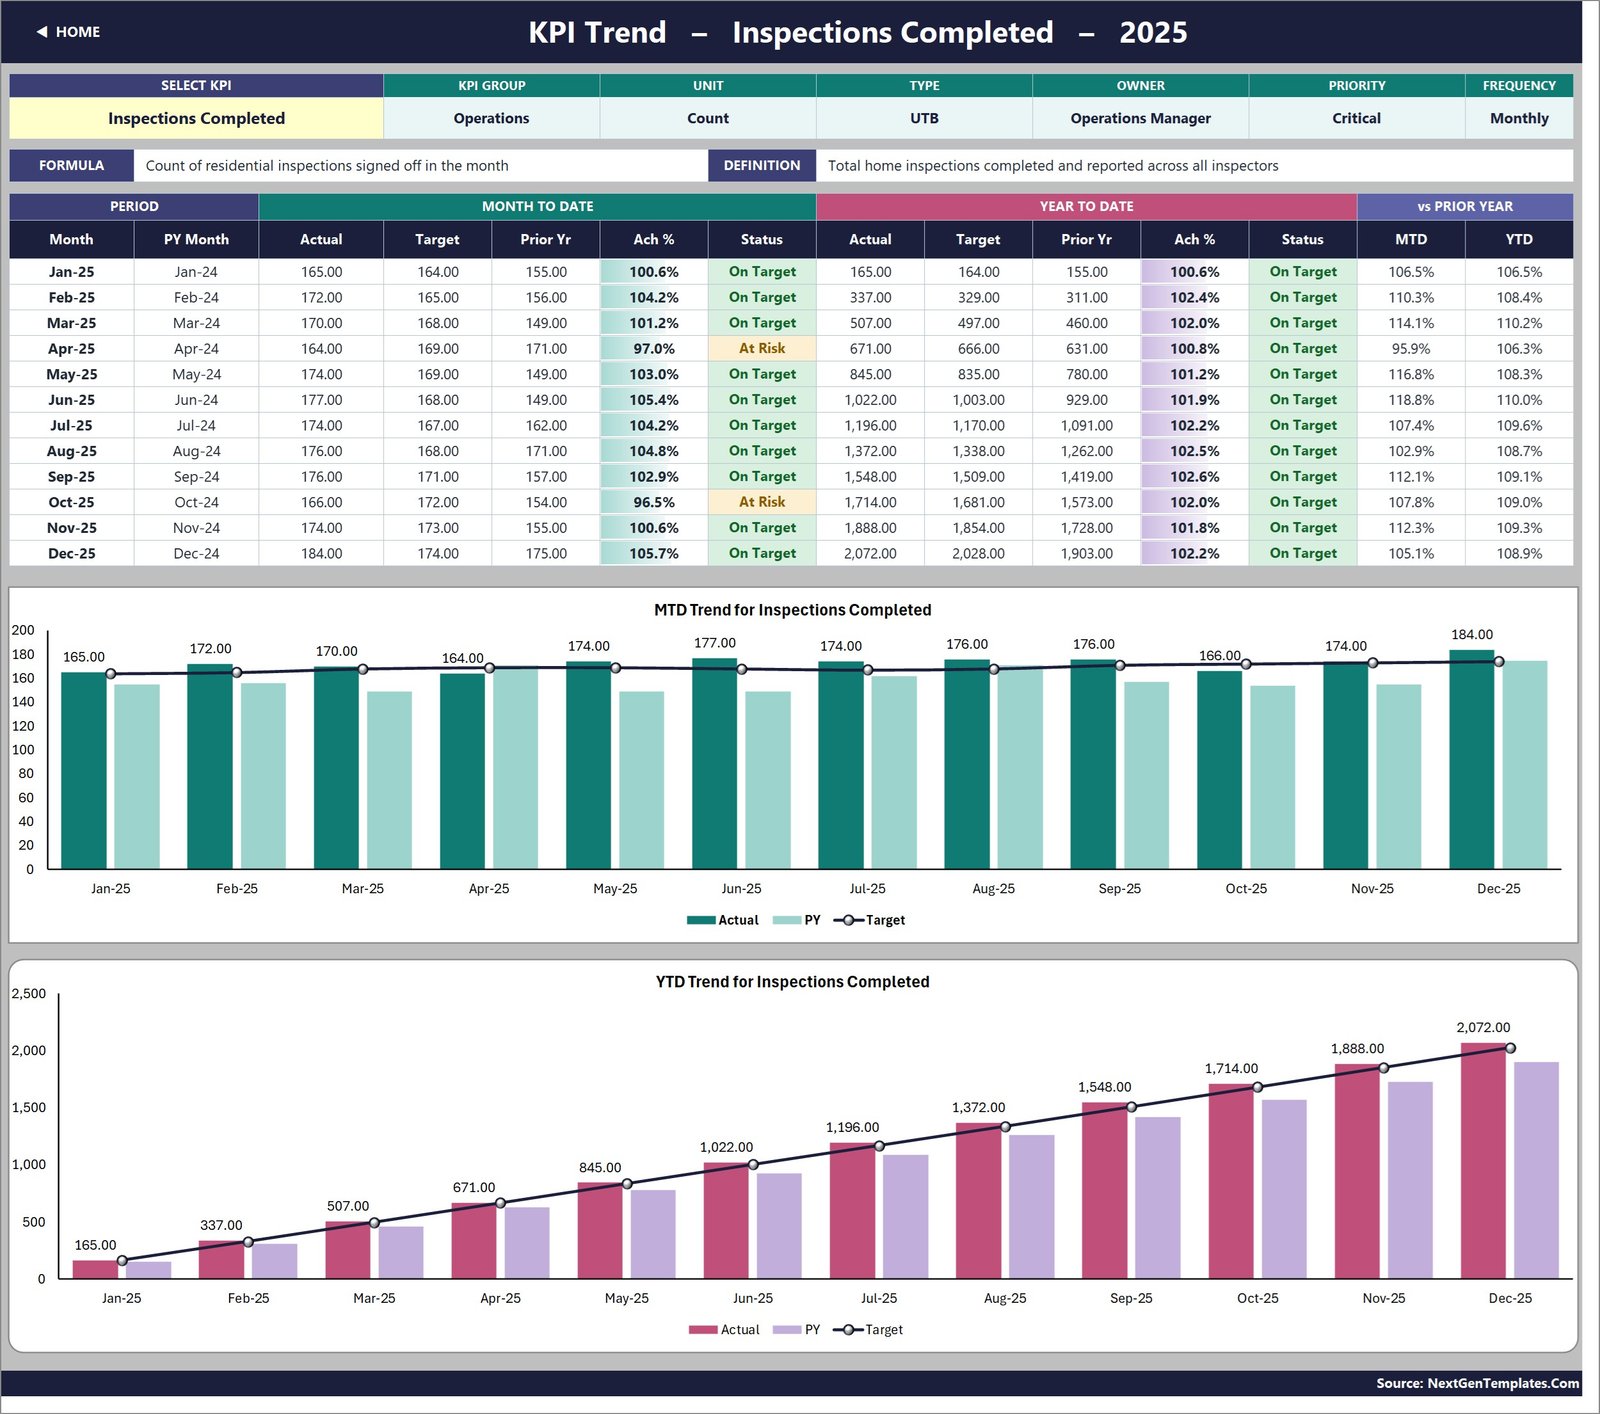
The KPI Trend sheet shows the chosen KPI’s group, unit, scoring type, owner, priority, frequency, formula, and definition alongside month-by-month MTD and YTD performance. The analysis page then rolls achievement up by group and ranks the strongest and weakest YTD results.
Home Inspection Services KPI Dashboard in Excel vs. Google Sheets vs. Paid SaaS – Where This Fits
| Area | This Excel template | Google Sheets alternative | Paid inspection SaaS |
|---|---|---|---|
| Cost | One-time $12.99 sale price | Tool cost plus build time | Recurring subscription |
| Platform | Microsoft Excel 2013 or later; also opens in Excel for the web | Browser spreadsheet | Vendor-hosted application |
| Setup | Replace sample inputs and select a month | Rebuild formulas, scoring, and charts | Configure users, workflows, and integrations |
| Collaboration | Best for an owner-controlled reporting file | Strong live co-editing | Usually multi-user |
| Custom KPI fields | Edit the master KPI definition table | Flexible if built correctly | Depends on plan and vendor |
| Year-1 cost at 5 users | $12.99 plus existing Excel access | Workspace fees plus setup labor | Potentially hundreds or thousands of dollars |
| Inspection workflow | KPI reporting only | KPI reporting if designed | May include scheduling, field reports, and CRM |
Who This Template Is For – and Who It’s Not For
This Excel KPI dashboard for home inspectors suits owner-operators, multi-inspector firms, operations managers, client-services leads, quality managers, and finance reviewers who already collect monthly figures and need a consistent management report.
It is not field inspection software, a property condition report, a scheduling system, a CRM, a licensing database, or a compliance certification tool. It does not collect inspection evidence or automate report delivery. Users enter their own monthly performance data.
How to Use the Home Inspection Services KPI Dashboard in Excel
- Download and unzip the customer package.
- Open the .xlsx workbook in Microsoft Excel.
- Review KPI Definition and adjust names, owners, priorities, or scoring directions where needed.
- Enter current-year actuals, targets, and prior-year values in the three input sheets.
- Select the reporting month on KPI Dashboard.
- Use KPI Trend for one-measure investigation and KPI Analysis for group and ranking reviews.
The included home inspection metrics template is wired for up to 22 KPI rows, with 14 example measures already filled. The Read Me sheet explains how to extend the ranges if you need more than 22.
Real-World Use Cases
Inspection company owner
Review whether volume, revenue per inspection, referrals, and customer satisfaction are improving while keeping complaint and callback rates under control.
Operations manager
Compare inspection throughput, duration, booking lead time, and inspector utilisation against targets for the selected month.
Quality and compliance lead
Monitor turnaround time, audit pass rate, licensing and continuing-education compliance, and re-inspection callbacks in one scorecard.
Frequently Asked Questions
Does this workbook use macros?
No. It uses ordinary worksheet formulas and does not require macros, Power Query, Power Pivot, or an add-in.
Can I rename the KPIs?
Yes. Edit the KPI Definition sheet; the input, dashboard, trend, and analysis sheets follow the master list.
How many KPIs are included?
Fourteen home inspection service KPIs are supplied with sample data, while the workbook layout supports up to 22 rows before range extension.
Does it replace home inspection software?
No. It is a management KPI dashboard for monthly user-entered figures, not a field inspection, scheduling, or report-authoring application.
What is in the download?
The ZIP contains the .xlsx workbook and an Excel KPI Dashboard user manual PDF.
Can I use lower-is-better metrics?
Yes. Set a KPI to LTB so beating a cost, duration, or complaint target produces the correct achievement result.
About the Author
Built by PK – Microsoft Certified Professional with 15+ years of Excel, Google Sheets, and Power BI experience. Founder of NextGenTemplates, reaching 300K+ subscribers across YouTube channels. Every template is hand-built and tested before release.
Explore Related Templates
Compare related service-business dashboards including the Home Renovation Contractor KPI Dashboard, Bathroom Remodeling KPI Dashboard, and Interior Fit-Out KPI Dashboard. You can also browse the full Excel KPI Dashboard collection.
Download the Home Inspection Services KPI Dashboard in Excel, replace the sample figures, and give monthly review meetings a consistent view of service delivery, customer experience, financial performance, and compliance.
Last updated: September 16, 2026.




























Reviews
There are no reviews yet.