

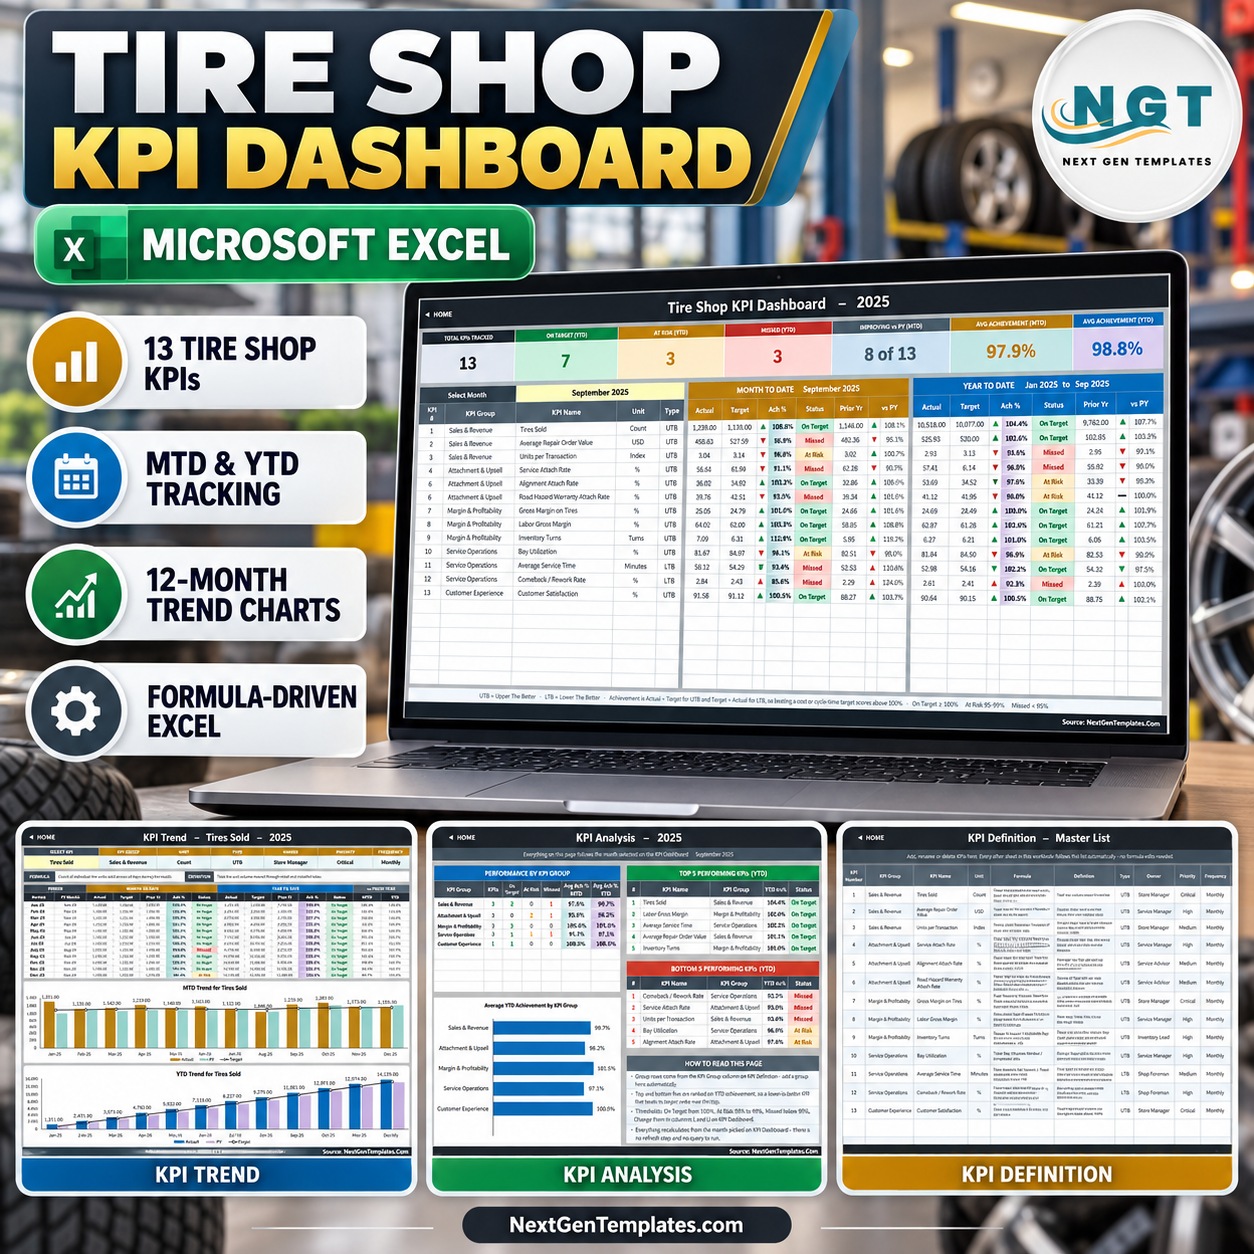
The Tire Shop KPI Dashboard in Excel tracks 13 tire-shop KPIs across 5 KPI groups, on 11 worksheets, with a single month dropdown that redraws every MTD and YTD figure on the page. Every number is a plain worksheet formula – VLOOKUP, MATCH, INDEX and COUNTIF – so there is no Power Query, no data model, no macro and no add-in to enable. The sheets are already wired for 22 KPI rows, so you can add nine more KPIs without writing a single formula.
🌎 Join 8,400+ teams in 40+ countries using NextGenTemplates to replace paid SaaS tools with one-time-purchase Excel, Google Sheets, Power BI and HTML templates.
✅ Instant download · One-time payment · No subscription · No per-user fees · Lifetime access
This is a reporting workbook for a tire and service shop: tires sold, attach rates, bay utilisation, margin and comebacks, read month by month against target and against last year. It ships with fictional sample data for a 2025 reporting year so you can see every formula working before you type anything of your own.
🔑 Key Features of the Tire Shop KPI Dashboard in Excel
📊 13 tire-shop KPIs in 5 groups. Sales & Revenue (Tires Sold, Average Repair Order Value, Units per Transaction), Attachment & Upsell (Service Attach Rate, Alignment Attach Rate, Road Hazard Warranty Attach Rate), Margin & Profitability (Gross Margin on Tires, Labor Gross Margin, Inventory Turns), Service Operations (Bay Utilization, Average Service Time, Comeback / Rework Rate) and Customer Experience (Customer Satisfaction).
📅 One month dropdown drives the whole workbook. Cell D6 on the KPI Dashboard sheet is a list of the twelve months of the reporting year. Pick September and the seven summary cards, all 13 KPI rows, both MTD and YTD blocks and the entire KPI Analysis page recalculate. There is no refresh button and no query to run.
🎯 Direction-aware achievement. Each KPI is flagged UTB (Upper The Better) or LTB (Lower The Better) in column G of KPI Definition. Achievement is Actual ÷ Target for a UTB KPI and Target ÷ Actual for an LTB one, so beating an Average Service Time or Comeback / Rework Rate target scores above 100% instead of looking like a miss.
🟢 Traffic lights you control. Status is On Target from 100%, At Risk from 95% to 99% and Missed below 95%. The thresholds live in the formulas in columns L and U on KPI Dashboard, so you can move them to match your own governance in seconds.
📈 Twelve-month trend for any KPI. The KPI Trend sheet takes one KPI at a time from a dropdown in cell B4 and redraws its attribute strip, its twelve-month table and two combo charts – actual and prior-year columns with a target line across both.
📝 Add or rename a KPI without touching a formula. Type a new KPI on the KPI Definition sheet and the three input sheets, the dashboard, the trend page and the analysis page all pick it up. Clear a row and the summary cards recount themselves.
📦 What Is Inside the Tire Shop KPI Dashboard in Excel
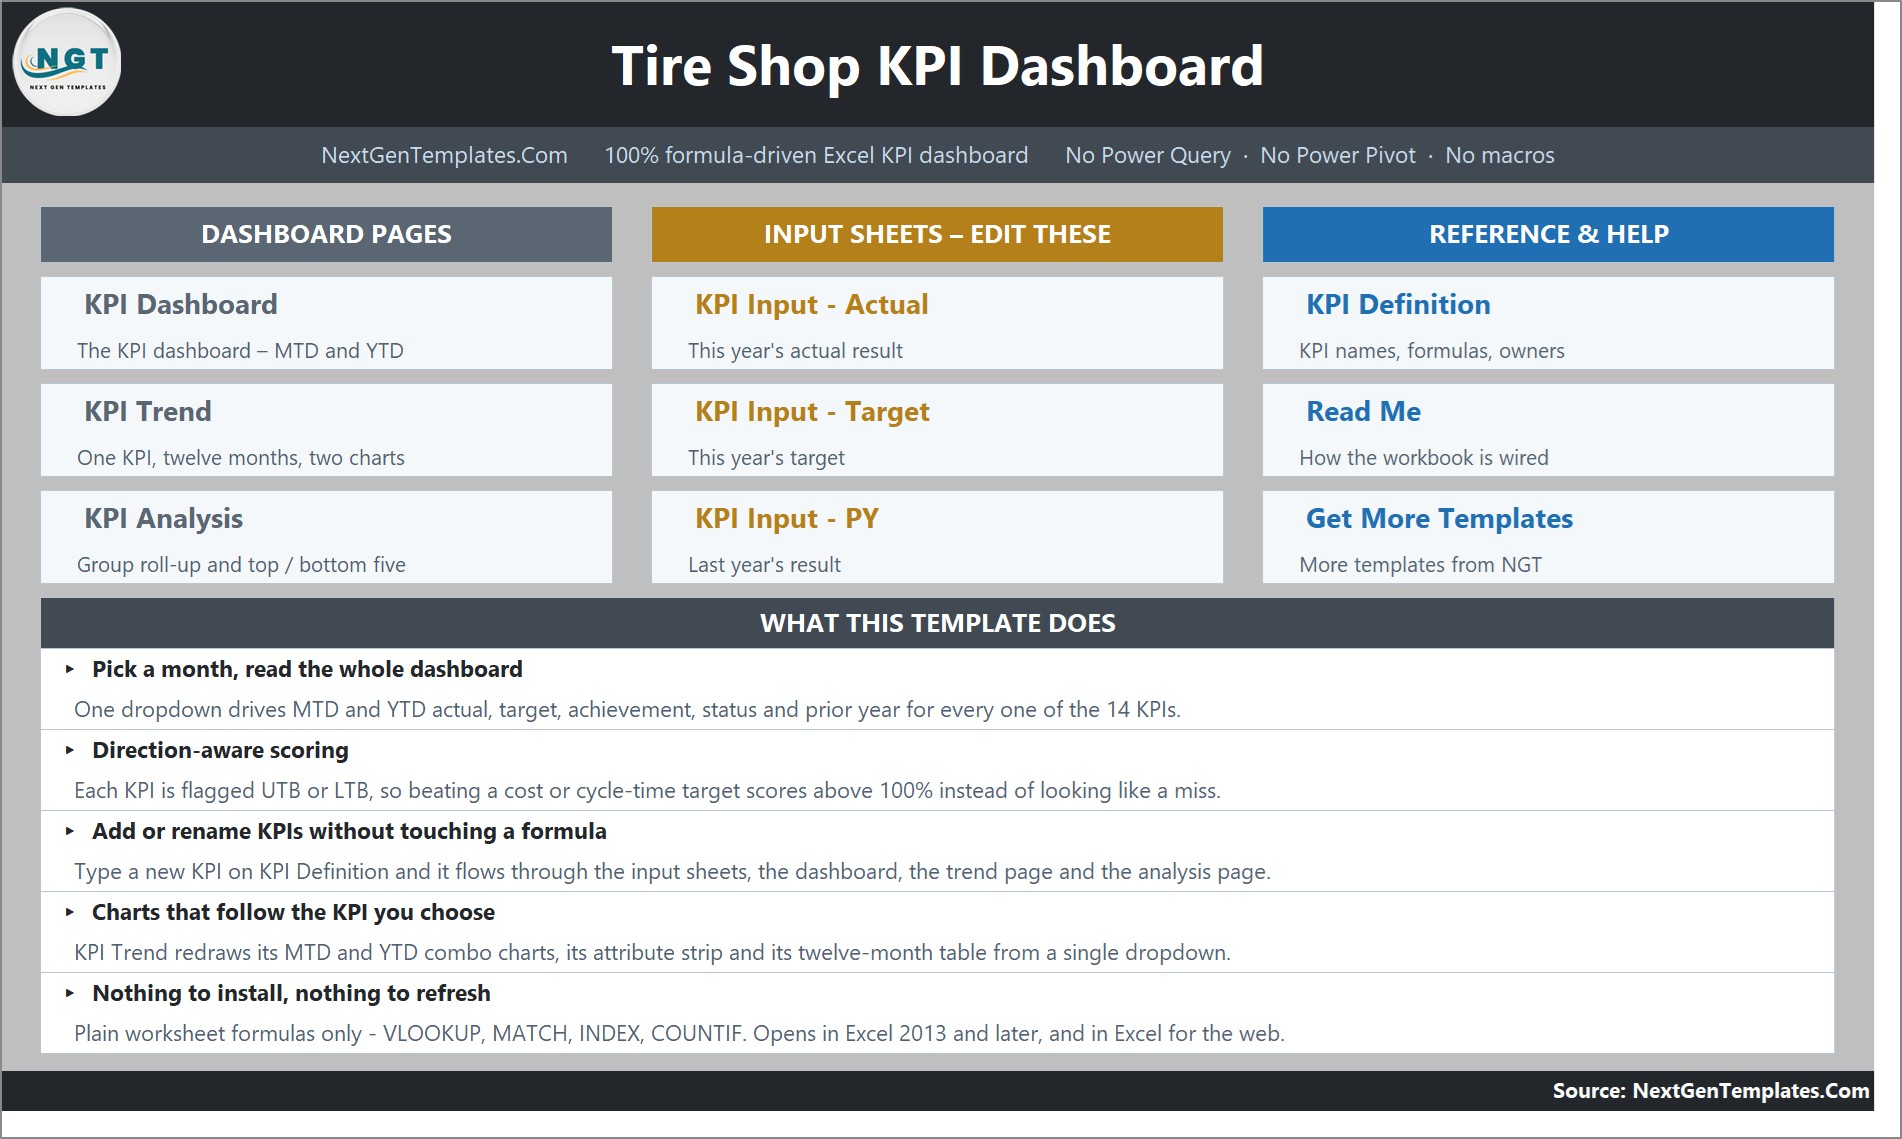
Page 1: Home
The navigation page. Three grouped panels – Dashboard Pages, Input Sheets and Reference & Help – link straight to every sheet, and a “What This Template Does” panel summarises the month picker, the direction-aware scoring, the KPI-driven layout and the fact that nothing needs installing or refreshing.
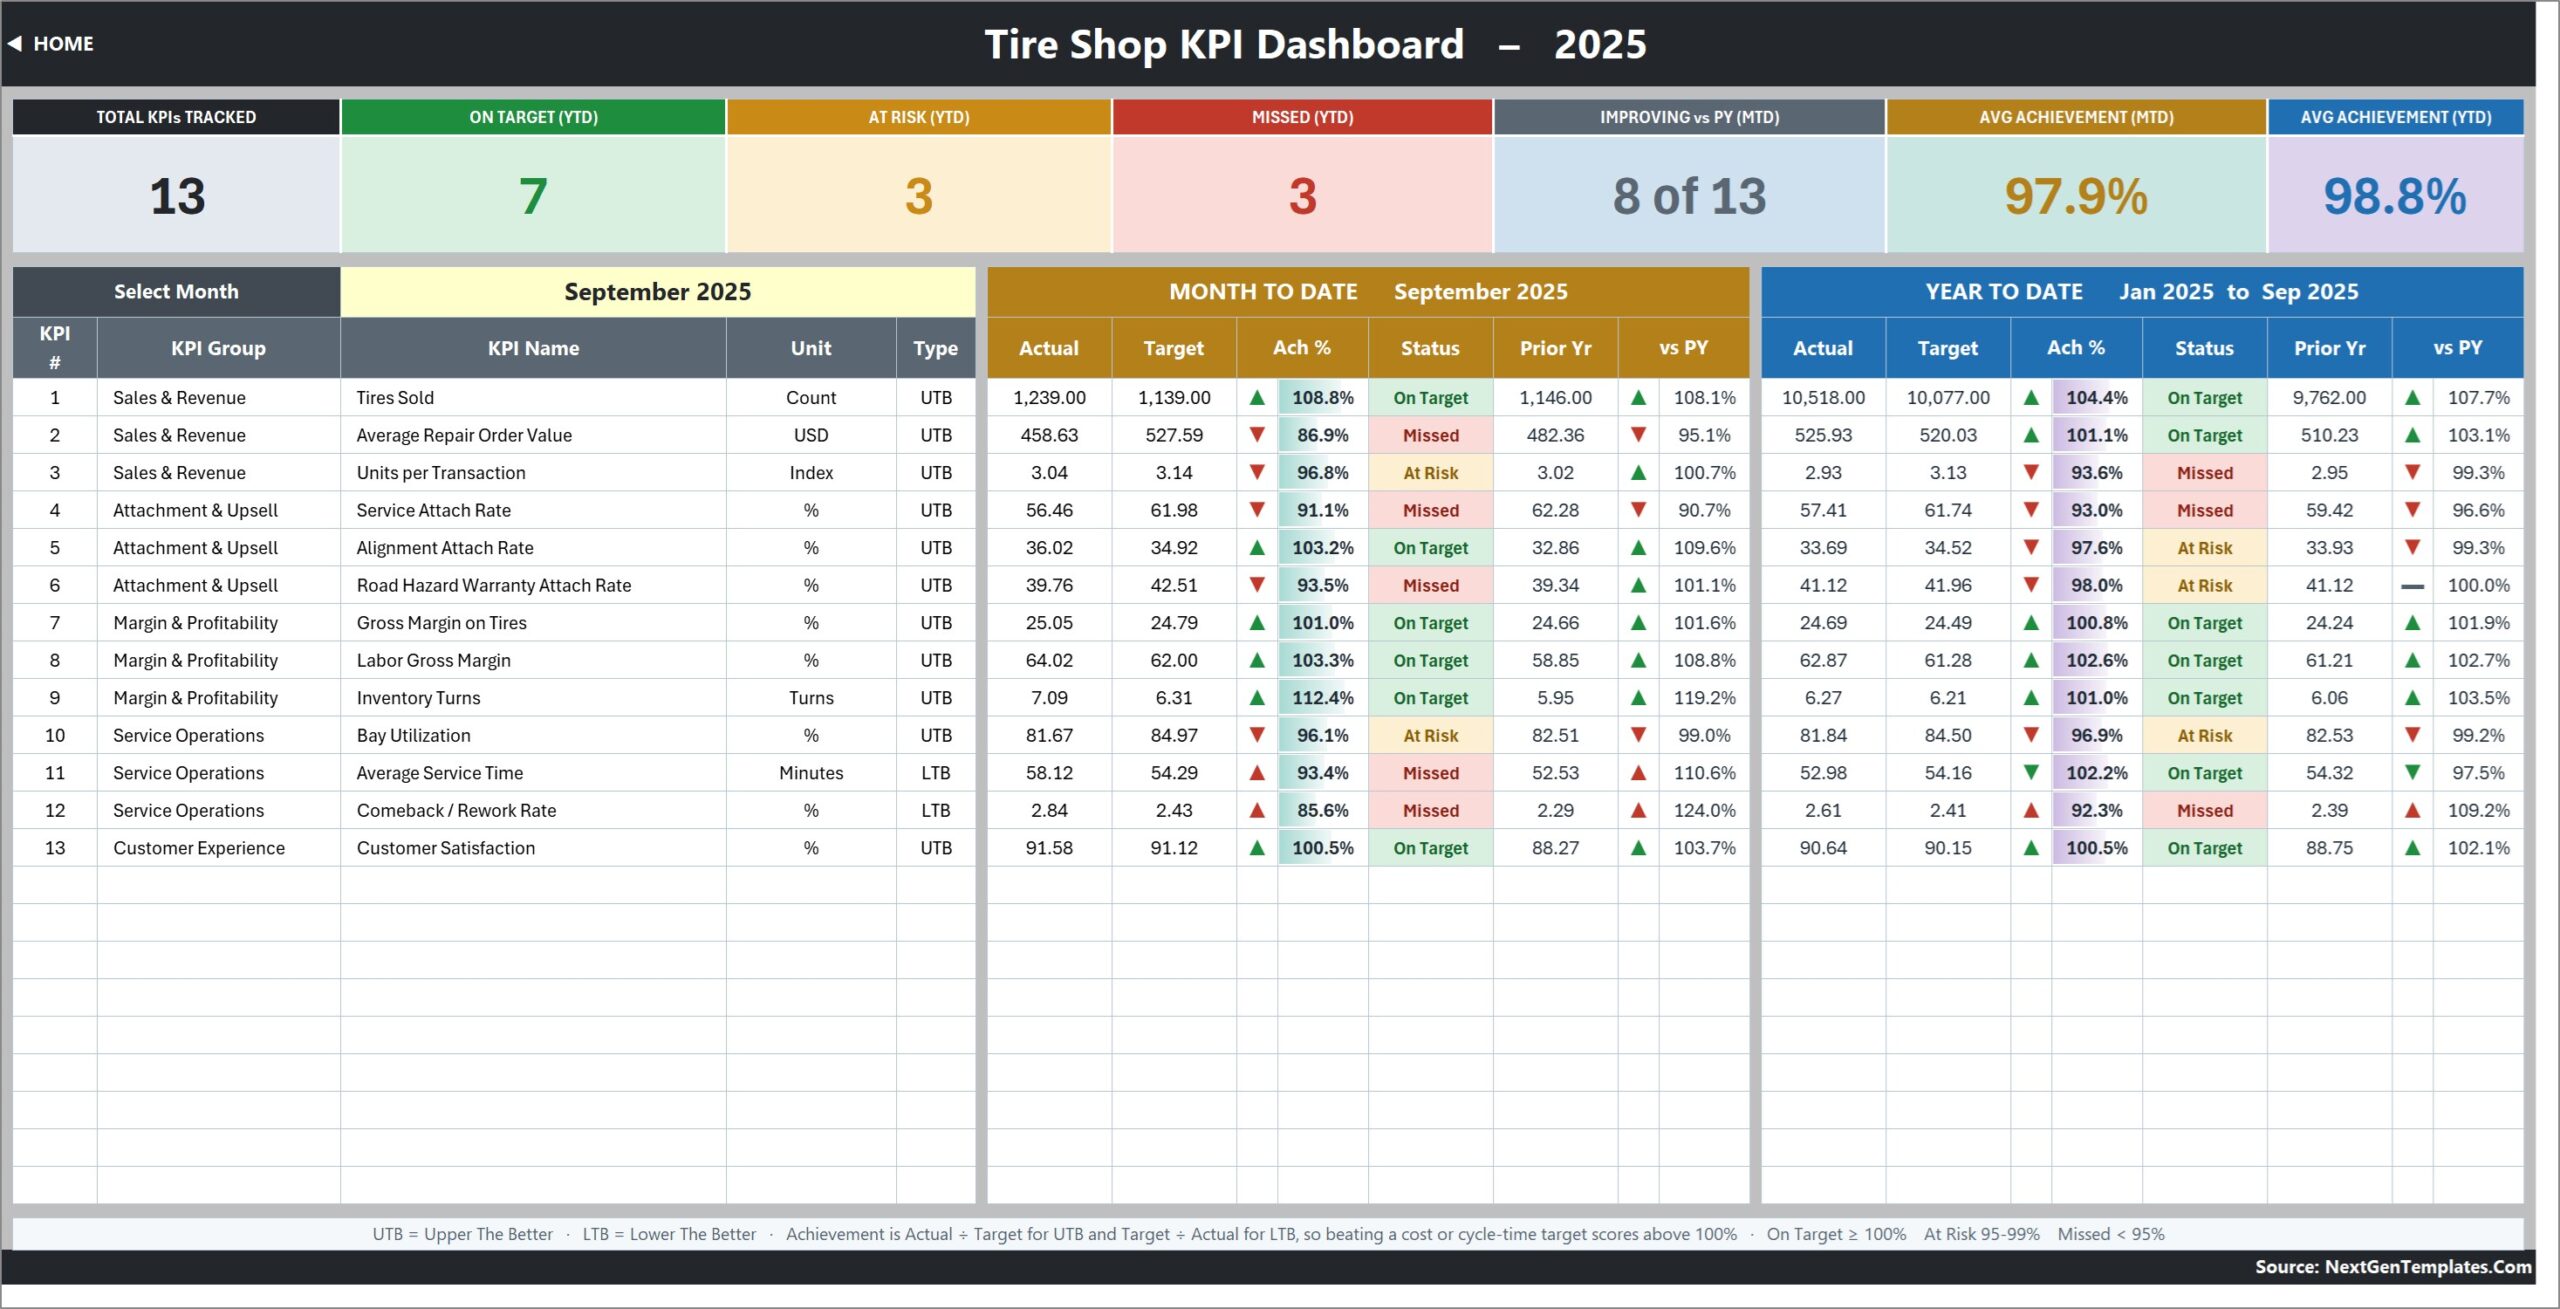
Page 2: KPI Dashboard
The main scorecard. Seven summary cards across the top – Total KPIs Tracked, On Target (YTD), At Risk (YTD), Missed (YTD), Improving vs PY (MTD), Avg Achievement (MTD) and Avg Achievement (YTD) – sit above a month selector and one row per KPI. Each row carries a Month To Date block and a Year To Date block with Actual, Target, Achievement %, Status, Prior Year and a vs PY movement.
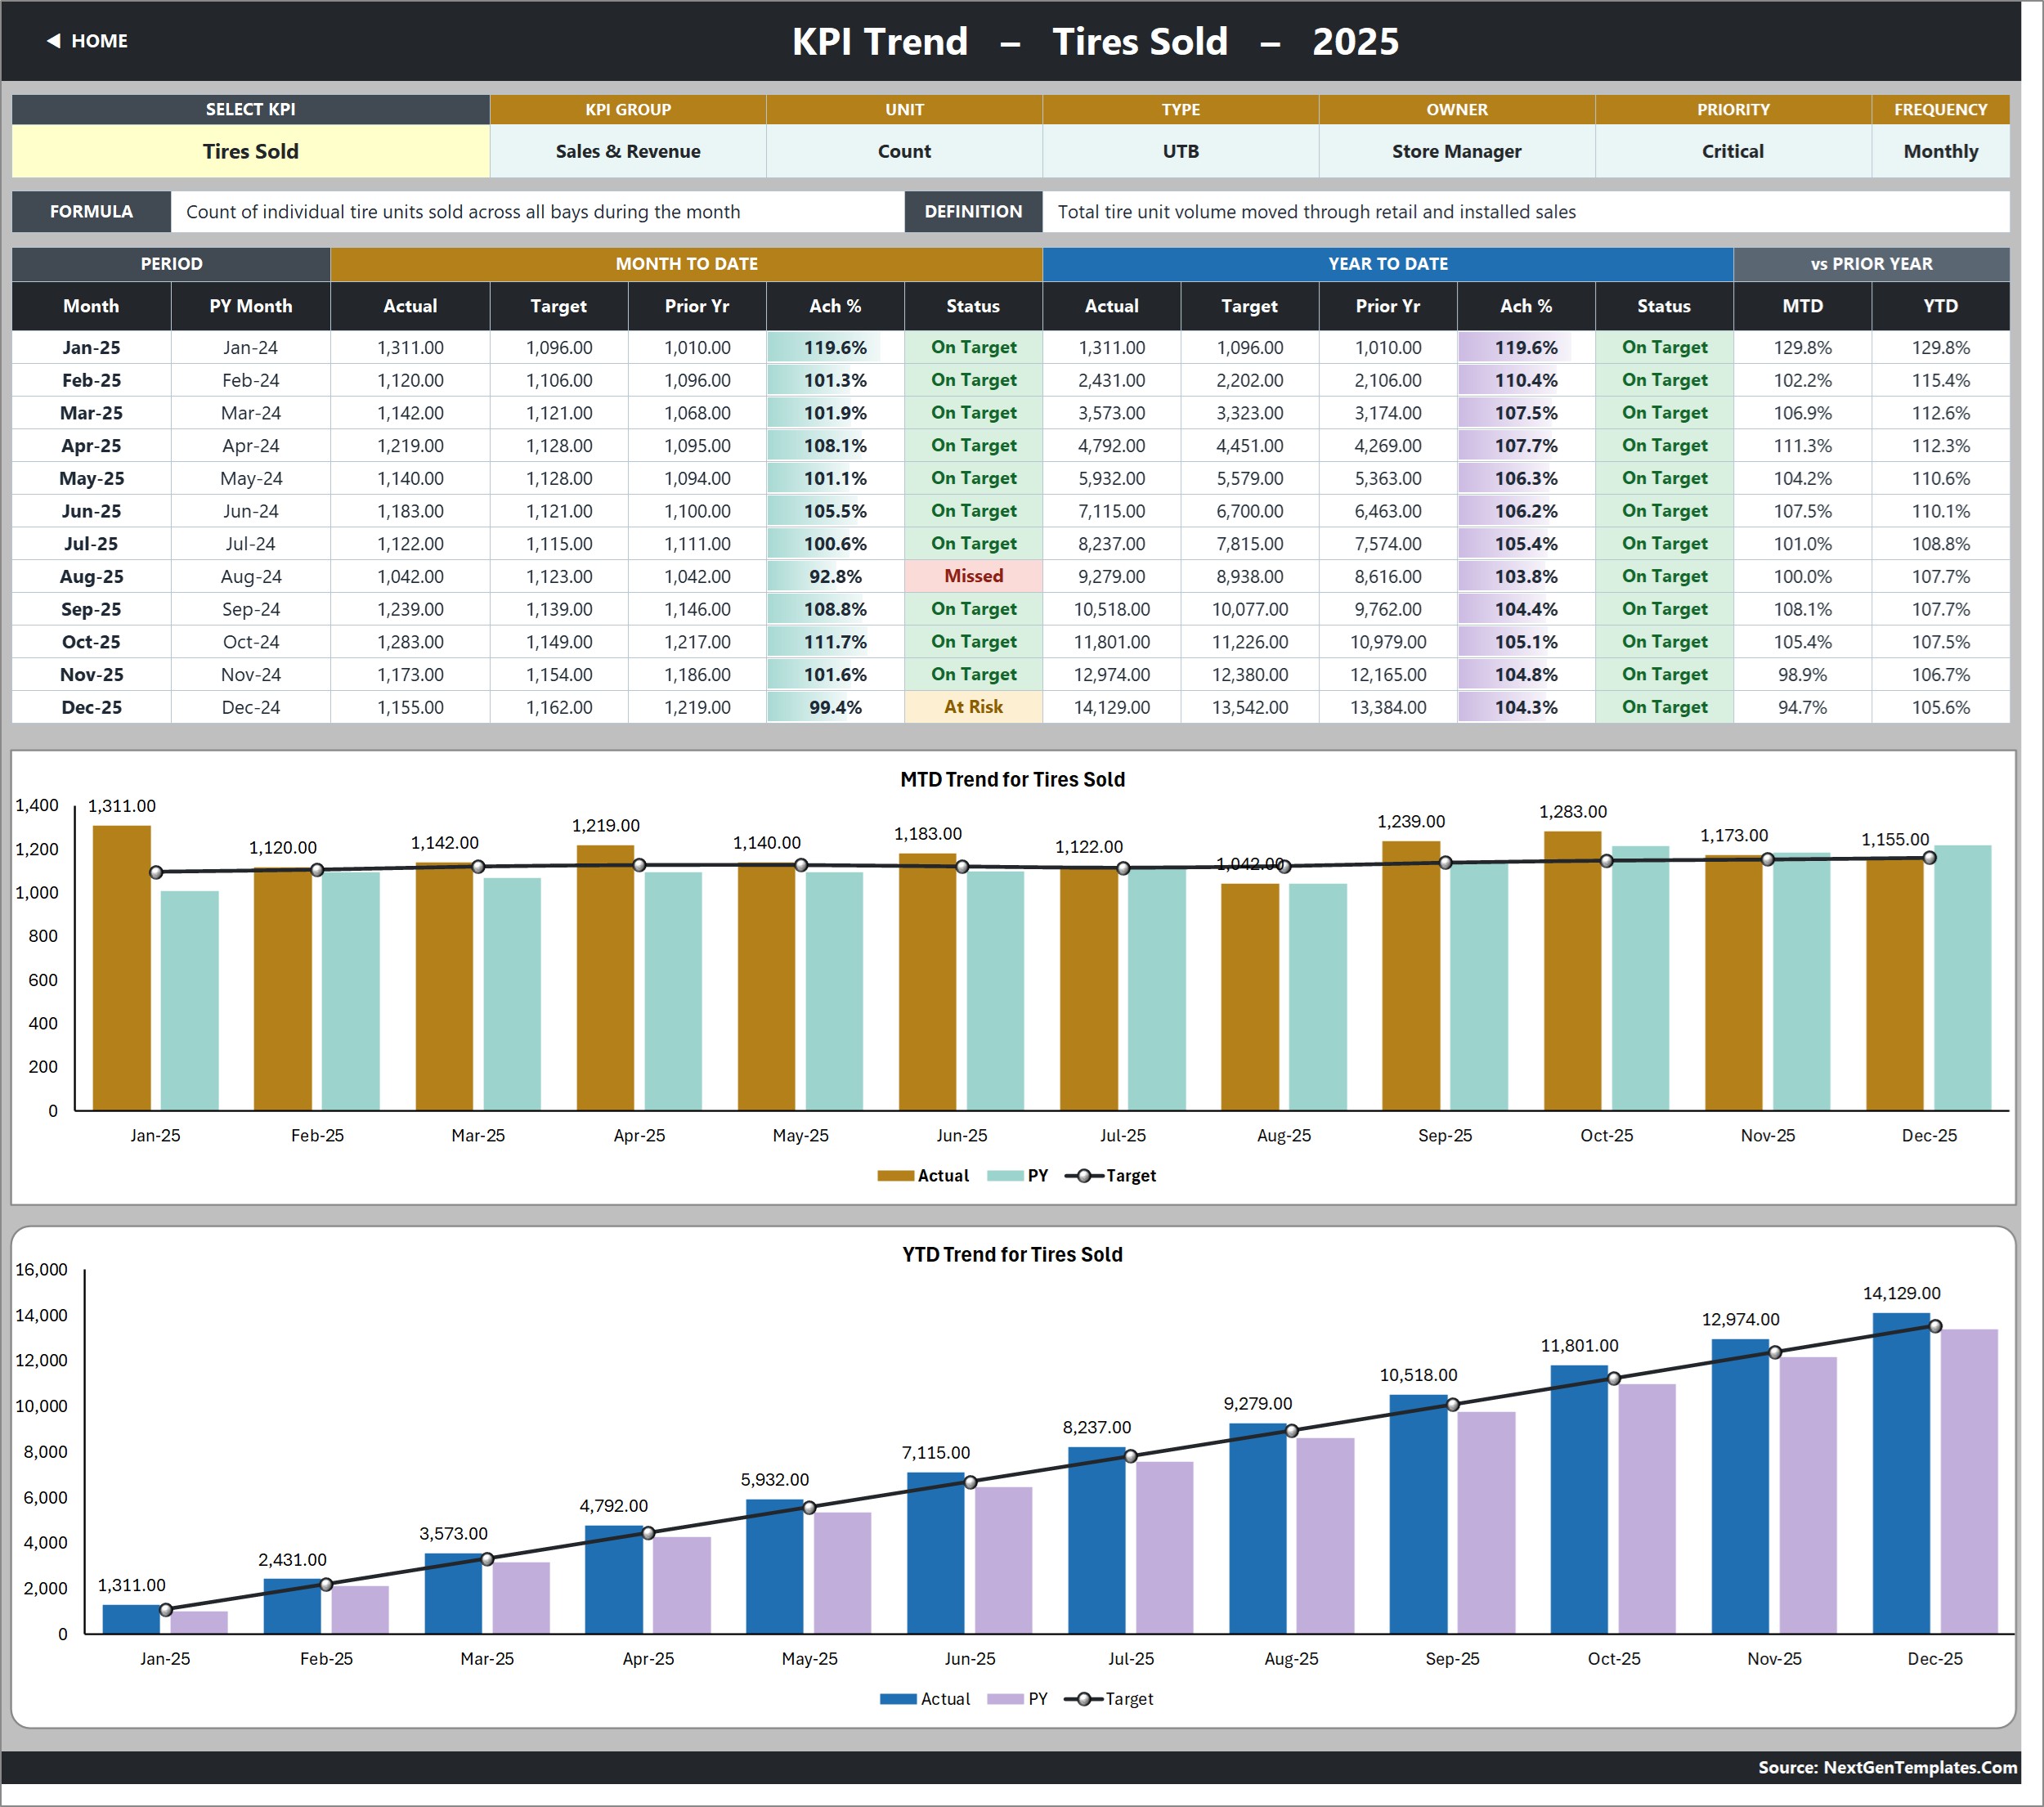
Page 3: KPI Trend
One KPI, twelve months. The attribute strip shows KPI Group, Unit, Type, Owner, Priority and Frequency plus the KPI formula and definition, followed by a month-by-month table and two charts: MTD Trend for Tires Sold and YTD Trend for Tires Sold, each plotting actual and prior-year columns against a target line.
Page 4: KPI Analysis
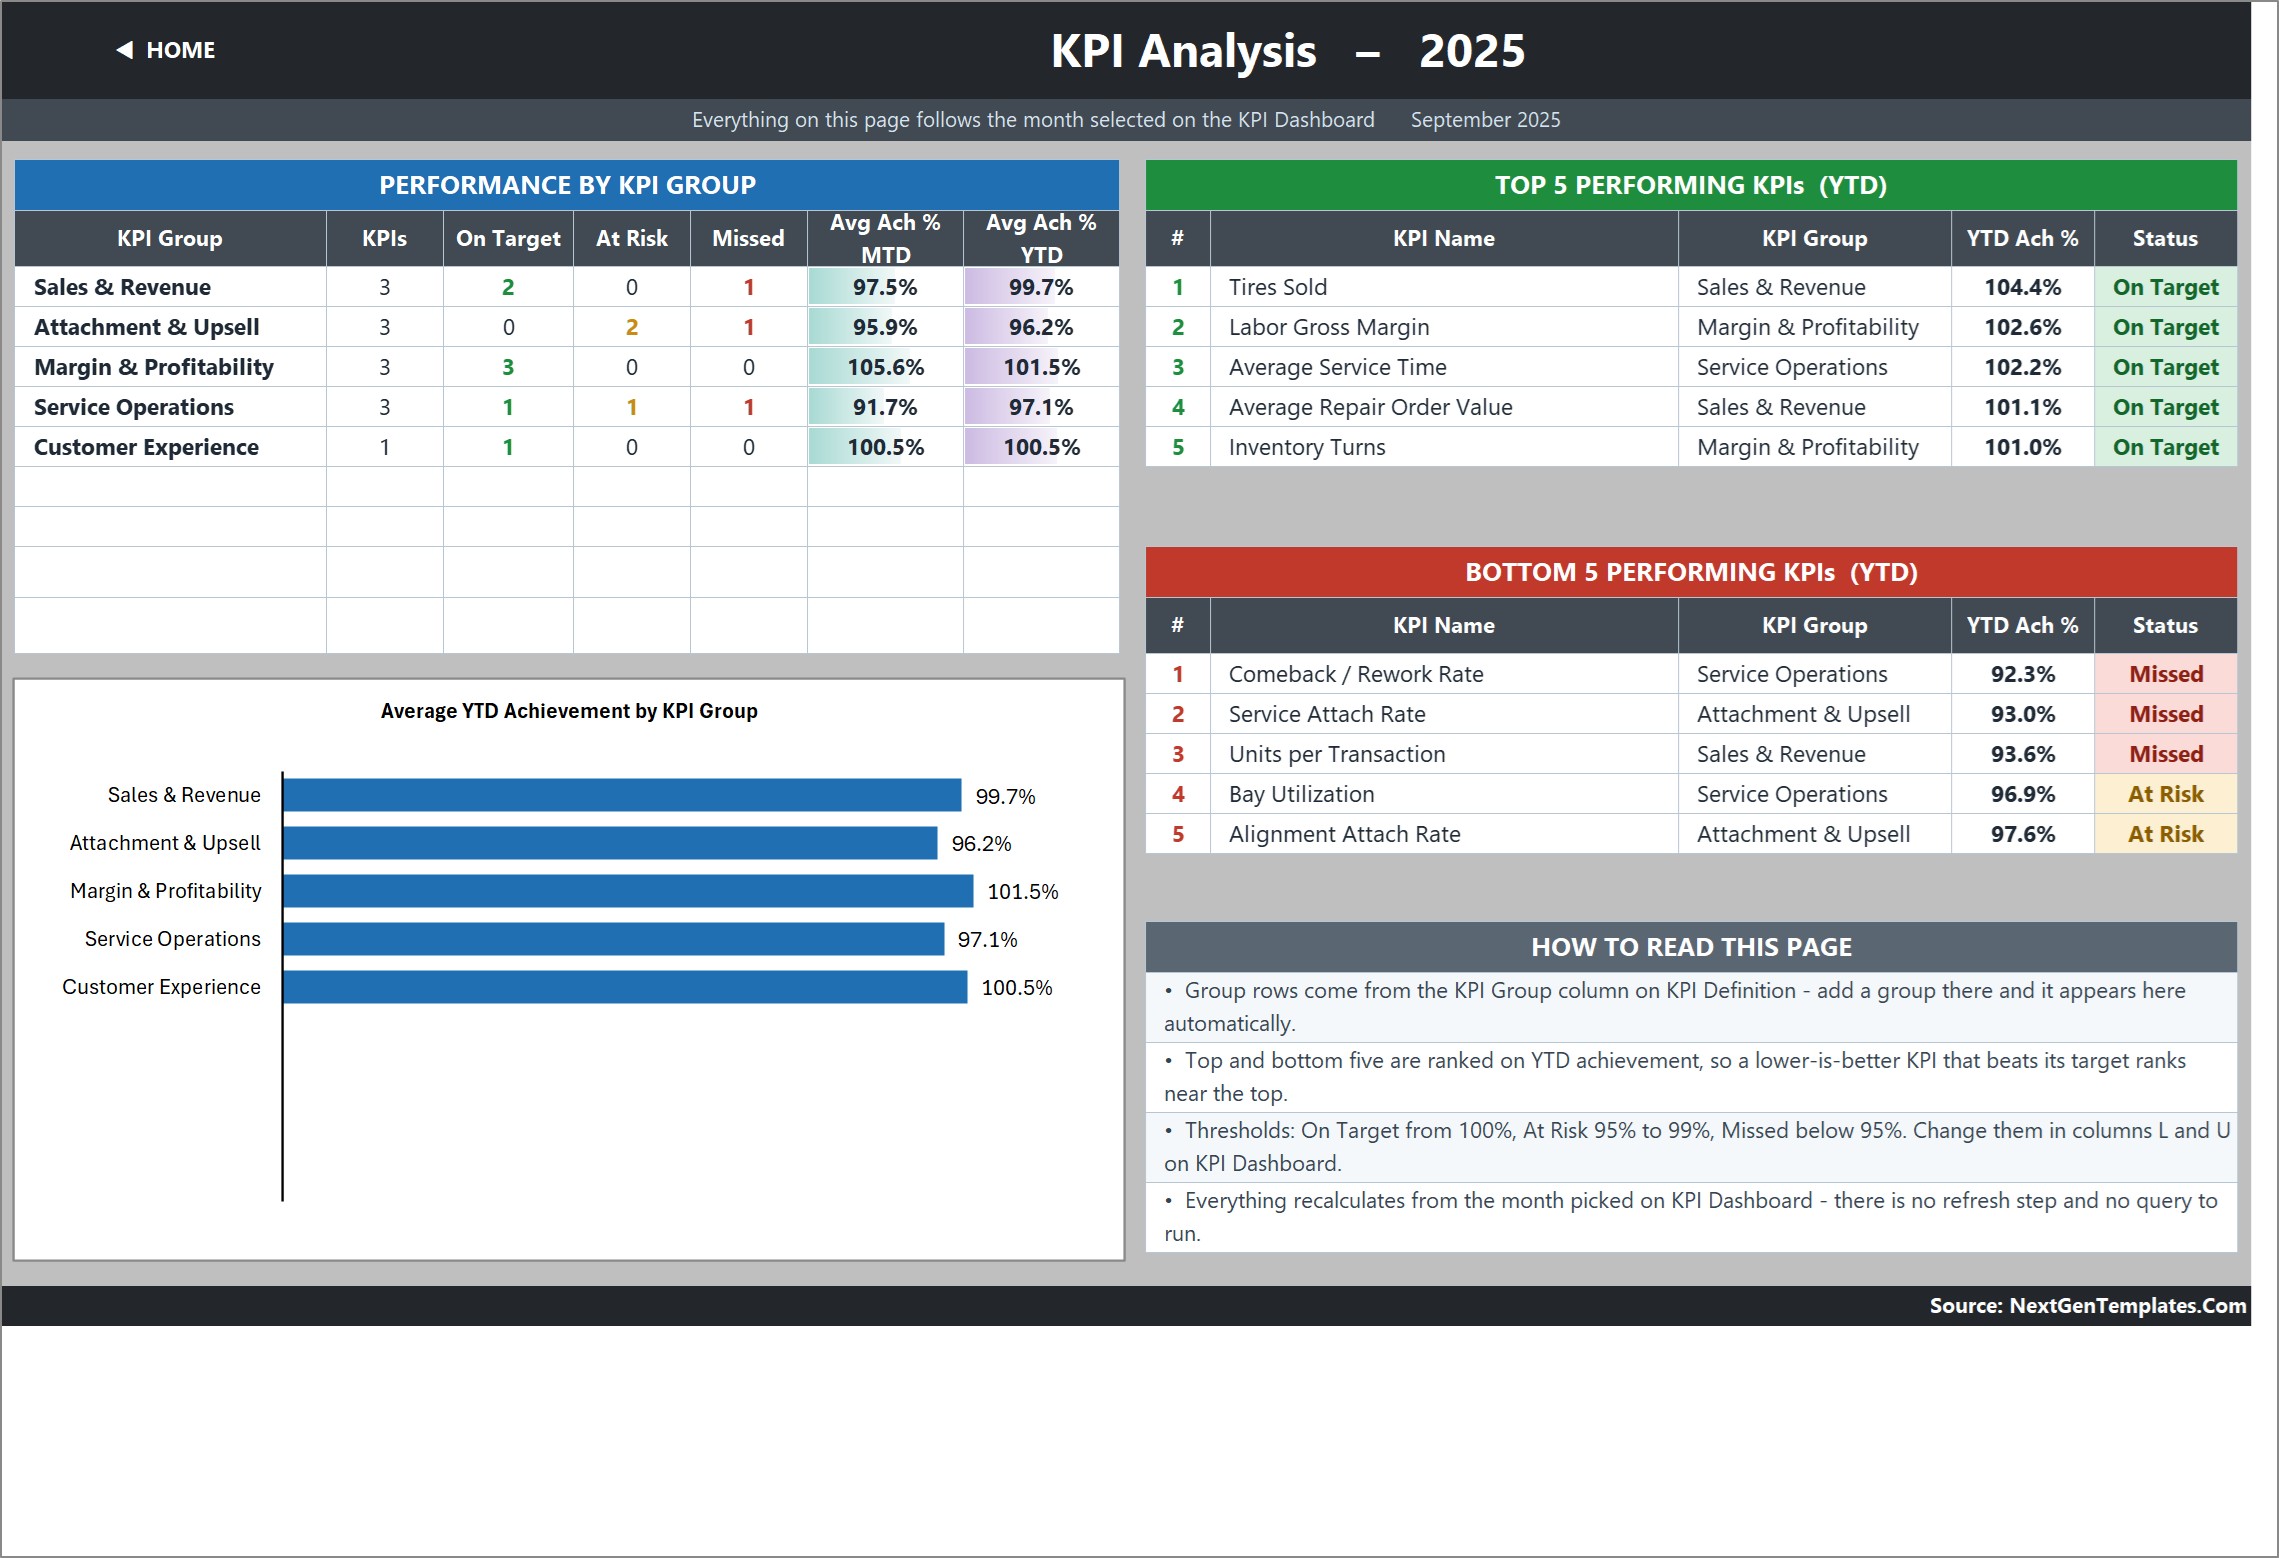
The roll-up. A Performance by KPI Group table counts On Target, At Risk and Missed KPIs per group with average MTD and YTD achievement, an Average YTD Achievement by KPI Group chart ranks the five groups, and Top 5 and Bottom 5 Performing KPIs (YTD) tables name the winners and the problems. A How To Read This Page panel explains the thresholds.
Page 5: KPI Input – Actual
Your first data sheet. Enter the actual result for every KPI, month by month, with an MTD and a YTD column per month. Cell E3 is the first month of the reporting year – change it and the Target sheet, the Prior Year sheet, the month dropdown and every sheet title re-base automatically.

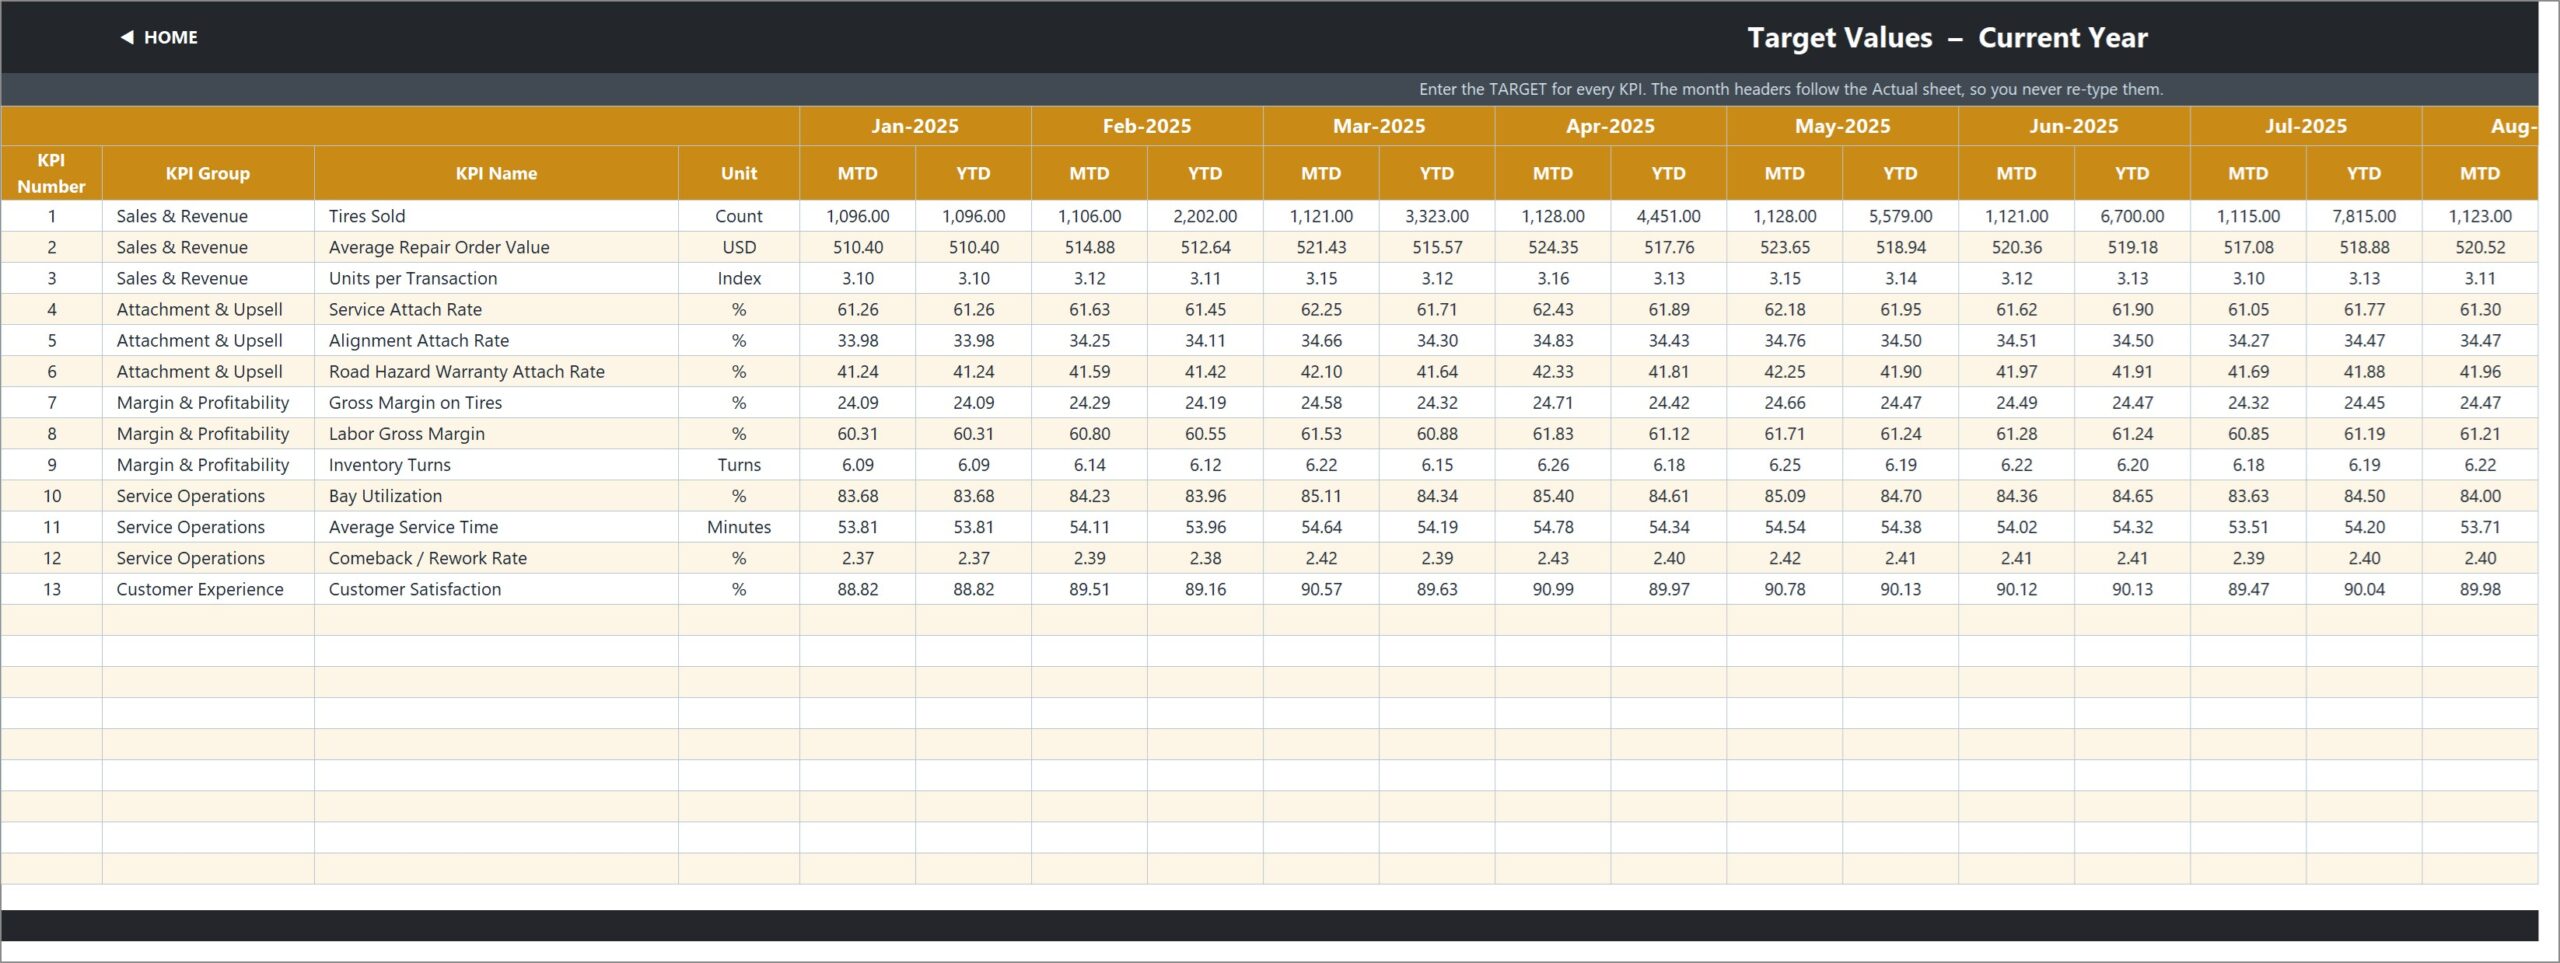
Page 6: KPI Input – Target
The target sheet, laid out identically to the actual sheet. The month headers follow the Actual sheet, so you never re-type them, and the KPI rows are driven by KPI Definition so the two sheets always line up.
Page 7: KPI Input – PY
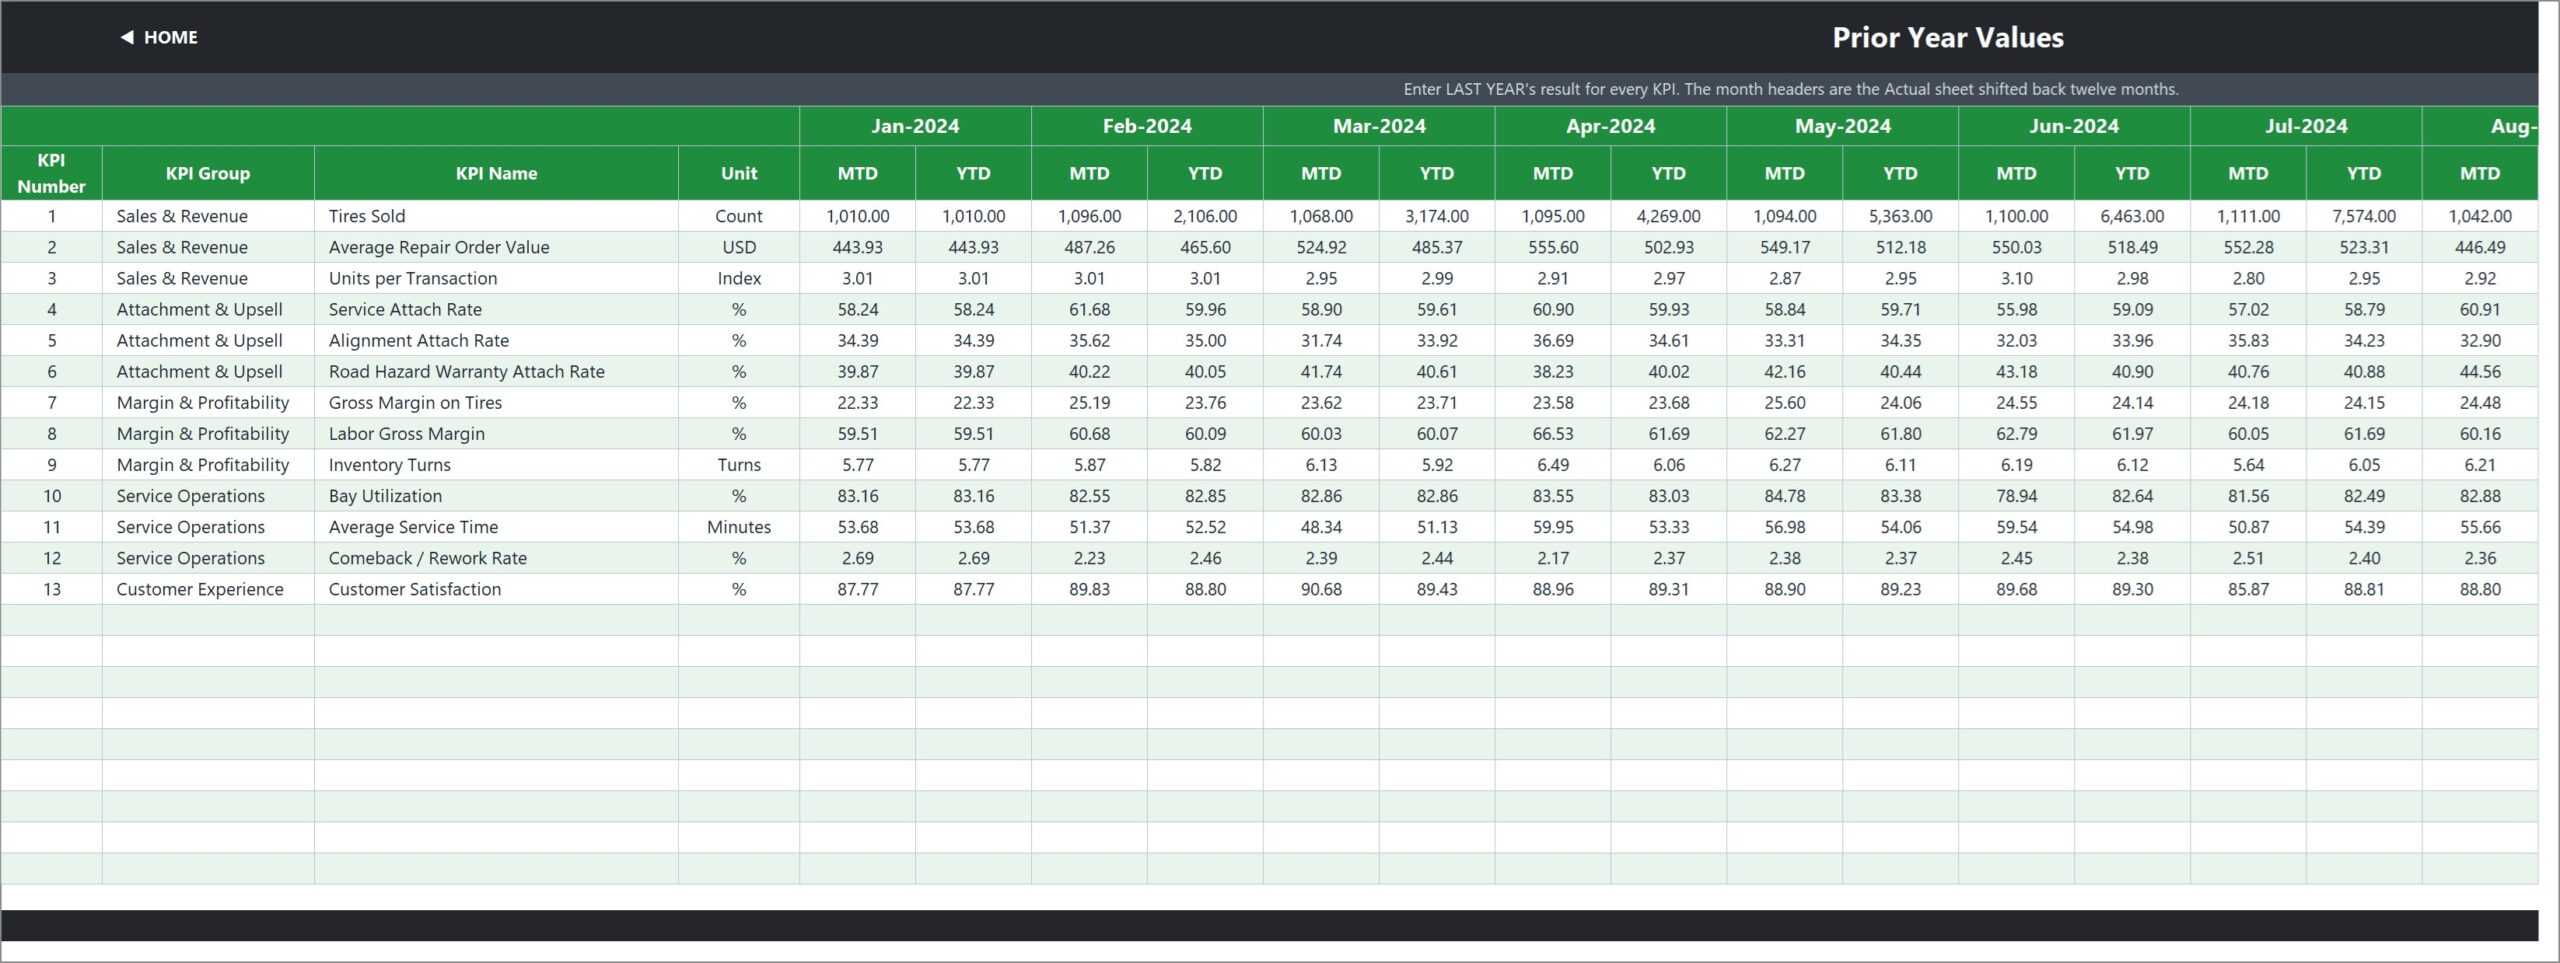
Last year’s result for every KPI. The month headers are the Actual sheet shifted back twelve months, which is what feeds the Prior Yr and vs PY columns on the dashboard and the prior-year series on both trend charts.
Page 8: KPI Definition
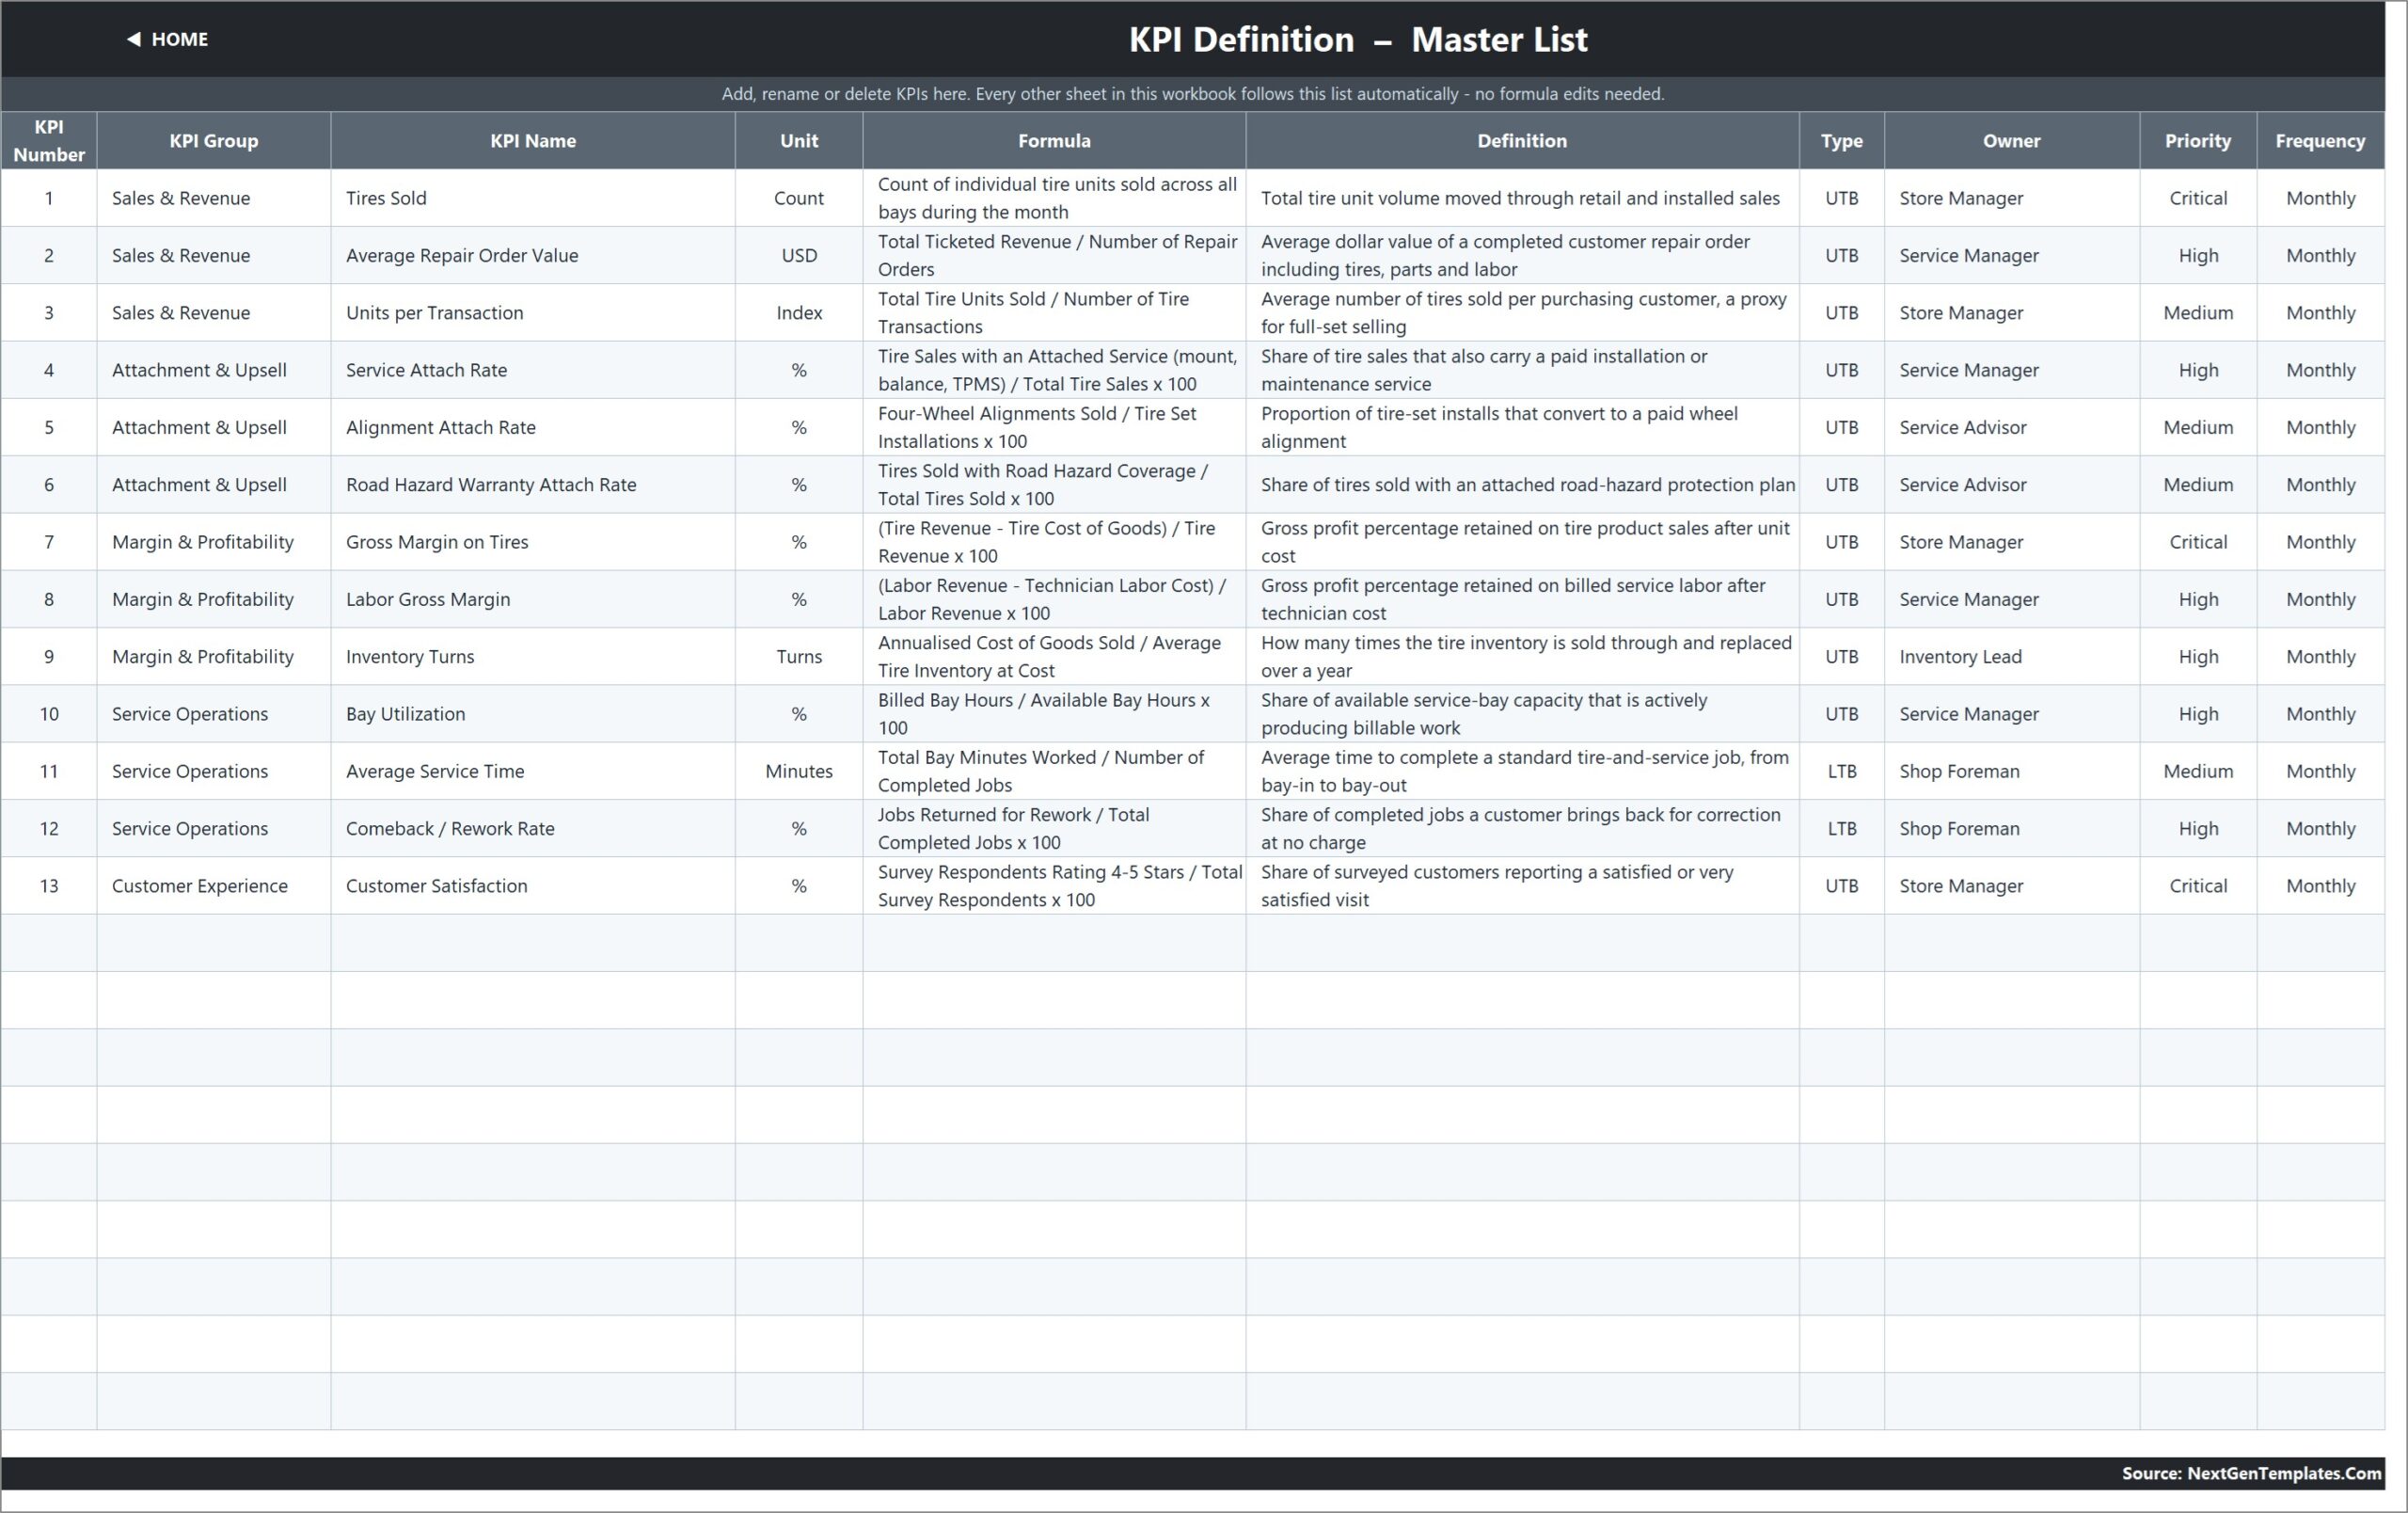
The master KPI list and the sheet that drives everything else. Ten columns per KPI: KPI Number, KPI Group, KPI Name, Unit, Formula, Definition, Type (UTB or LTB), Owner, Priority and Frequency. Owners in the sample data run from Store Manager and Service Manager to Service Advisor, Inventory Lead and Shop Foreman.
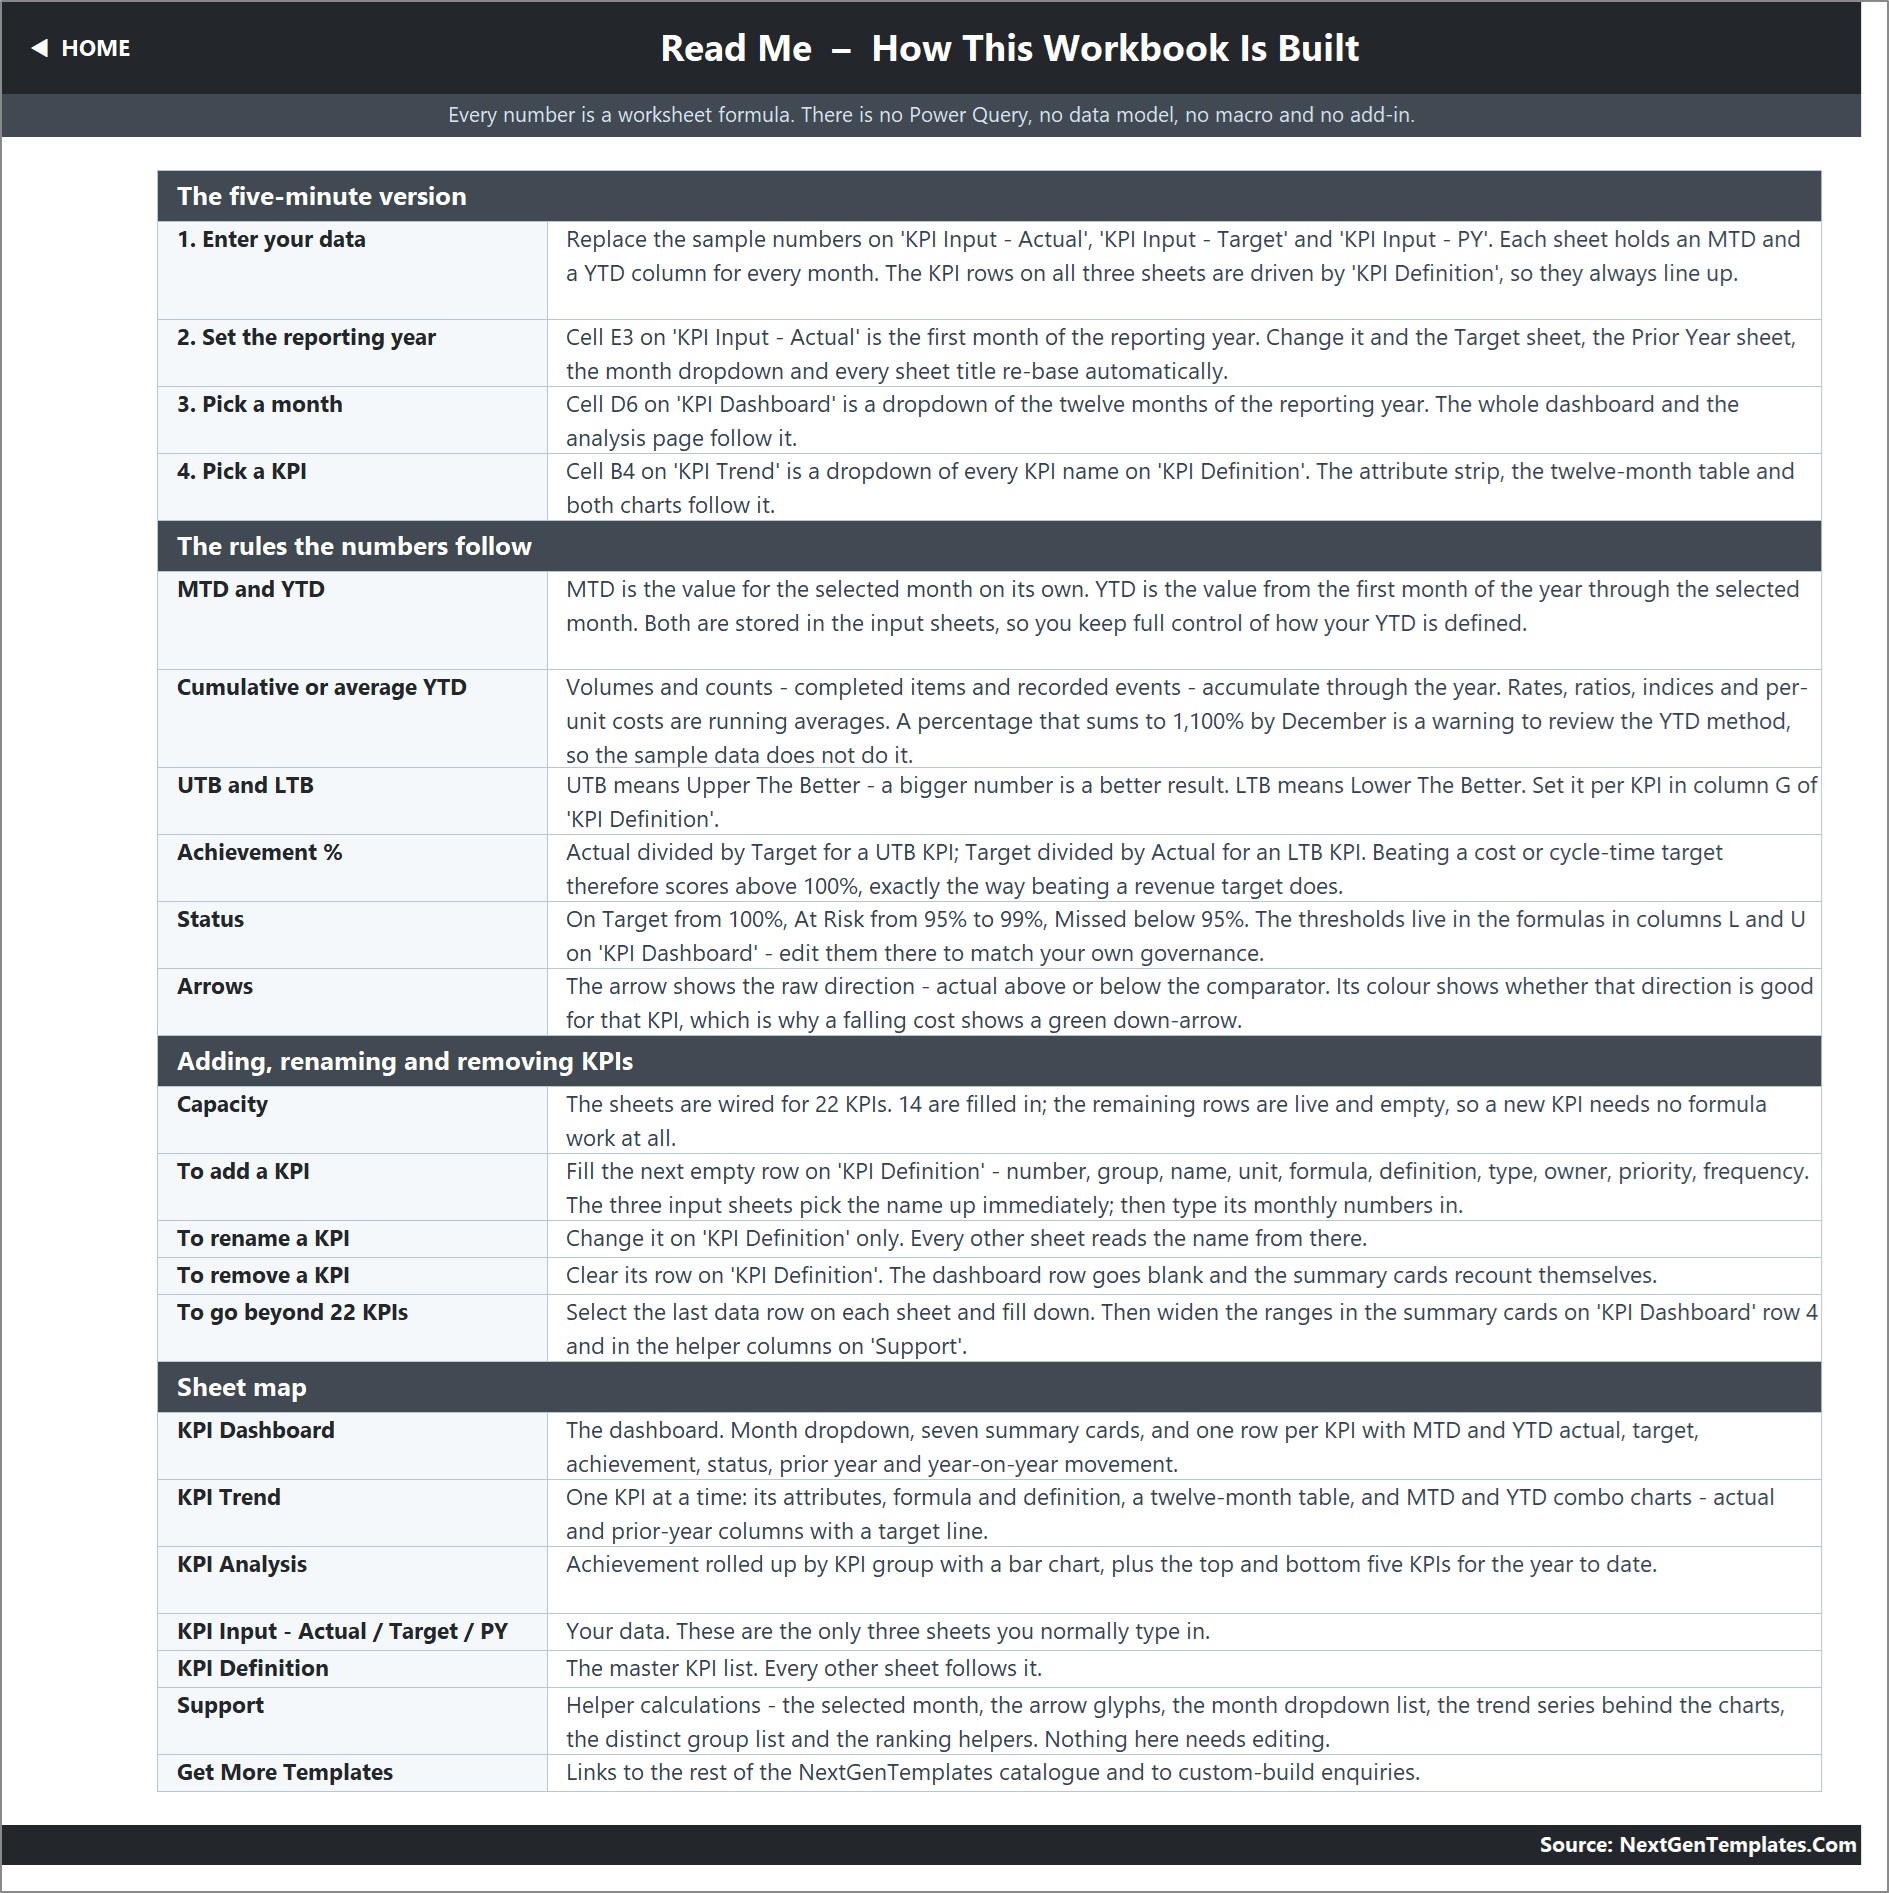
Page 9: Read Me
How the workbook is wired, in four parts: a five-minute setup, the rules the numbers follow (MTD versus YTD, cumulative versus average YTD, UTB and LTB, achievement, status and arrow colour), how to add, rename or remove a KPI, and a sheet map of the whole file.
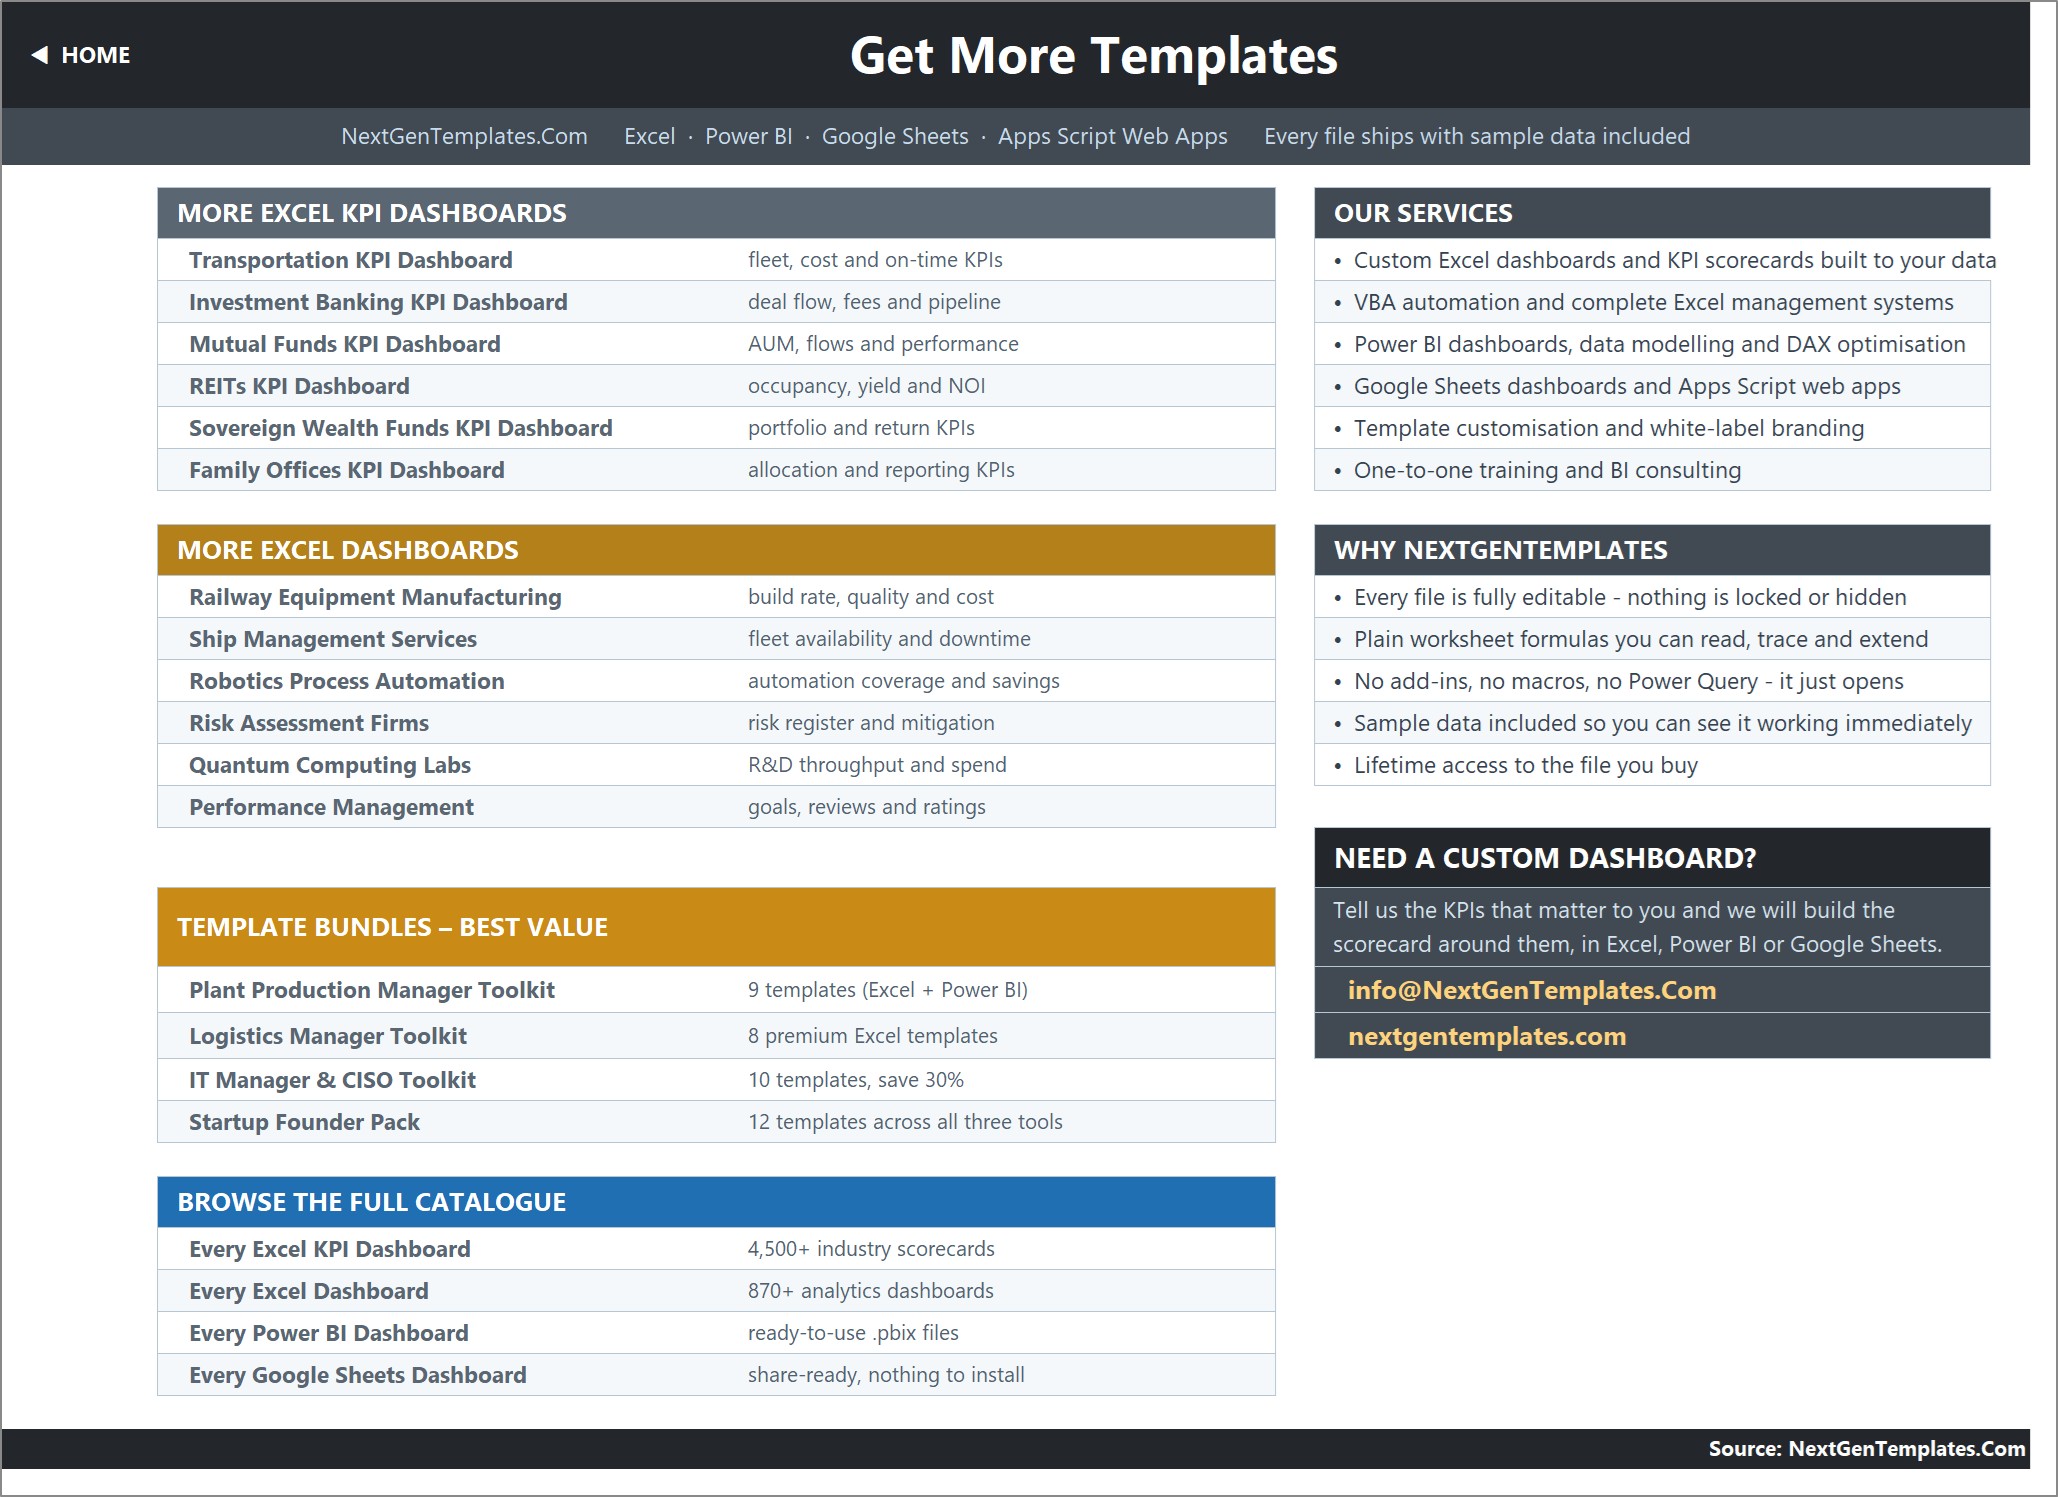
Page 10: Get More Templates
Links out to the rest of the NextGenTemplates catalogue – more Excel KPI dashboards, more Excel dashboards, template bundles – plus the services list and a custom-build enquiry panel.
An eleventh sheet, Support, holds the helper calculations behind the month dropdown, the arrow glyphs, the chart series and the ranking helpers. Nothing on it needs editing.
📊 Tire Shop KPI Dashboard in Excel vs a Google Sheets Build vs Shop-Management SaaS
| Feature | This template | Google Sheets equivalent | Tekmetric / Shopmonkey / Mitchell 1 |
|---|---|---|---|
| Cost | $19.99 one-time | Free to build, days of your time | $199-$499 per shop per month |
| Platform | Excel 2013 or later, and Excel for the web | Browser only | Browser plus vendor mobile app |
| Setup time | Under 15 minutes – three input sheets | Hours to days to build from scratch | Days, with vendor onboarding |
| Macros or add-ins required | ✅ None – worksheet formulas only | ✅ None | Not applicable – hosted software |
| Works offline | ✅ Yes | ❌ No | ❌ No |
| Real-time team collaboration | Via OneDrive or SharePoint | ✅ Native | ✅ Native |
| Customisable KPIs and thresholds | ✅ 22 KPI rows pre-wired, thresholds in the formulas | ✅ Fully, if you build it | ❌ Vendor-defined reports |
| Direction-aware scoring (UTB / LTB) | ✅ Built in per KPI | ❌ You write it yourself | Varies by vendor |
| Year-1 cost for one shop | $19.99 total | Your own build time | $2,400-$6,000 |
For shops that want a board-ready monthly scorecard without paying four figures a year for reporting they already have the numbers for, this Excel KPI dashboard for tire shops sits in the sweet spot.
👥 Who This Template Is For – and Who It Is Not For
✅ Built for:
- Owners and store managers of single-site or small multi-site tire and service shops who report monthly
- Service managers and shop foremen who want attach rate, bay utilisation and comeback rate on one page
- Regional managers comparing shops on the same 13 KPIs and the same thresholds
- Anyone who already has the numbers in a POS or shop-management system and just needs a clean monthly tire shop performance dashboard on top of them
❌ Not for:
- Shops wanting a live feed – this workbook connects to no POS, shop-management or accounting system, and you enter the monthly figures by hand
- Anyone needing tire size, fitment or pricing lookups – there is no distributor catalogue and no ordering feed in this file
- Daily or per-ticket operational tracking – every KPI here is monthly
- Teams who need row-level audit trails, user permissions or SSO
⚙️ How to Use It
- Unzip the download and open the workbook in Microsoft Excel. Nothing needs enabling.
- Open KPI Definition and edit the 13 sample KPIs to your own, or add new ones in the empty rows.
- Set cell E3 on KPI Input – Actual to the first month of your reporting year. Every other sheet re-bases.
- Replace the sample numbers on KPI Input – Actual, KPI Input – Target and KPI Input – PY, MTD and YTD per month.
- Go to KPI Dashboard and pick your month in cell D6. All seven cards and both MTD and YTD blocks update.
- Open KPI Trend, choose a KPI in cell B4, and read its twelve-month table and both charts.
- Finish on KPI Analysis for the group roll-up and the top and bottom five KPIs of the year to date.
💼 Real-World Use Cases
Marcus owns a four-bay tire shop with eleven staff. On the first Monday of the month he types his figures into the three input sheets, picks the month, and takes a printed KPI Dashboard page into the team meeting. Last quarter it showed Service Attach Rate missing target three months running while Gross Margin on Tires held above 100%, which told him the problem was the counter conversation, not the pricing.
Priya runs operations for a six-site chain. She keeps one copy of the workbook per site with the same 13 KPIs and the same thresholds, then compares the KPI Analysis page side by side. Bay Utilization at 96.9% of target at one site and above 100% at another is a staffing conversation she can have with numbers instead of impressions.
Dev is a shop foreman, not an analyst. He uses the KPI Trend page alone – one dropdown, one KPI, twelve months – to watch Average Service Time and Comeback / Rework Rate, the two LTB KPIs he is measured on, without touching anything else in the file.
❓ Frequently Asked Questions
What KPIs does the Tire Shop KPI Dashboard in Excel track?
It tracks 13 KPIs in 5 groups: Tires Sold, Average Repair Order Value, Units per Transaction, Service Attach Rate, Alignment Attach Rate, Road Hazard Warranty Attach Rate, Gross Margin on Tires, Labor Gross Margin, Inventory Turns, Bay Utilization, Average Service Time, Comeback / Rework Rate and Customer Satisfaction.
Does it connect to my POS or shop-management system?
No. This tire shop KPI tracking template holds fictional sample data and connects to no tire-shop, POS or accounting system. You enter the monthly actual, target and prior-year figures yourself on three input sheets. Nothing is imported and nothing syncs.
Can I look up tire sizes, fitment or pricing in it?
No. There is no distributor catalogue, no fitment guide and no ordering feed in this workbook. It is a monthly KPI reporting file, not a tire catalogue or a point-of-sale system.
Does it need macros, Power Query or Power Pivot?
No. Every number is a plain worksheet formula using VLOOKUP, MATCH, INDEX and COUNTIF. The file opens in Excel 2013 and later and in Excel for the web, with no add-in, no data model and no macro-security prompt.
How long does setup take?
Under 15 minutes if your monthly numbers already exist. Edit the KPI names on KPI Definition, set the reporting-year start in cell E3, then paste your actual, target and prior-year figures into the three input sheets. The dashboard, trend and analysis pages follow automatically.
Can I add more than 13 KPIs?
Yes. The sheets are wired for 22 KPI rows, so nine more KPIs need no formula work at all – just fill the next empty row on KPI Definition. To go past 22, select the last data row on each sheet and fill down, then widen the ranges in the summary cards.
How does this compare with Tekmetric or Shopmonkey?
Those are full shop-management platforms that run your tickets and invoicing on a per-shop monthly subscription. This workbook does one thing they charge for – a monthly KPI scorecard with targets, prior-year comparison and traffic lights – for a single one-time payment, using numbers you already have.
👤 About the Author
Built by PK – Microsoft Certified Professional with 15+ years of Excel, Google Sheets and Power BI experience. Founder of NextGenTemplates, reaching 300K+ subscribers across YouTube channels (@PKAnExcelExpert, @NextGenTemplates). Every template is hand-built and tested before release, and the formulas in this one are open – nothing is locked or hidden.
🔗 Explore Related Templates
- Tyre Shop Stock Data Entry System in Excel – the stock-side companion: record tire purchases, sales and stock levels rather than monthly KPIs.
- Auto Repair Dashboard in Excel – an analytics-style dashboard for a general repair shop, built around slicers rather than a month picker.
- Car Dealership Dashboard in Excel – the forecourt equivalent, for dealership sales and service.
- Auto Garage Job Card Management System Web App – job cards, technicians and invoices as a hosted web app.
Browse more in Dashboard Templates and MS Excel Templates. A Tire Shop KPI Scorecard in Excel – a separate build from our KPI Scorecard line, not another copy of this file – is being prepared; this listing is the KPI Dashboard edition, the month-picker scorecard described above.
If you want the same 13 KPIs in a different tool, tell us – we build the same scorecard in Excel, Power BI or Google Sheets to order. Excel’s own VLOOKUP documentation covers the one function you need to understand if you want to extend the file yourself.
📖 Click here to read the detailed blog post
🎥 Visit our YouTube channel for step-by-step video tutorials
👉 YouTube.com/@NextGenTemplates
📅 Last updated: September 2026
































Reviews
There are no reviews yet.