

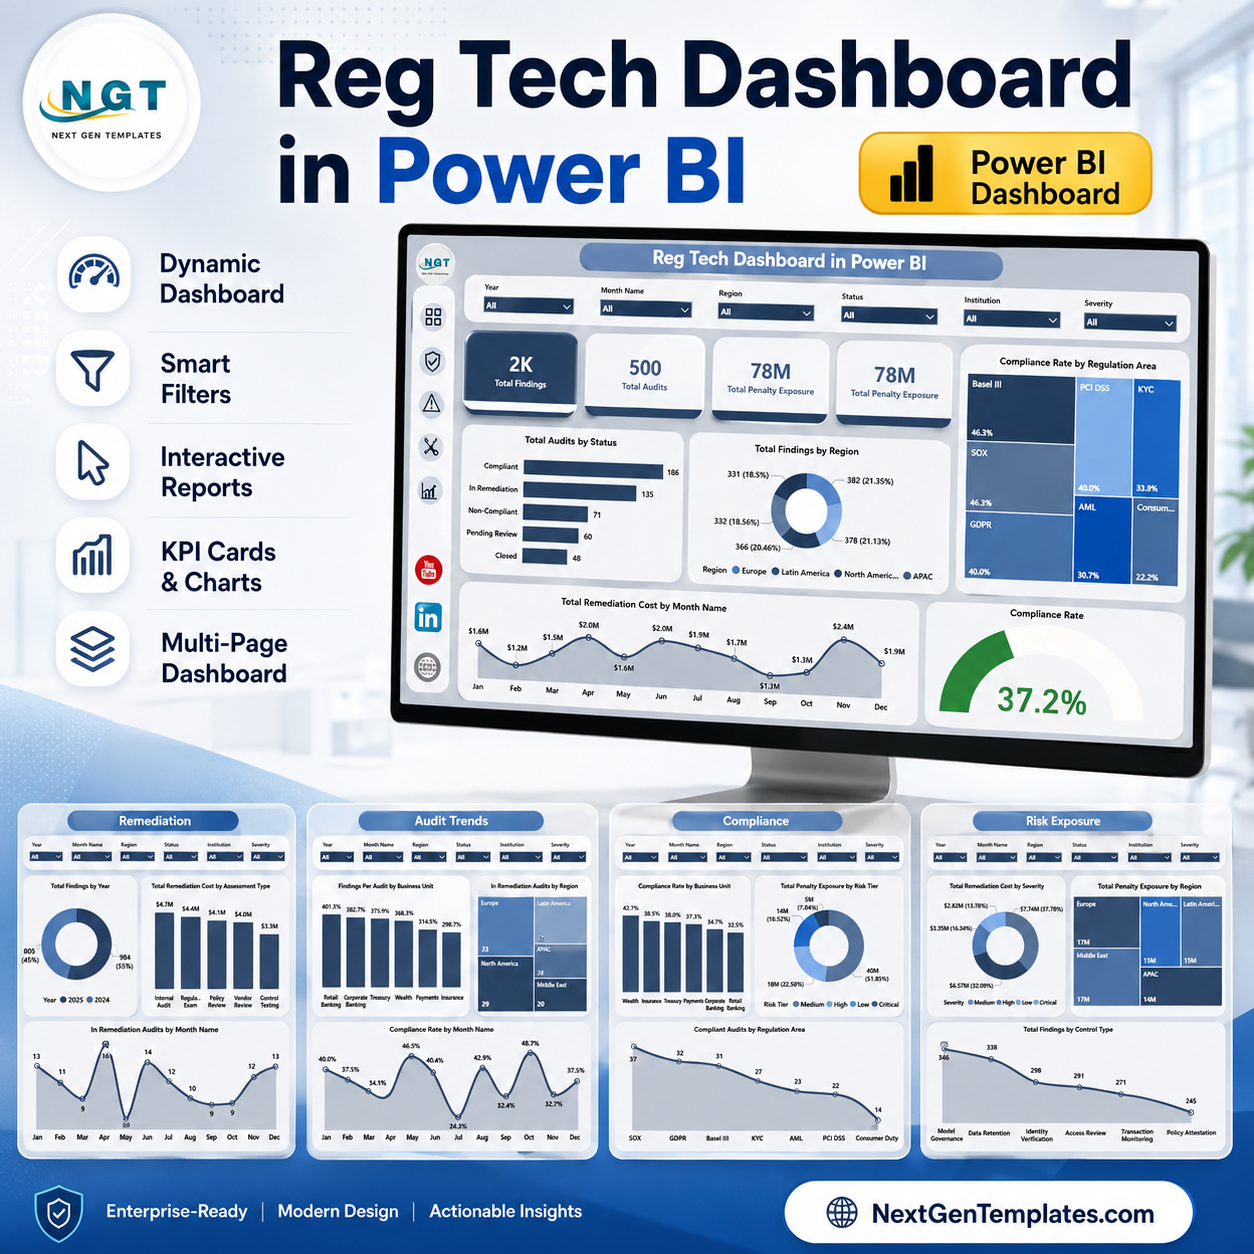
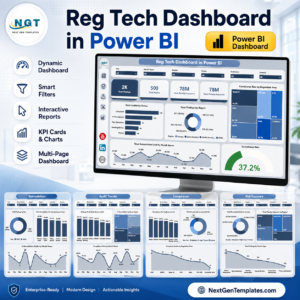
Reg Tech Dashboard in Power BI helps compliance, audit, and risk teams review regulatory findings, audit status, penalty exposure, remediation cost, and compliance rate across 5 focused report pages. Regulatory teams often track hundreds or thousands of audit records across regions, business units, reviewers, institutions, and regulation areas. This Power BI dashboard gives that scattered reporting a cleaner structure, with KPI cards, slicers, and visual pages that make review meetings faster. Built by PK, backed by 15+ years of Excel and Power BI experience and 300K+ YouTube subscribers, this downloadable PBIX template gives you a practical starting point with a simple risk reversal: replace the sample data, validate your numbers, and adapt the visuals before internal use.
Overview Page
Key Features of Reg Tech Dashboard in Power BI
- 5 Power BI report pages for Overview, Compliance, Risk Exposure, Remediation, and Audit Trends.
- Executive KPI cards for Total Findings, Total Audits, Total Penalty Exposure, and Compliance Rate.
- Chart analysis by status, region, regulation area, month, business unit, risk tier, institution, severity, control type, assessment type, reviewer, and year.
- Multiple slicers to filter the dashboard quickly during audit reviews and management meetings.
- Editable PBIX file so analysts can map their own data, adjust visuals, and publish through their normal Power BI workflow.
What’s Inside the Reg Tech Dashboard in Power BI
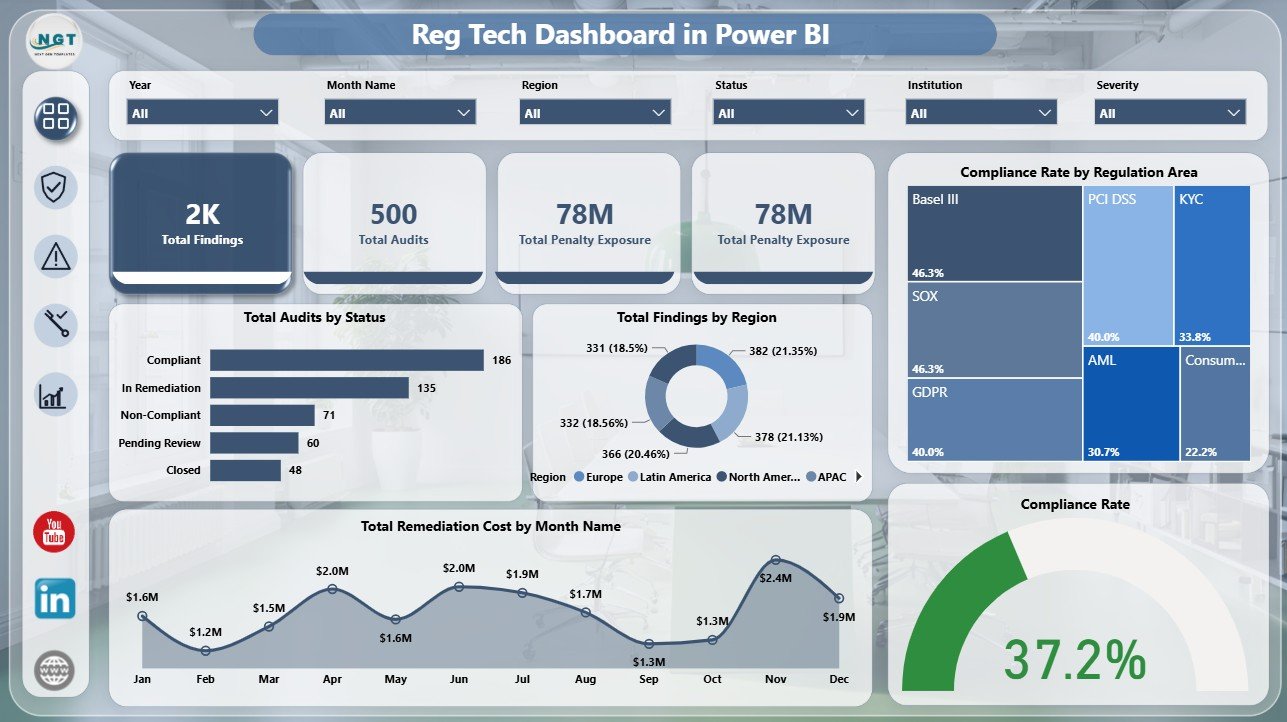
Overview Page: The top cards show Total Findings, Total Audits, Total Penalty Exposure, and Compliance Rate. These cards help managers understand audit volume, compliance health, and financial exposure before reviewing detailed pages.
Total Audits by Status: This chart separates completed, open, in remediation, and other audit statuses. It helps teams see whether work is closing or building into a backlog.
Total Findings by Region: This visual compares findings across regions. It is useful for identifying geographic hot spots where controls, training, or monitoring need more attention.
Compliance Rate by Regulation Area: This chart shows how compliance performance changes by regulatory domain. It helps prioritize regulation areas with lower scores or recurring gaps.
Total Remediation Cost by Month Name: This chart tracks remediation cost by month. It supports budget review and shows when corrective action spending rises or falls.
Compliance Rate: The compliance rate visual summarizes performance for the selected filters. Leaders can quickly compare filtered scenarios without rebuilding the report.
Compliance
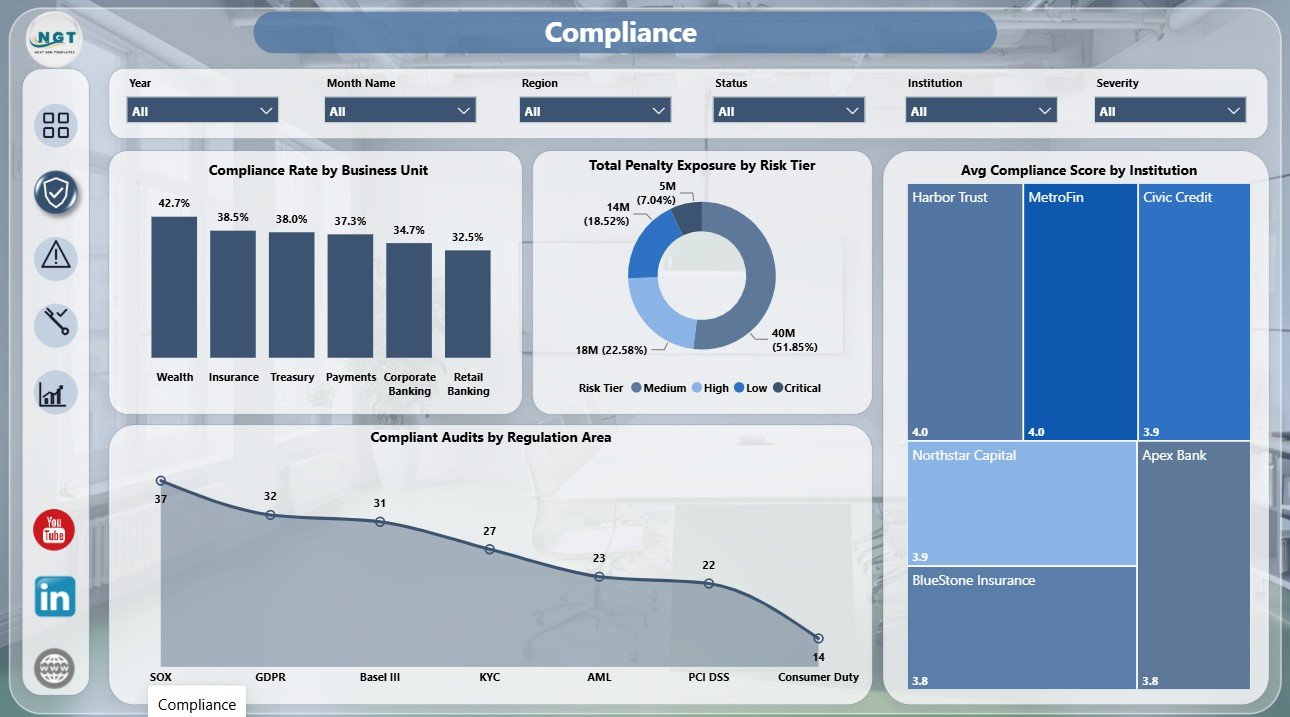
The Compliance page includes Compliance Rate by Business Unit, Total Penalty Exposure by Risk Tier, Average Compliance Score by Institution, and Compliant Audits by Regulation Area. It helps compliance managers compare departments, institutions, and regulatory domains in one view.
Risk Exposure
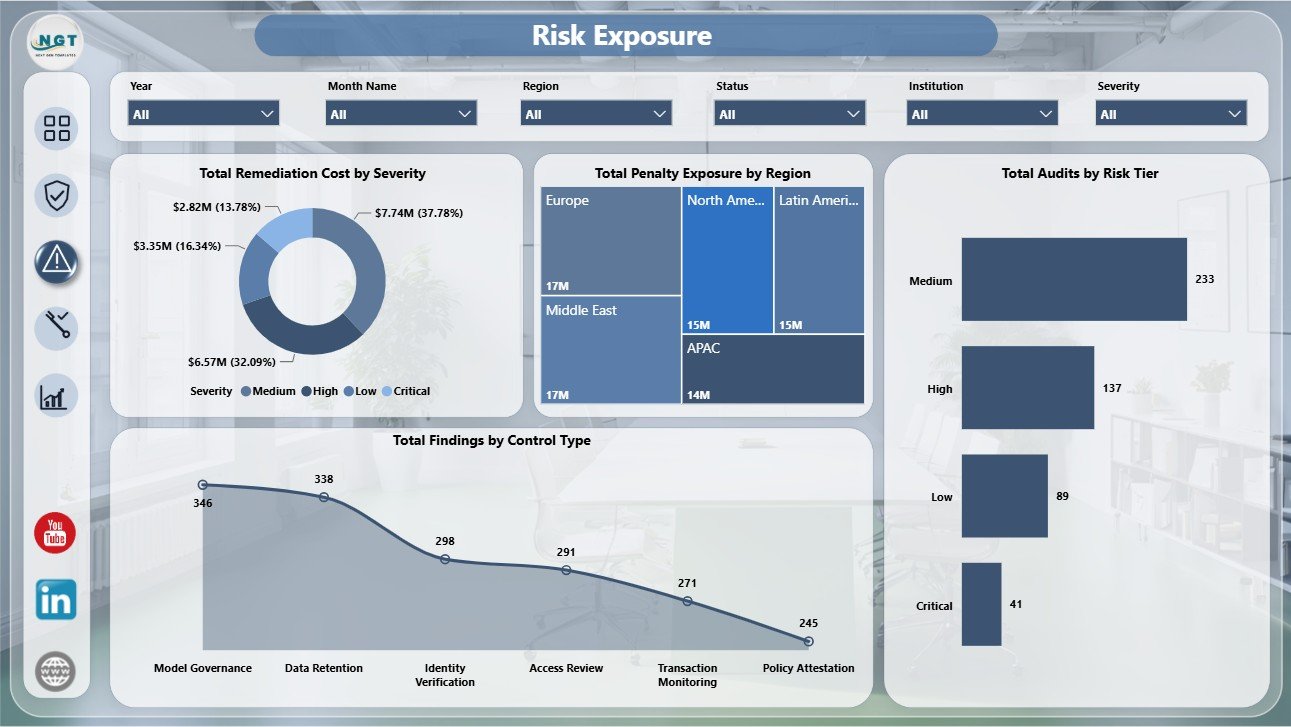
The Risk Exposure page reviews Total Remediation Cost by Severity, Total Penalty Exposure by Region, Total Audits by Risk Tier, and Total Findings by Control Type. It is useful for escalation meetings where financial exposure and control weakness must be reviewed together.
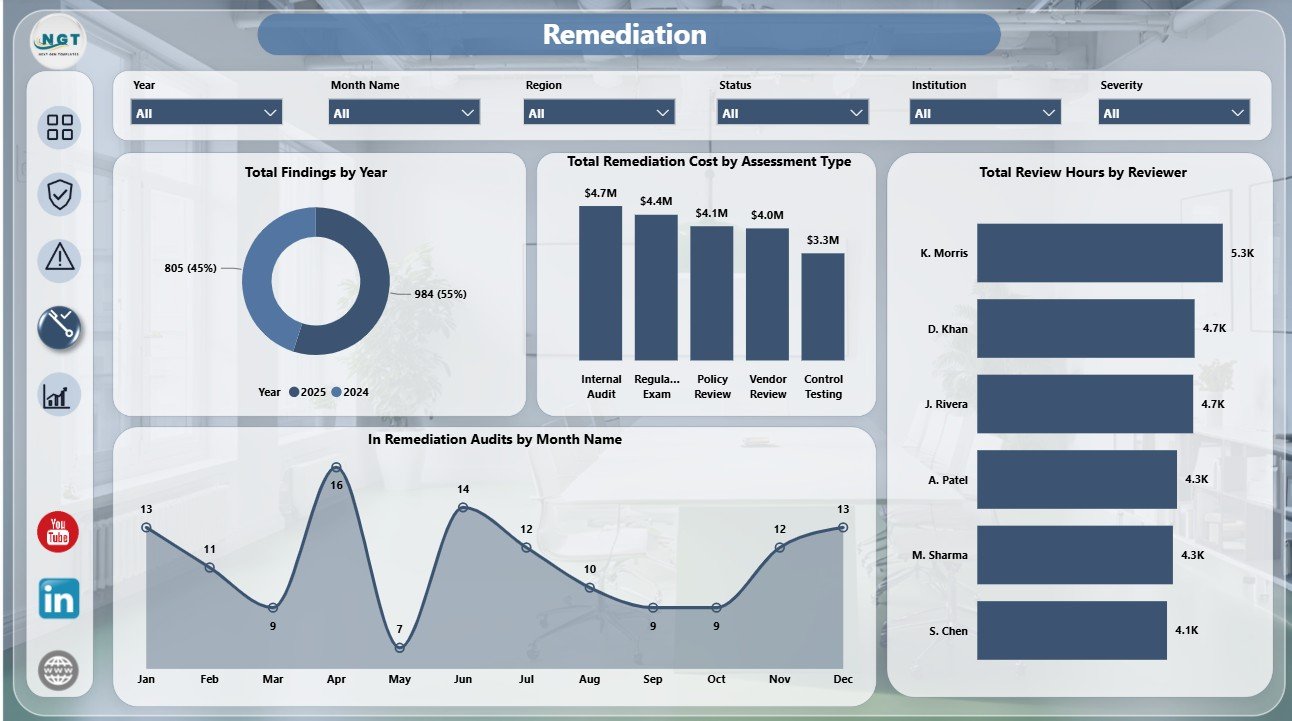
Remediation
The Remediation page includes Total Findings by Year, Total Remediation Cost by Assessment Type, Total Review Hours by Reviewer, and In Remediation Audits by Month Name. It helps teams connect long-term findings trends with cost, workload, and active remediation timing.
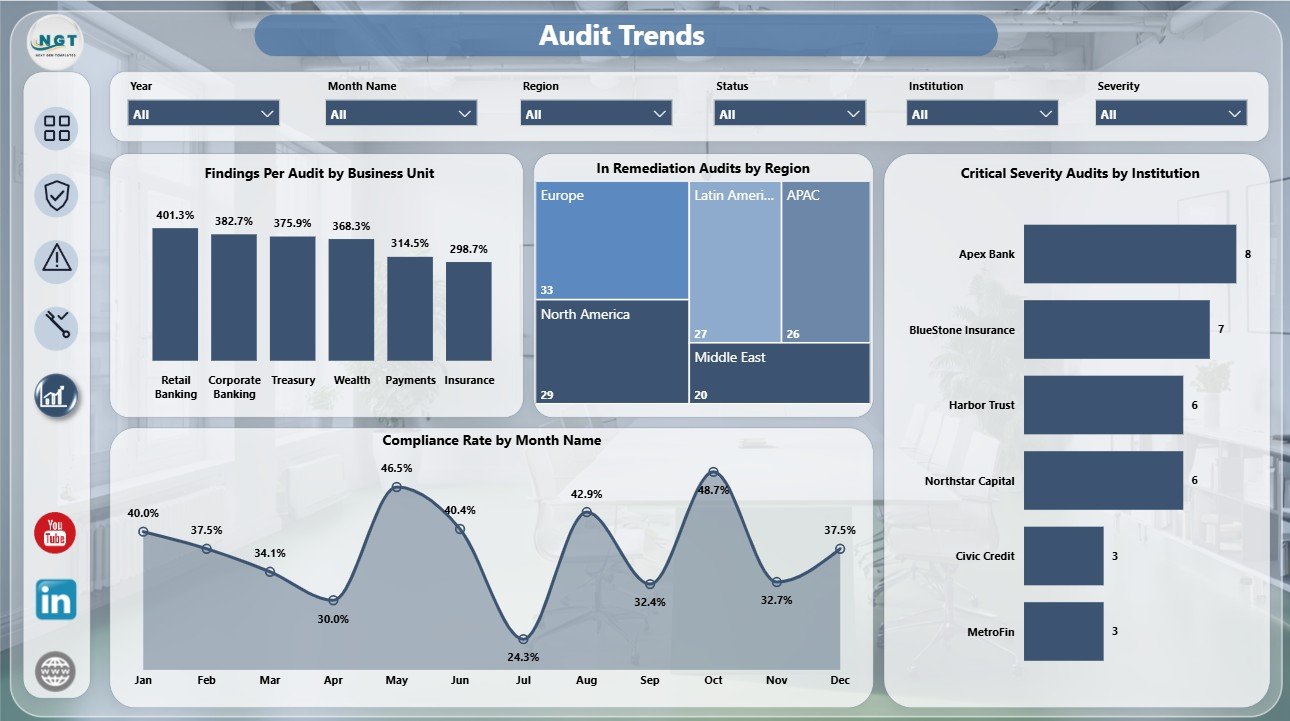
Audit Trends
The Audit Trends page shows Findings Per Audit by Business Unit, In Remediation Audits by Region, Critical Severity Audits by Institution, and Compliance Rate by Month Name. It helps leaders see whether risk is improving over time or concentrating in specific areas.
Reg Tech Dashboard in Power BI vs. Tableau vs. Paid GRC SaaS – Where This Fits
| Area | This Power BI template | Tableau alternative | Paid GRC SaaS |
|---|---|---|---|
| Cost | One-time template purchase | Requires Tableau licensing or rebuild effort | Recurring subscription and onboarding cost |
| Platform | Power BI Desktop and Power BI Service | Tableau Desktop or Tableau Cloud | Vendor-hosted compliance platform |
| Setup time | Fast when your data matches the template fields | Requires equivalent workbook or dashboard design | Depends on implementation scope |
| Real-time collaboration | Available through Power BI Service with proper licensing | Available through Tableau Cloud or Server | Usually included |
| Mobile access | Available after publishing to Power BI Service | Available after publishing | Usually included |
| Customizable fields | Editable model, visuals, and measures | Editable with Tableau skills | Often limited by configuration |
| Share with link | Requires Microsoft sharing setup | Requires Tableau sharing setup | Usually role-based account access |
| Year-1 cost at 5 users | $17.99 template plus any Microsoft licensing | Workbook cost plus Tableau licensing | Can be hundreds or thousands per year |
| Regulatory reporting fit | Best for visual reporting and review meetings | Best for teams already standardized on Tableau | Best for evidence workflow, approvals, and audit trails |
Who This Template Is For – and Who It’s Not For
This template is for compliance analysts, internal audit managers, regulatory reporting teams, risk officers, financial institutions, fintech teams, consultants, and operations leaders who need a ready Power BI report for audit and compliance review.
It is not a full GRC system. It does not replace evidence collection, approval workflows, legal signoff, automated regulatory filing, immutable audit trails, or case management. Use it as a reporting layer when your team already has structured audit or compliance data.
How to Use the Reg Tech Dashboard in Power BI
- Download and unzip the product file.
- Open the PBIX file in Power BI Desktop.
- Review the sample fields and map your own audit, finding, compliance, region, institution, and remediation data.
- Refresh the model and check the Overview page first.
- Use slicers to filter by region, status, risk tier, regulation area, business unit, reviewer, month, or institution.
- Customize visuals, labels, colors, measures, and pages for your internal reporting standard.
Real-World Use Cases
Compliance Manager: A compliance manager reviews Total Penalty Exposure, Compliance Rate, and findings by region before a monthly risk committee meeting.
Internal Audit Lead: An audit lead filters open and in-remediation audits by risk tier to identify which control issues need escalation.
Regulatory Consultant: A consultant uses the Compliance and Risk Exposure pages to summarize client audit results and remediation priorities.
Frequently Asked Questions
Does this dashboard work in Power BI Desktop?
Yes. Open the PBIX file in Power BI Desktop, replace the sample data with your own source, and refresh the report.
Can I customize the dashboard pages?
Yes. You can edit visuals, measures, data model fields, colors, slicers, and page layouts inside Power BI.
Does this include real compliance data?
No. It is a template structure. Replace sample or placeholder records with your own validated audit and compliance data before using it for decisions.
Can this dashboard track remediation cost?
Yes. The dashboard includes remediation cost analysis by month, severity, and assessment type, depending on the page.
Is this a GRC software replacement?
No. It is a reporting template for Power BI, not a full compliance workflow, evidence, or regulatory filing platform.
Can I publish this to Power BI Service?
Yes, if you have the appropriate Microsoft licensing and sharing permissions for your organization.
About the Author
Built by PK – Microsoft Certified Professional with 15+ years of Excel, Google Sheets, and Power BI experience. Founder of NextGenTemplates, reaching 300K+ subscribers across YouTube channels. Every template is hand-built and tested before release.
Explore Related Templates
- Reg Tech Dashboard in Excel
- Recycling Infrastructure Dashboard in Power BI
- Power BI Dashboard Mega Collection
- Power BI templates
- Power BI dashboard templates
Download the Reg Tech Dashboard in Power BI today and give your compliance team a clearer way to review audits, findings, penalty exposure, remediation cost, risk tier, and audit trends.
Last updated: August 2, 2026



























Reviews
There are no reviews yet.