

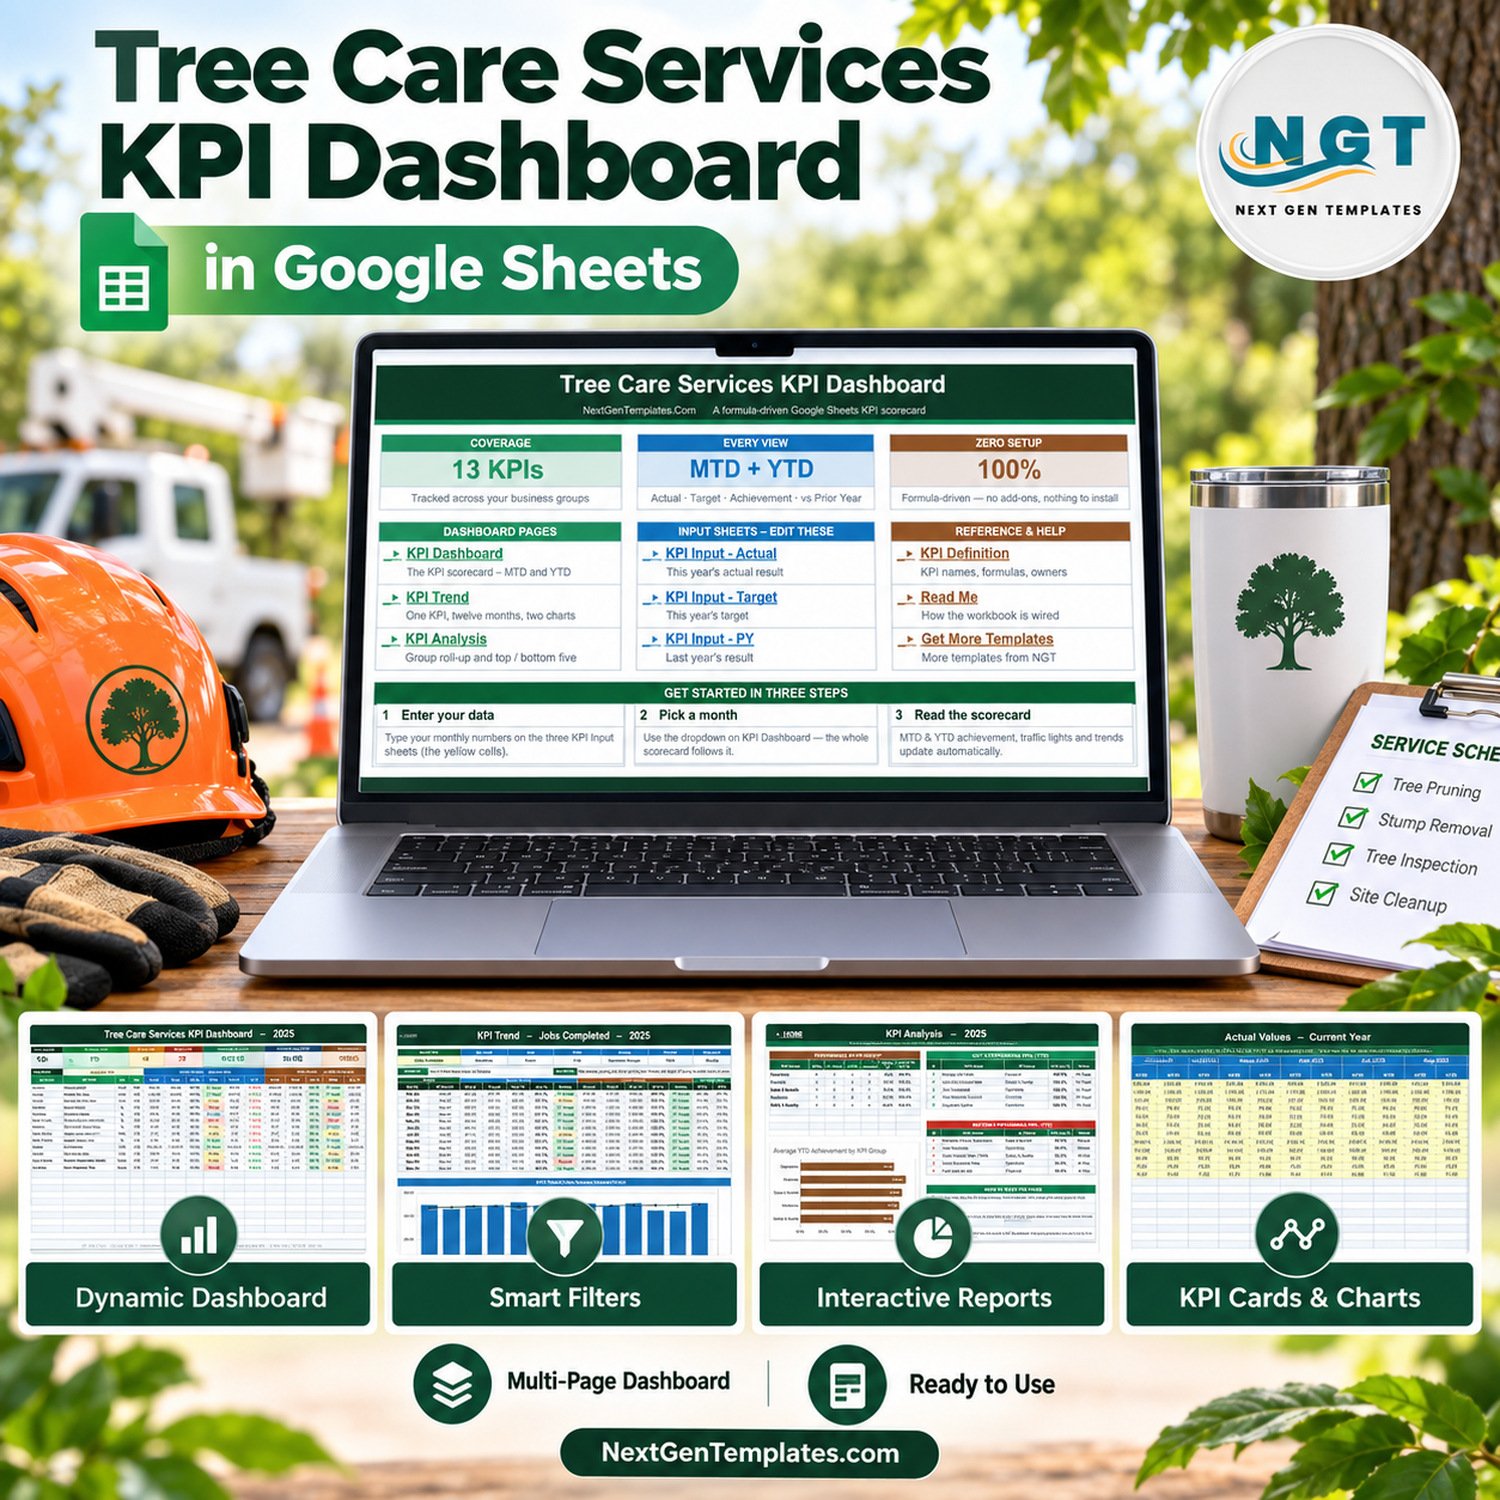
The Tree Care Services KPI Dashboard in Google Sheets puts 13 monthly measures of a tree care business on one scorecard, in 5 KPI groups, with month-to-date and year-to-date achievement, traffic lights and a prior-year comparison in every row. In the September 2025 sample, 7 KPIs are On Target for the year, 4 are At Risk and 2 are Missed, with average achievement at 98.5% MTD and 98.8% YTD. Every figure is a worksheet formula: no add-ons, no Apps Script, nothing to install.
✅ Instant download · One-time payment · No subscription · Lifetime access to your own copy
This is a KPI Dashboard: a month-picker scorecard with KPI Trend and KPI Analysis pages. It is a different template from our analytical Google Sheets dashboards and from the Tree Care Services KPI Scorecard in Google Sheets (in preparation), which comes from our separate KPI Scorecard line.
🔑 Key Features of the Tree Care Services KPI Dashboard in Google Sheets
🌳 13 KPIs in 5 groups – Operations (4), Financial (4), Safety & Quality (3), Sales & Growth (1) and Workforce (1), including Jobs Completed, Revenue per Crew Hour, Crew Utilization, Equipment Uptime, Estimate-to-Close Conversion, Fuel Cost per Job and Storm-Response Time.
📅 One month picker – the dropdown on KPI Dashboard drives the scorecard, its seven summary cards and the KPI Analysis page. Nothing needs refreshing.
↕️ Direction-aware scoring – 9 KPIs are upper-the-better and 4 lower-the-better, so beating a fuel-cost or response-time target scores above 100%.
🚦 Editable traffic lights – On Target from 100%, At Risk 95% to 99%, Missed below 95%, set in the Status formulas.
🧩 Room for 22 KPIs – 13 rows are filled and 9 live rows wait empty on KPI Definition.
📦 What Is Inside the Tree Care Services KPI Dashboard
Page 1: Home
Three header cards, links to every page and input sheet, and a three-step get-started strip.
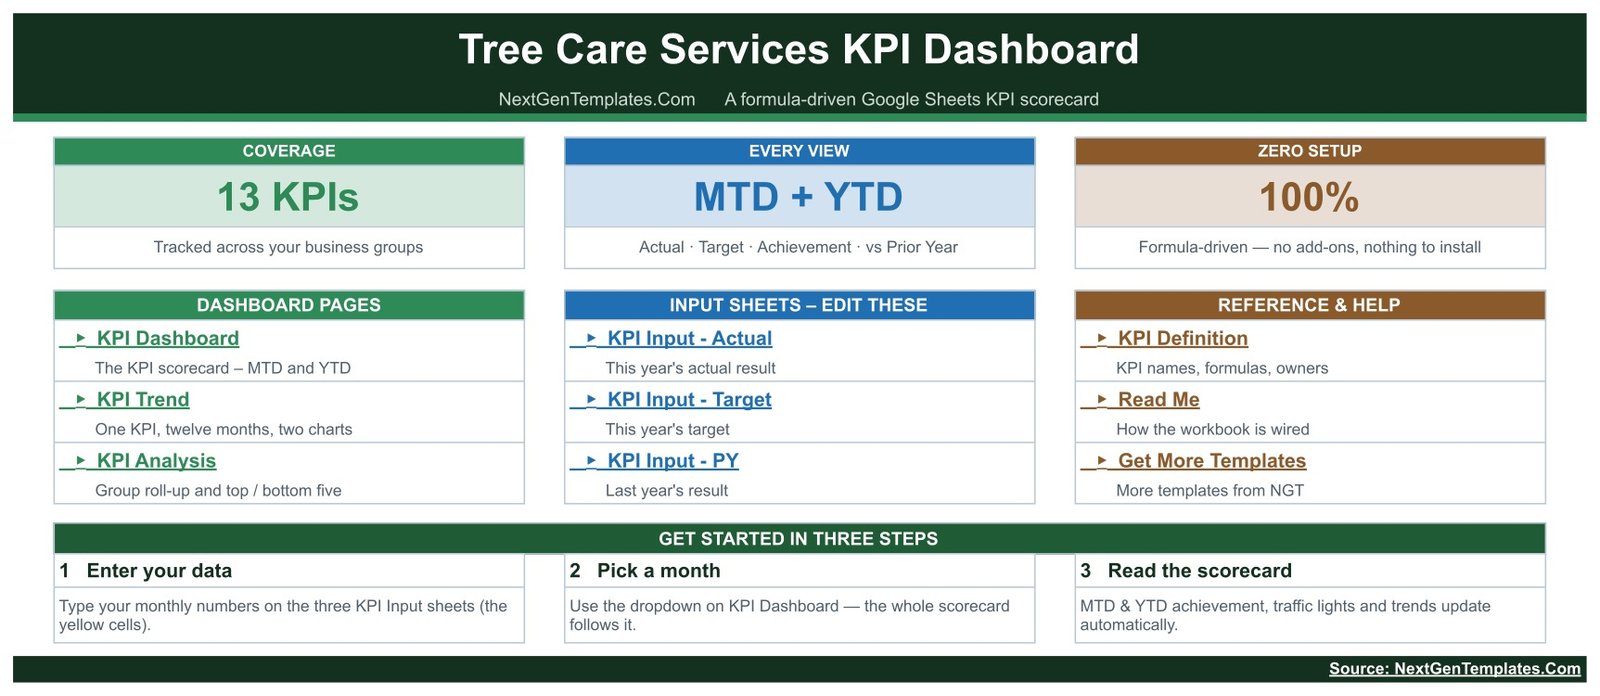
Page 2: KPI Dashboard
Seven cards sit above one row per KPI with MTD and YTD actual, target, achievement %, status, prior year and vs PY. In the sample, Total Revenue reaches 104.6% of target while Crew Utilization is Missed at 92.1%.
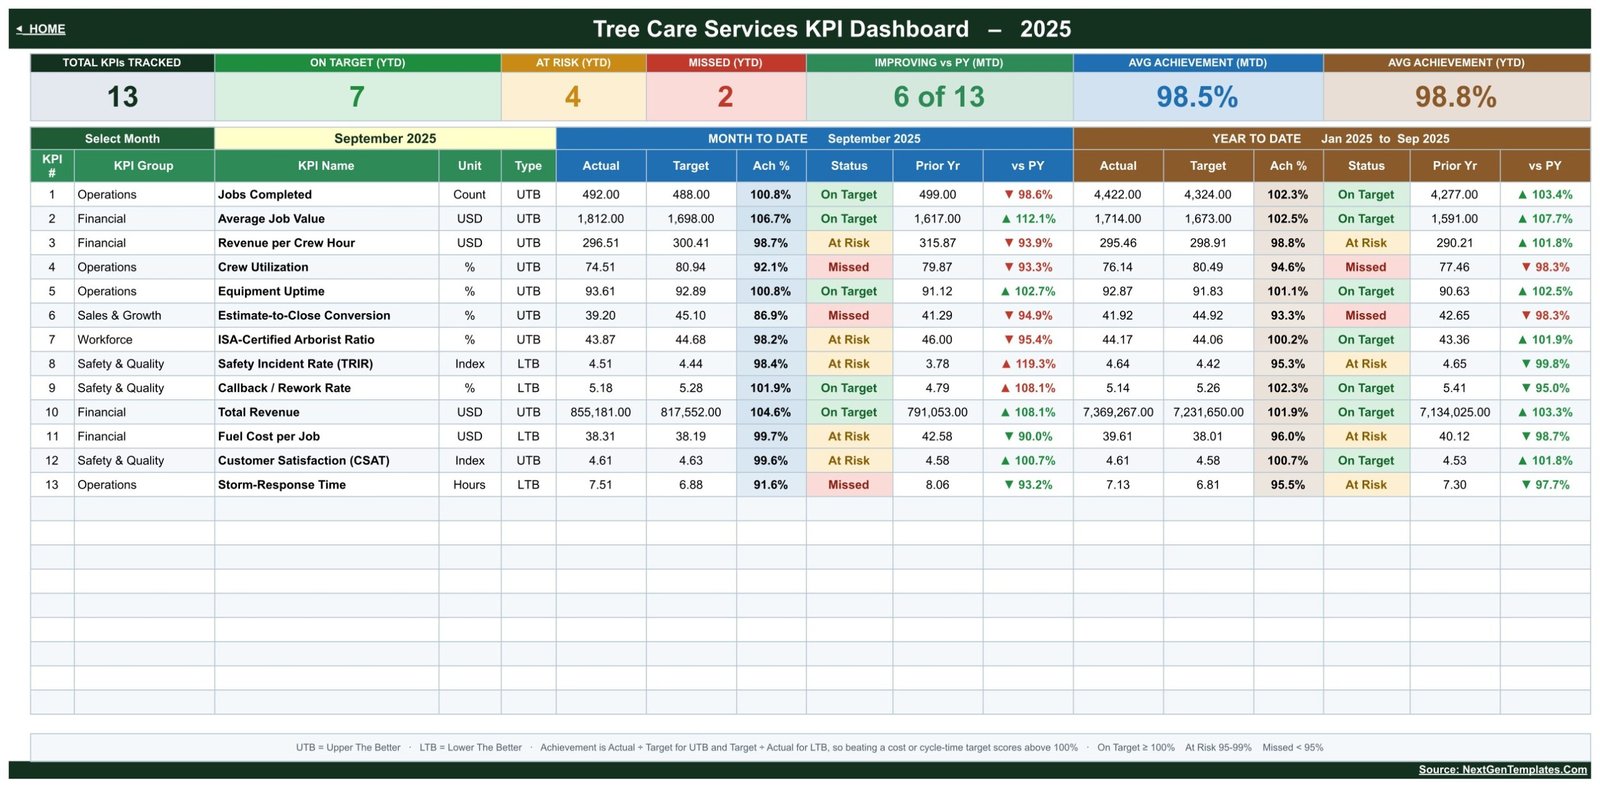
Page 3: KPI Trend
Pick one KPI to see its owner, formula and definition, a twelve-month table, and two charts: MTD Actual, Target and PY by Month, and YTD Actual, Target and PY by Month.
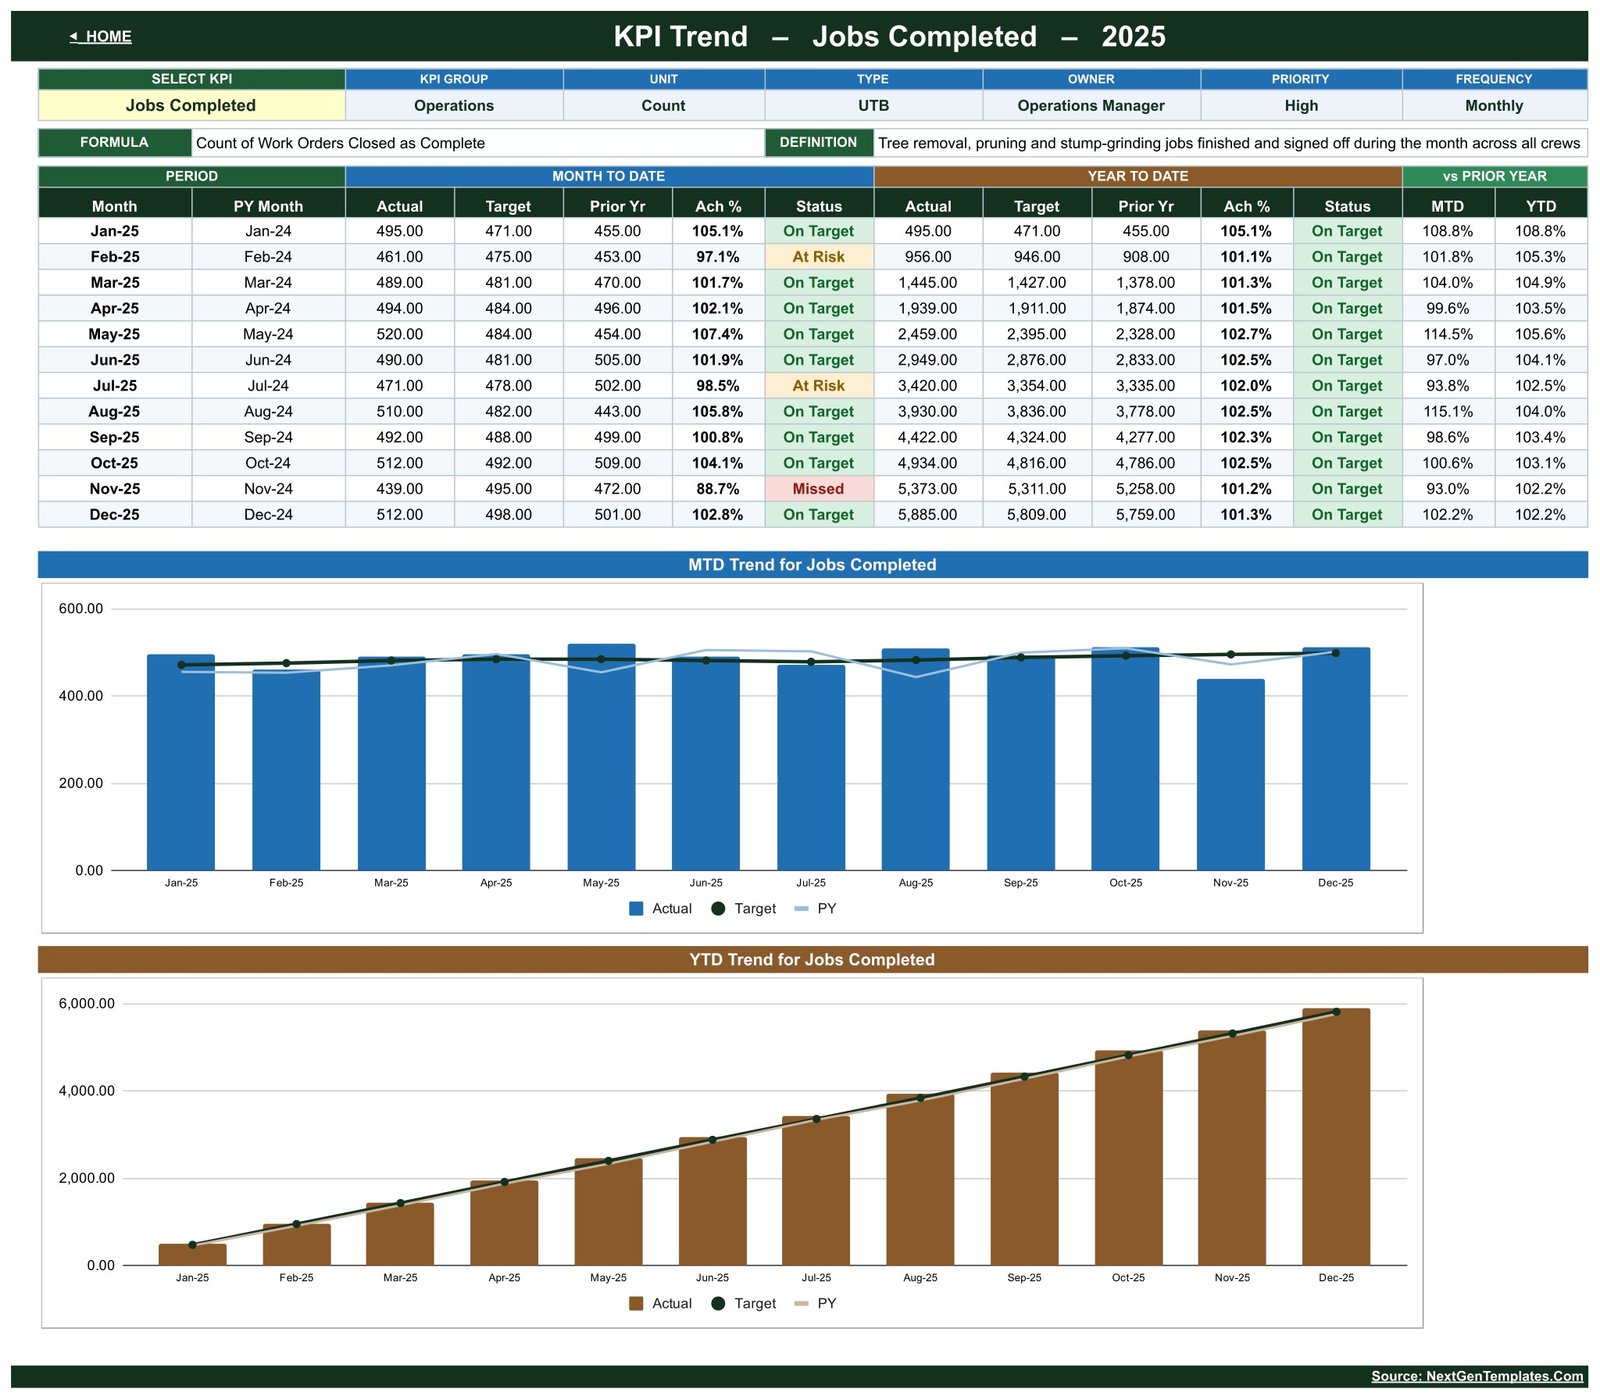
Page 4: KPI Analysis
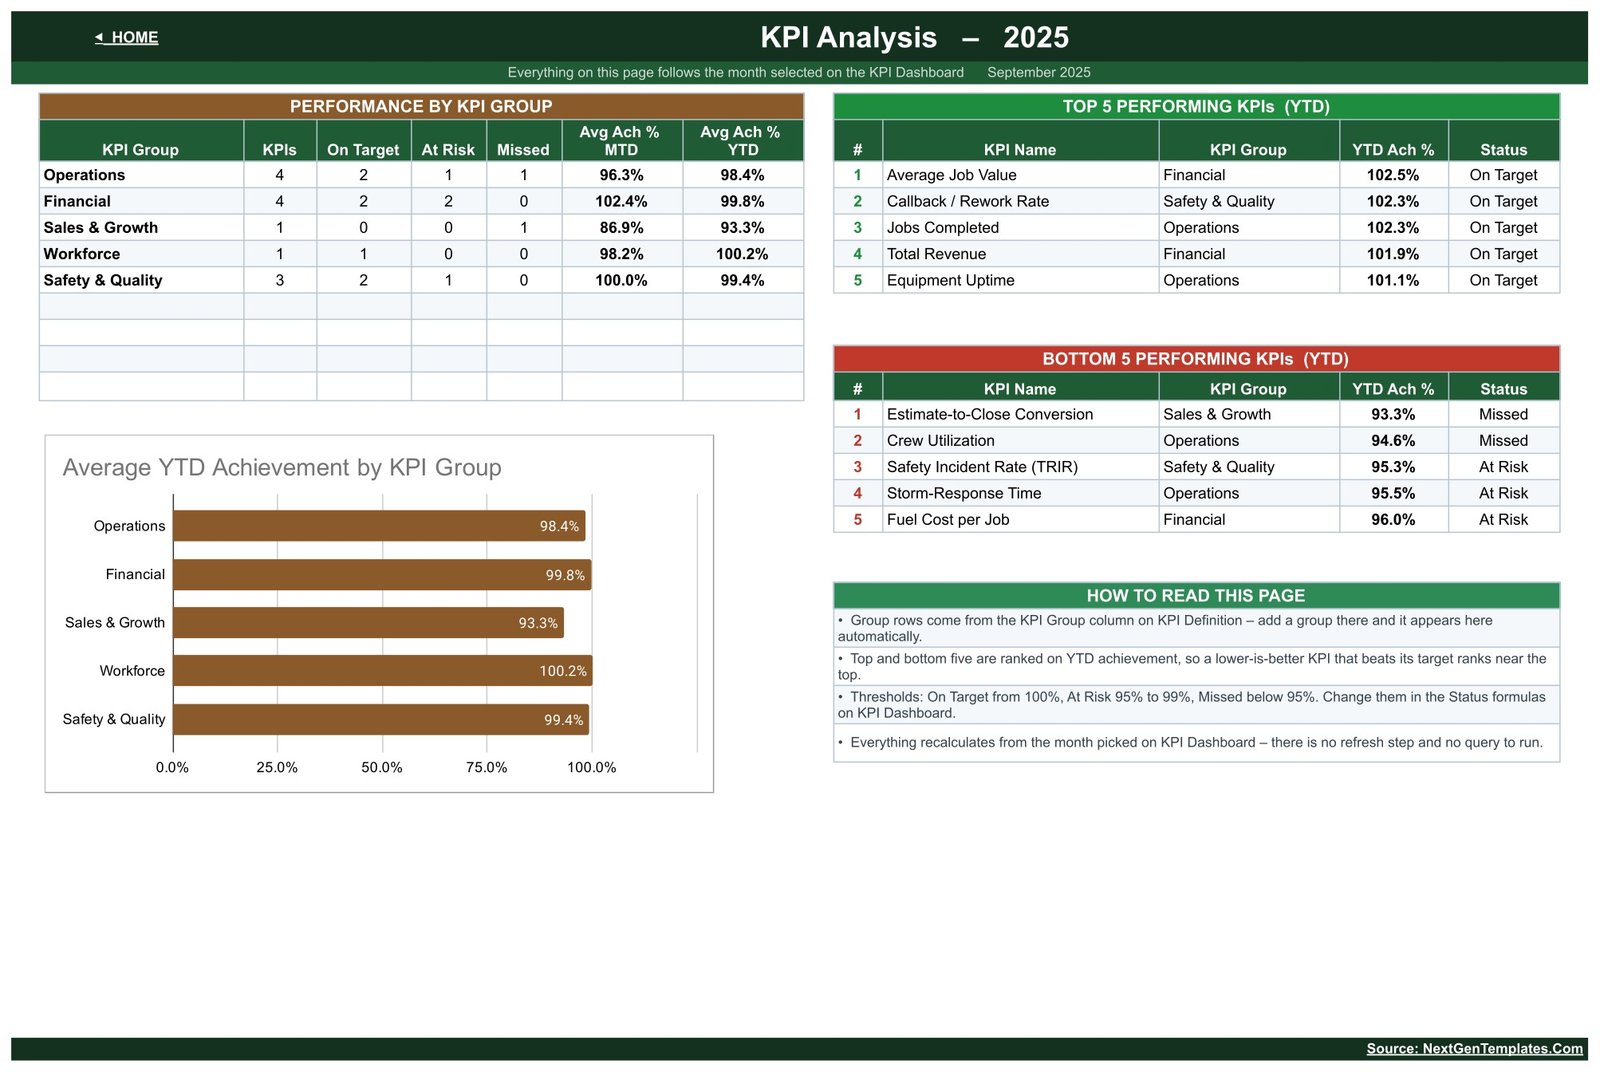
Performance by KPI Group, an Average YTD Achievement by KPI Group chart, and Top 5 and Bottom 5 tables ranked by YTD achievement – Average Job Value leads at 102.5%, Estimate-to-Close Conversion trails at 93.3%.
Page 5: KPI Input sheets
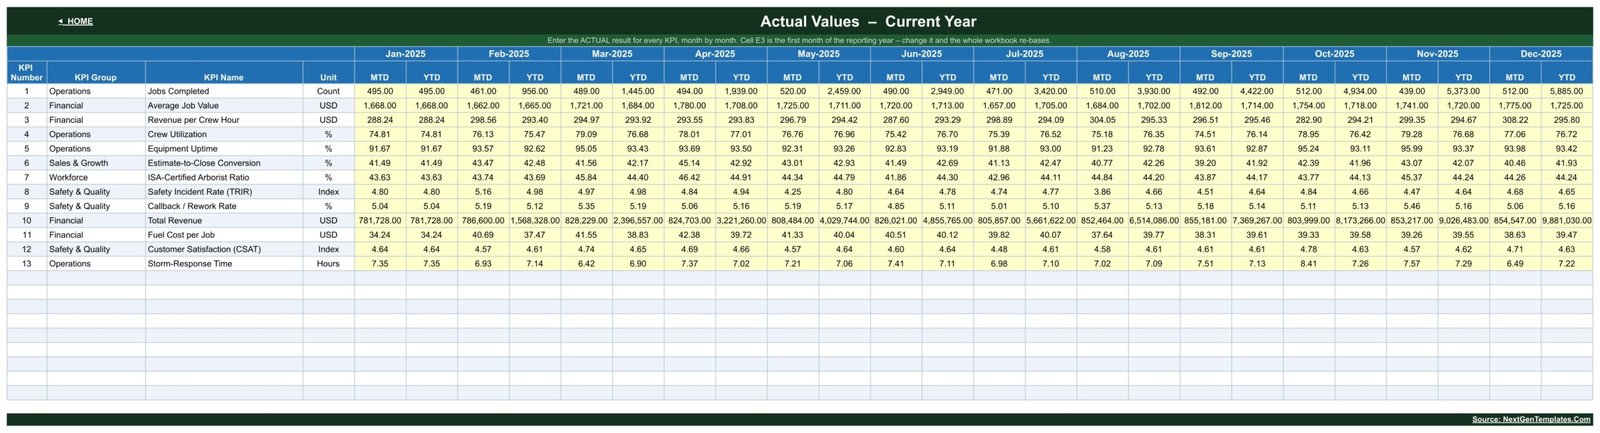
Yellow MTD and YTD cells for every KPI and month on KPI Input – Actual, with the same layout on KPI Input – Target and KPI Input – PY. Cell E3 sets the first month of the year.
Page 6: KPI Definition
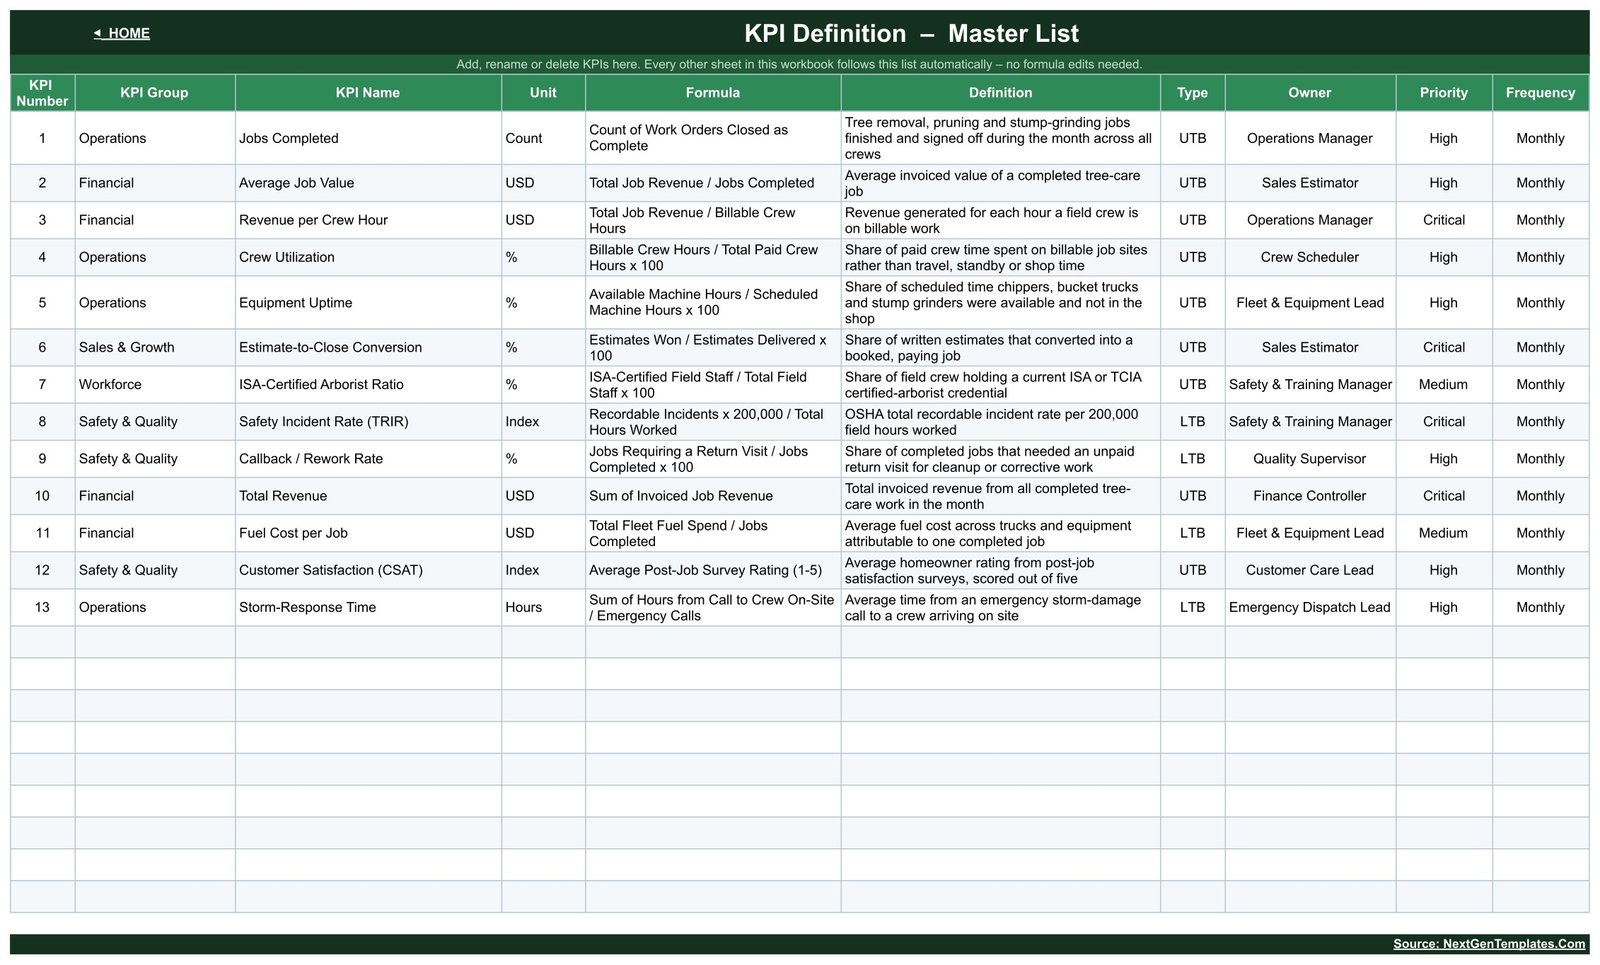
Group, name, unit, formula, definition, type, owner, priority and frequency for each KPI. Rename a KPI here and every sheet follows.
📊 Google Sheets vs. Excel vs. Field Service Software
| Feature | This template (Google Sheets) | Excel KPI workbook | Field service software |
|---|---|---|---|
| Cost | ✅ One-time price | Template plus Office licence | Per-user subscription |
| Platform | ✅ Any browser | Excel desktop | Vendor app |
| Real-time collaboration | ✅ Built in | Needs OneDrive | Per paid seat |
| Customizable KPIs | ✅ 22 slots | Formula work | Vendor reports |
| Scheduling and invoicing | ❌ Reporting only | ❌ Not included | ✅ Core feature |
👥 Who This Template Is For – and Who It Is Not For
✅ Built for: owners and operations managers of tree removal, pruning and stump-grinding companies; estimators and finance leads tracking job value, conversion and fuel cost; consultants building a monthly KPI pack.
❌ Not for: firms that need scheduling, dispatch, estimates or invoicing, or anyone looking for safety-compliance, incident recording or certification tooling – the safety and staffing KPIs are management indicators on sample data.
⚙️ How to Use the Tree Care Services KPI Dashboard
- Open the PDF in your download and click its link to make your own copy in Google Drive.
- Edit KPI Definition to match your business.
- Type monthly MTD and YTD figures into the yellow cells on the three input sheets.
- Pick a month on KPI Dashboard, then open KPI Trend and KPI Analysis.
💼 Real-World Use Cases
Ryan runs operations for a three-crew tree service. He picks the month, checks Crew Utilization and Equipment Uptime, then opens KPI Trend to see whether utilization has slipped since spring.
Elena is the sales estimator. She reads Estimate-to-Close Conversion beside Average Job Value and uses the Bottom 5 table to put estimate follow-up on the agenda.
❓ Frequently Asked Questions
Do I need a paid Google Workspace account?
No. A free Google account is enough. Open the PDF, click the link and Google Drive creates your editable copy.
Does the template calculate YTD for me?
No. Each input sheet holds an MTD and a YTD value per month, so you decide whether YTD is a running total or an average.
Are the figures in the screenshots real?
No. The template ships with illustrative 2025 sample data. Replace it with your own numbers and everything recalculates.
Does it cover safety compliance or arborist certification?
No. Safety Incident Rate (TRIR) and the certified-arborist staffing ratio are monthly management numbers only. The template does not record incidents, track credentials or certify anyone, and the sample definitions are example wording to replace.
Is there an Excel edition?
A Tree Care Services KPI Dashboard in Excel is in preparation. Meanwhile, browse our Google Sheets KPI Dashboard templates.
👤 About the Author
Built by PK – Microsoft Certified Professional with 15+ years of Excel, Google Sheets and Power BI experience, and founder of NextGenTemplates.
🔗 Explore Related Templates
🌿 Landscaping Dashboard in Google Sheets
🐜 Pest Control Business KPI Dashboard in Google Sheets
🏊 Swimming Pool Service KPI Dashboard in Google Sheets
🚪 Garage Door Service KPI Scorecard in Google Sheets
📖 Click here to read the Detailed Blog Post
🎥 Tutorials: YouTube.com/@PKAnExcelExpert · New to Sheets? See Google Docs Editors Help.
📅 Last updated: September 2026




























Reviews
There are no reviews yet.