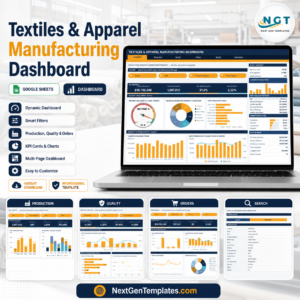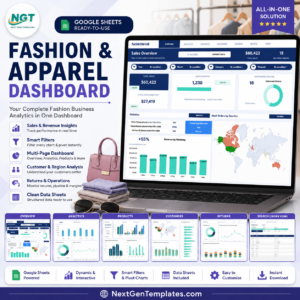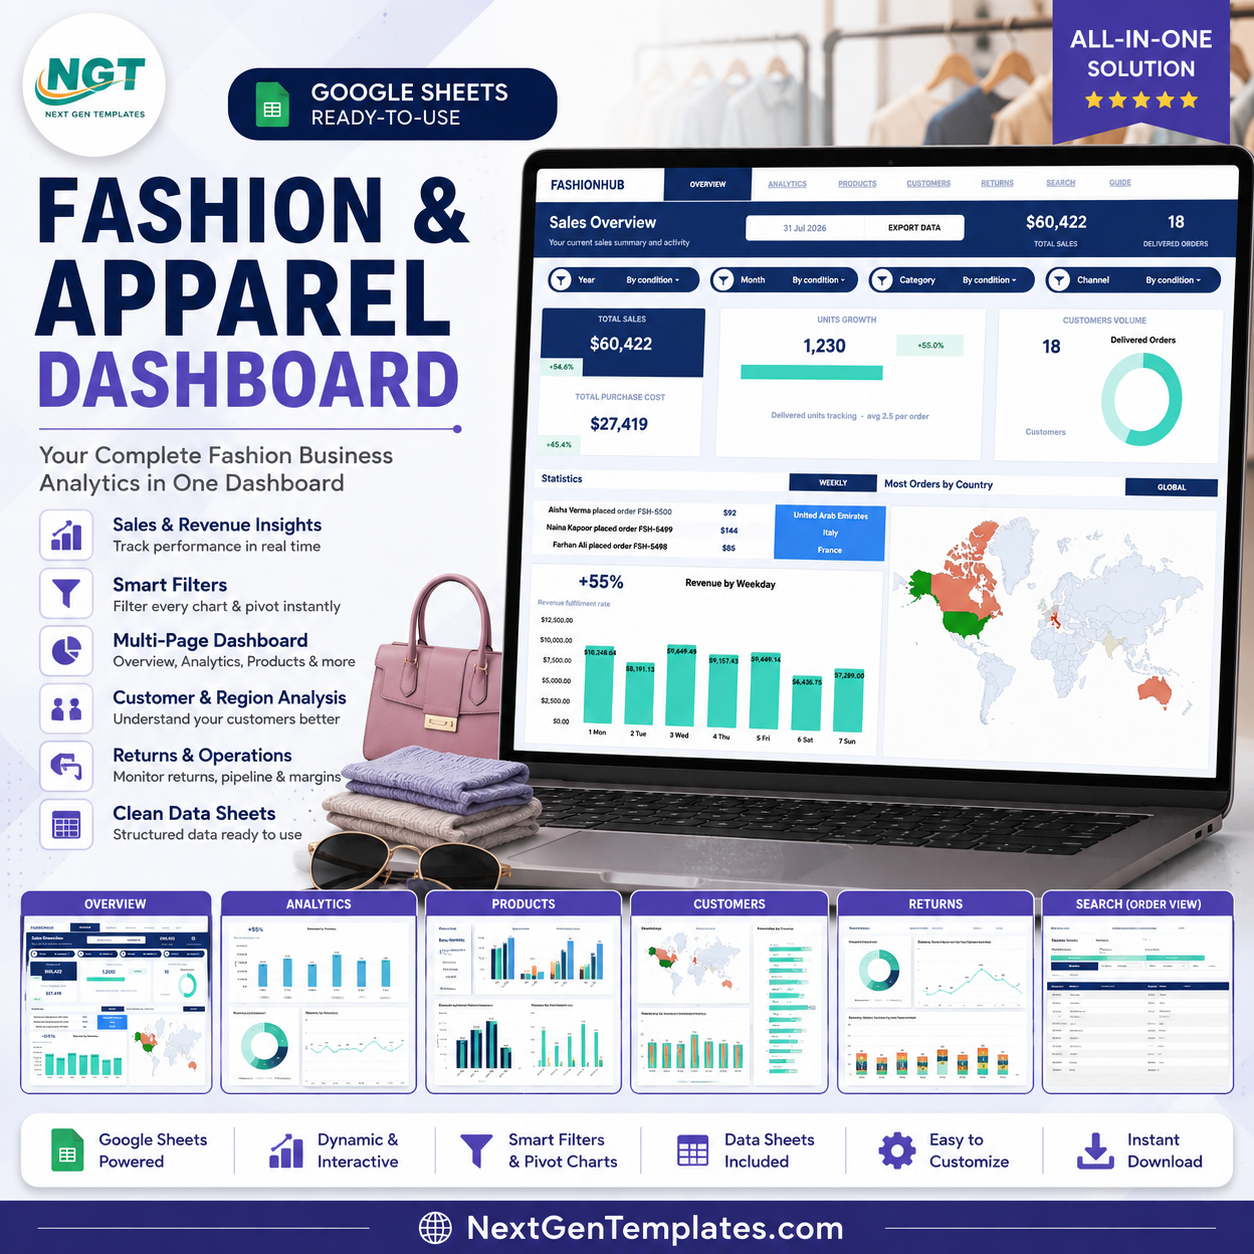
The Fashion and Apparel Dashboard in Google Sheets turns one order data sheet into 7 working tabs, 5 headline KPI cards, 19 chart views, and a searchable Order ID lookup. It covers Total Sales, Total Purchase Cost, Units Growth, Customers Volume, and Delivered Orders, with slicers for fast filtering by channel, country, category, product, size, status, and date. Built by PK, whose template tutorials reach 300K+ YouTube subscribers, this editable Google Sheets dashboard gives fashion retailers, apparel brands, and boutique teams a one-time reporting workflow before they commit to paid retail analytics software.
Key Features of Fashion and Apparel Dashboard in Google Sheets
- 7 Google Sheets tabs: Overview, Sales Analysis, Products and Sizes, Customers and Regions, Returns and Operations, Order Search, and Data Sheet.
- 5 executive KPI cards: Track sales, purchase cost, units growth, customer volume, and delivered orders from the top of the dashboard.
- 19 chart views: Review revenue, orders, units, costs, discounts, status, countries, customers, categories, channels, products, sizes, and months.
- Interactive slicers: Filter quickly without rebuilding formulas or charts.
- Order ID search: Select one order and instantly view its full record.
- Editable source data: Replace the sample orders in the Data Sheet while keeping the same column structure.
- Google Drive friendly: Copy the file into your own Google Drive and share it with selected teammates.
What’s Inside the Fashion and Apparel Dashboard in Google Sheets
1. Overview Page
The Overview page gives a high-level view of sales, costs, unit movement, customer count, and delivered orders. It is designed for quick weekly or monthly review before users drill into the detailed analysis tabs.
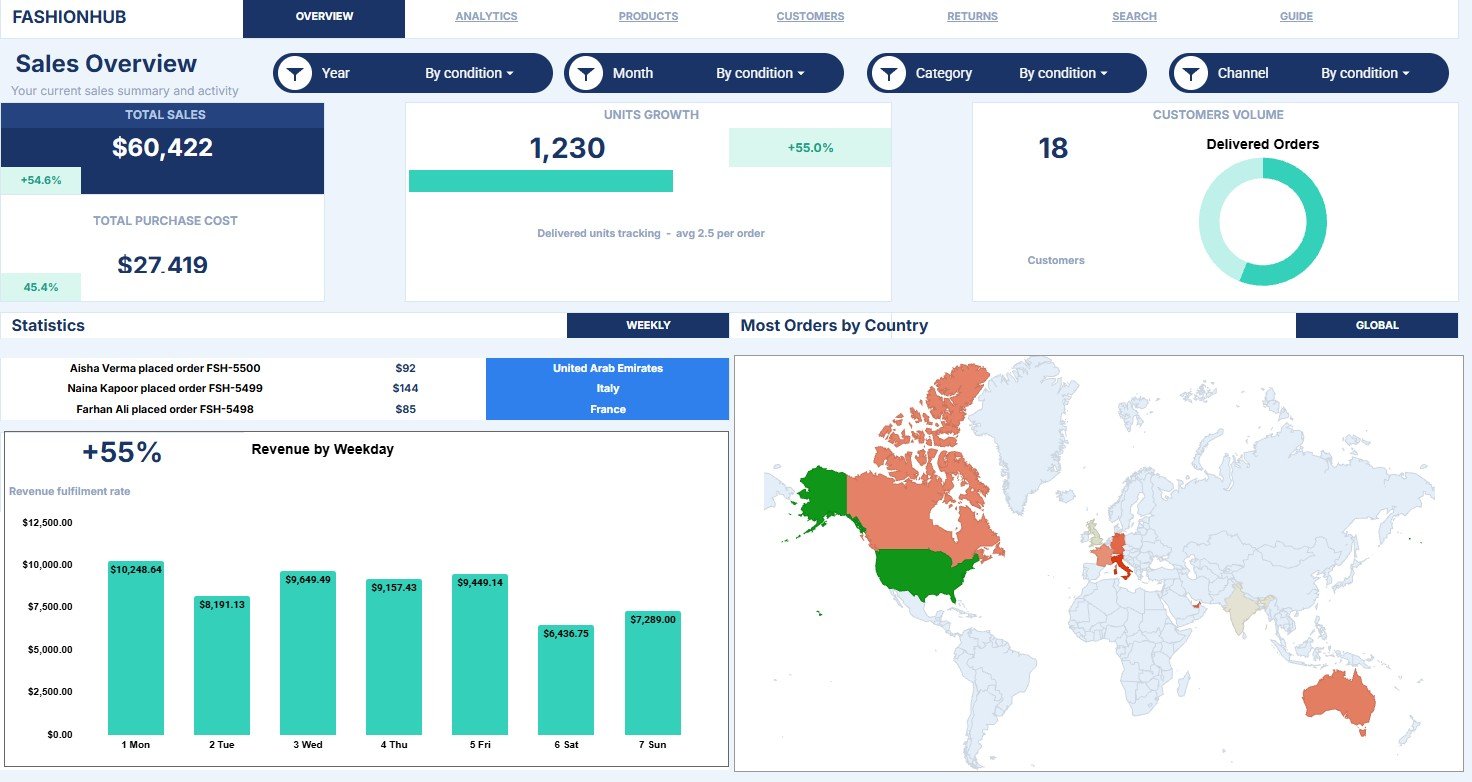
Revenue by Weekday: This chart shows which weekdays generate the most revenue. It helps identify shopping patterns that can guide promotions, staffing, and campaign timing.
Orders by Country: This chart compares order volume across countries. It helps users spot strong markets and locations that may need more marketing attention.
Delivered Orders by Customers: This chart highlights customers with delivered order activity. It helps teams review customer contribution and focus follow-up around reliable buyers.
2. Sales Analysis
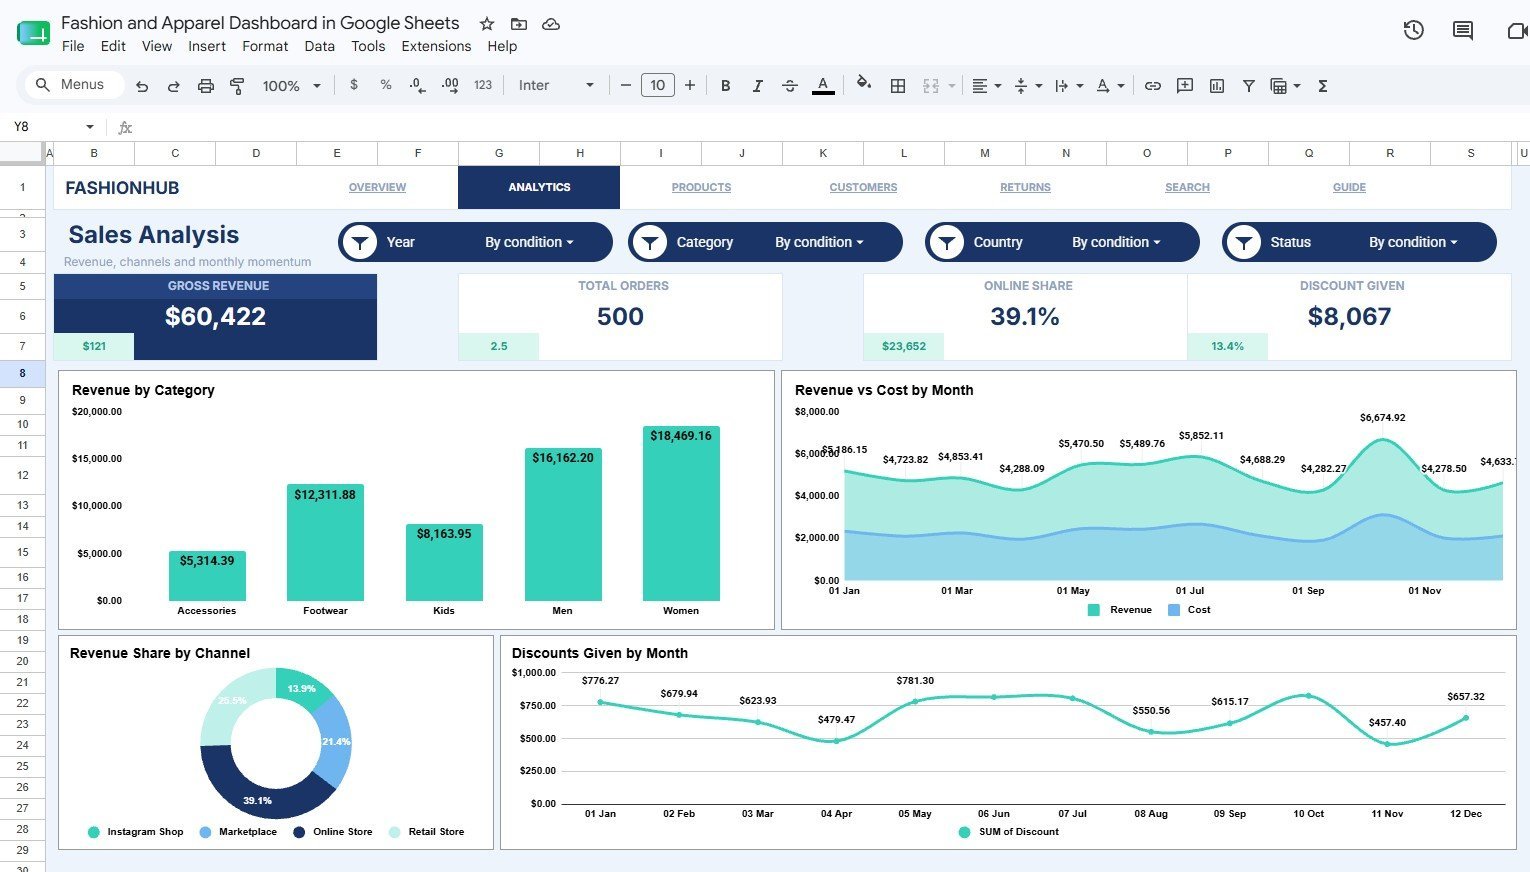
The Sales Analysis tab focuses on revenue, purchase cost, sales channels, and discounts. It is useful for understanding where money is coming from and how cost or discount activity affects performance.
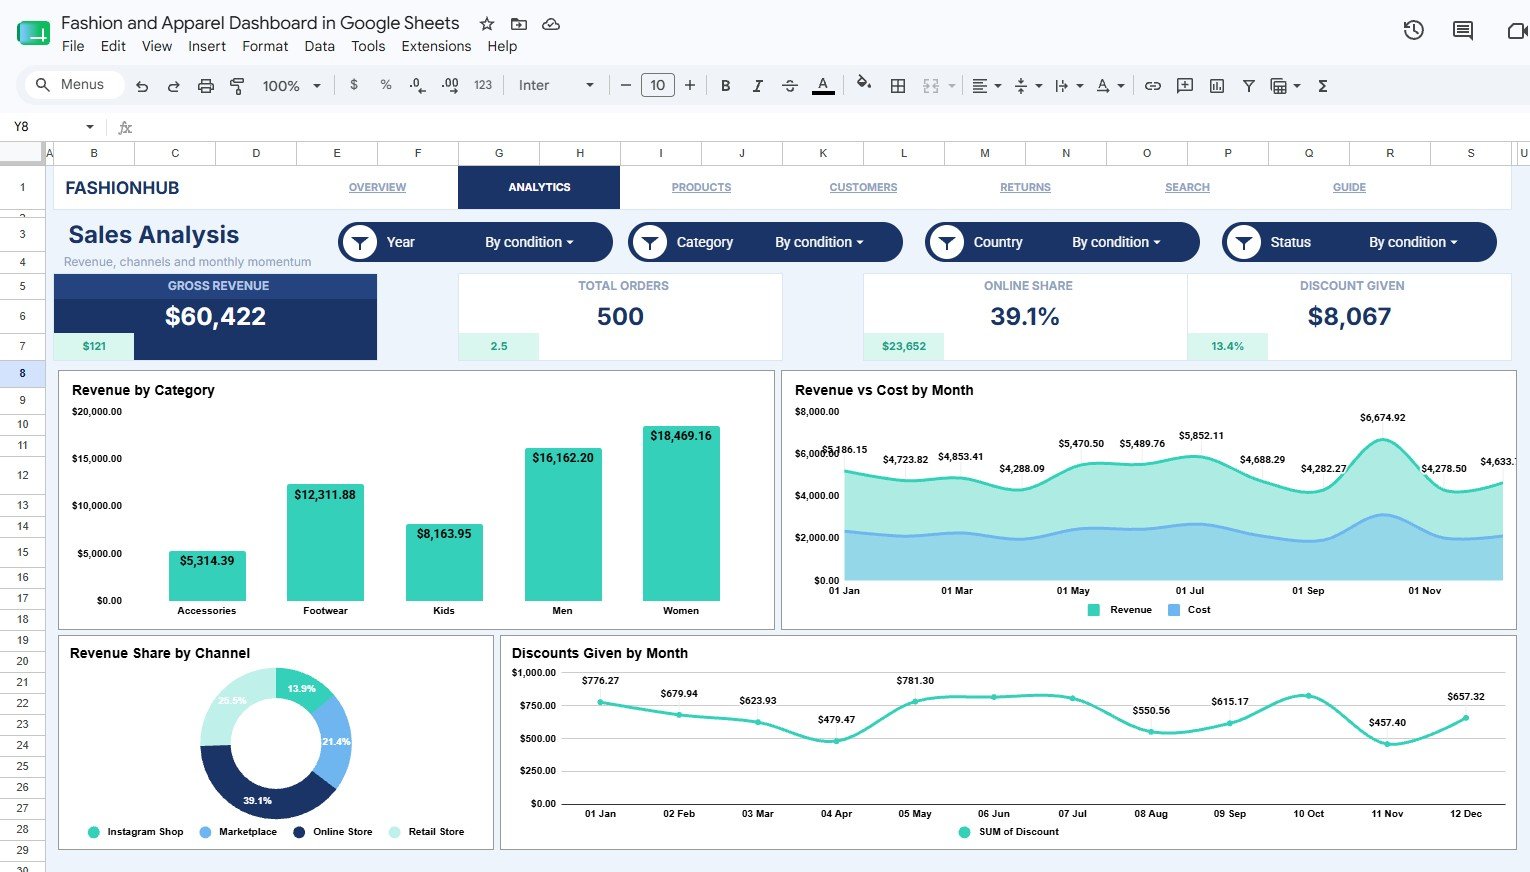
Revenue by Category: This chart compares revenue across apparel categories. It helps users see whether items such as clothing lines, accessories, or seasonal categories are carrying sales.
Revenue and Cost by Month: This chart places monthly revenue beside purchase cost. It helps identify whether growth is supported by healthy cost control.
Revenue Share by Channel: This chart shows how much revenue comes from each sales channel. It helps compare store, online, marketplace, wholesale, or other channel performance.
Discounts Given by Month: This chart tracks monthly discount value. It helps users understand when discounting increases and whether promotions may be reducing margin.
3. Products and Sizes
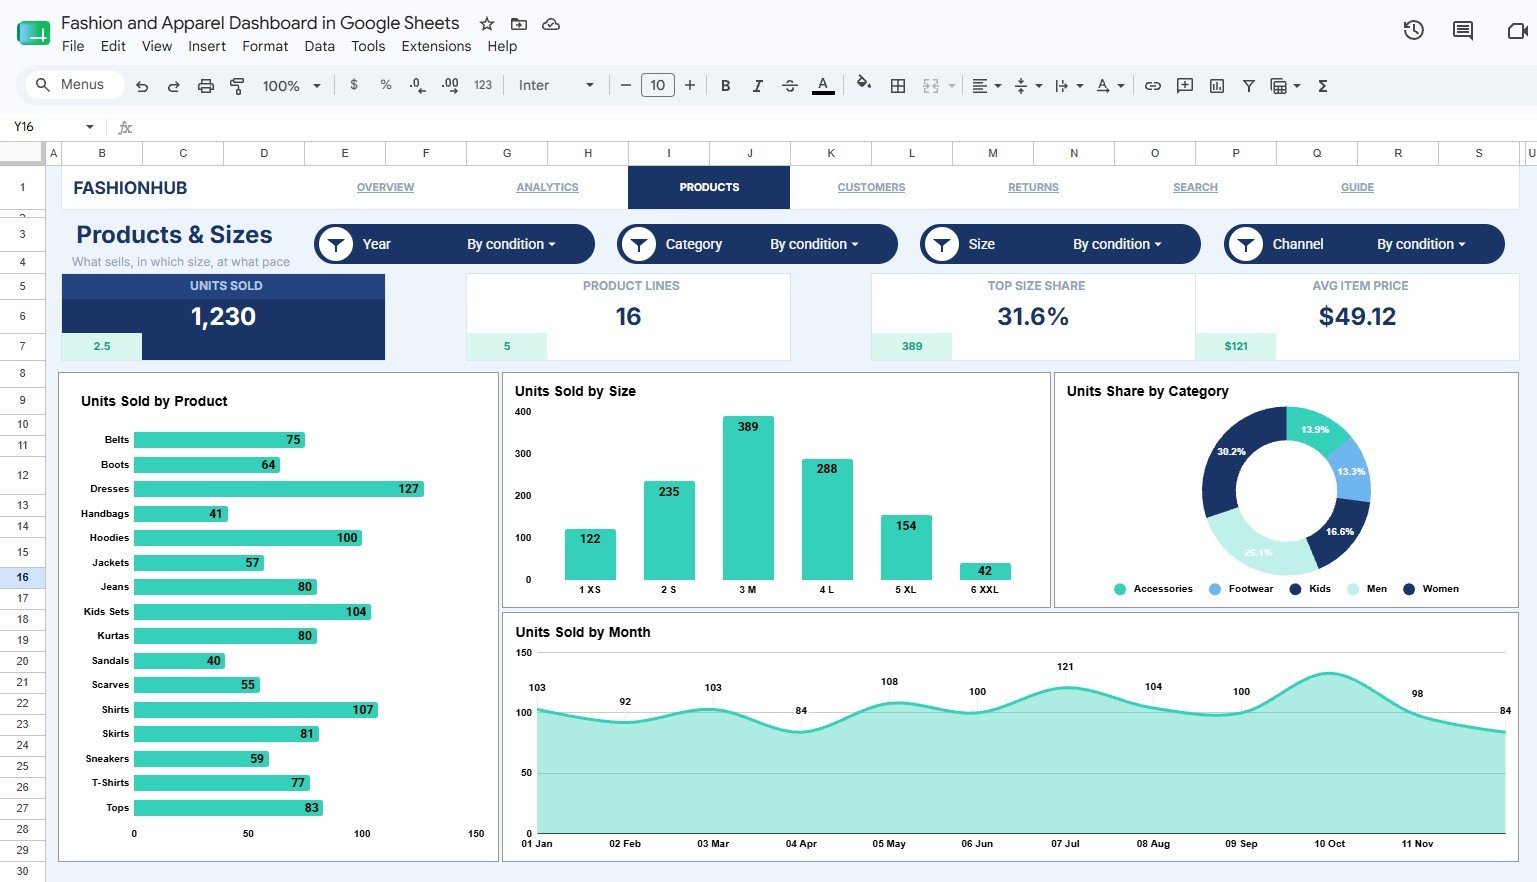
The Products and Sizes tab helps apparel teams understand item demand and size mix. It is useful for planning replenishment, reviewing top sellers, and spotting sizes that move faster than expected.
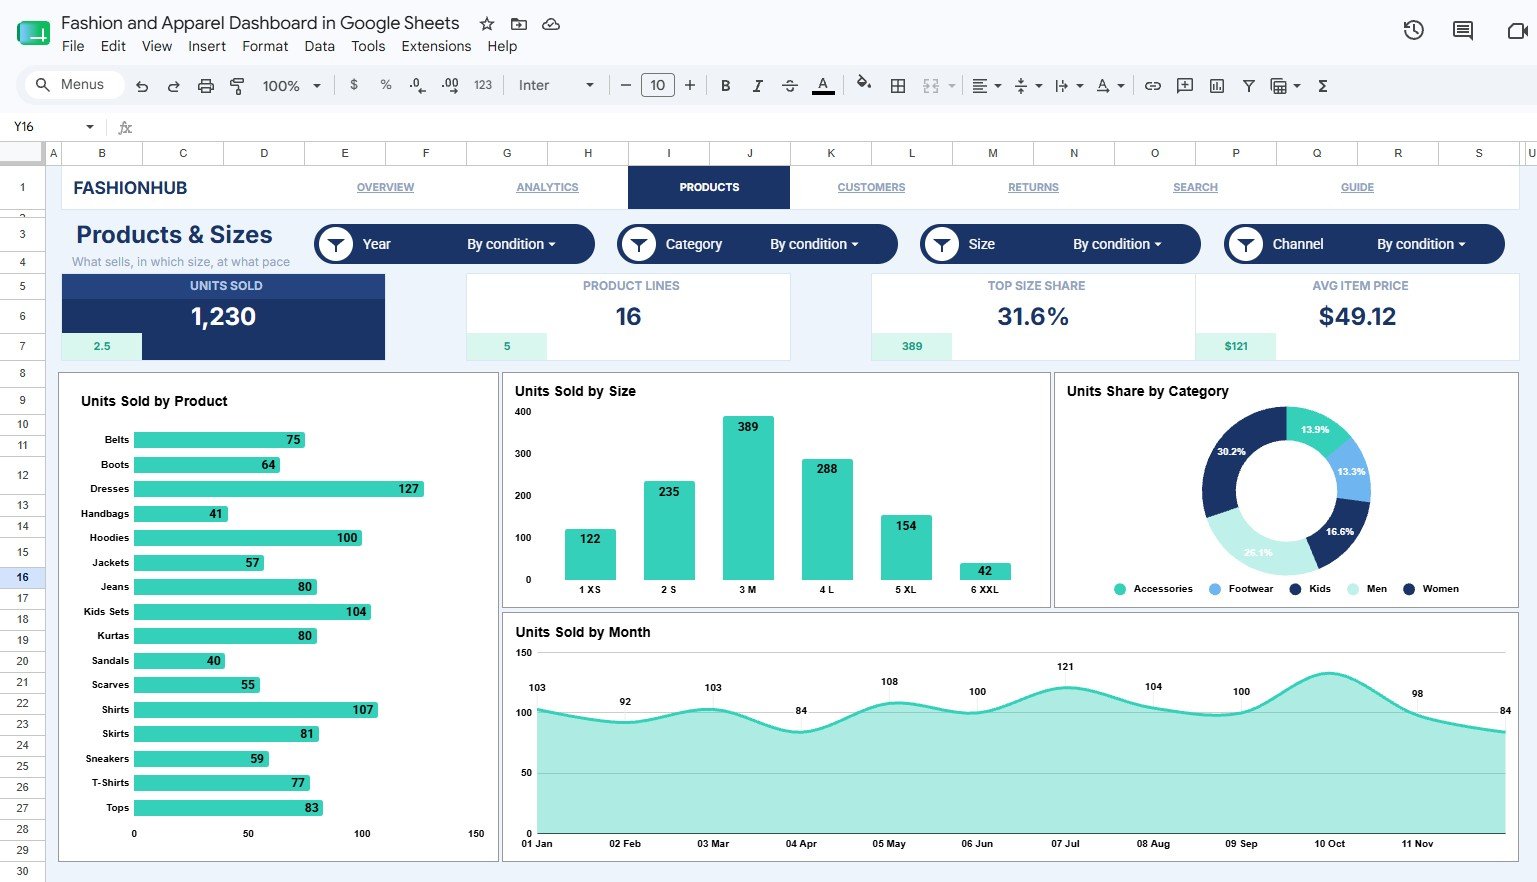
Units Sold by Product: This chart ranks products by sold units. It helps buyers and managers identify popular items and products that may need review.
Units Sold by Size: This chart compares units by size. It helps apparel teams plan size curves and avoid overstocking low-demand sizes.
Units Share by Category: This chart shows the share of units by category. It helps users understand whether unit volume is concentrated in a few product groups.
Units Sold by Month: This chart tracks monthly unit movement. It helps reveal seasonality, demand spikes, and slower periods.
4. Customers and Regions
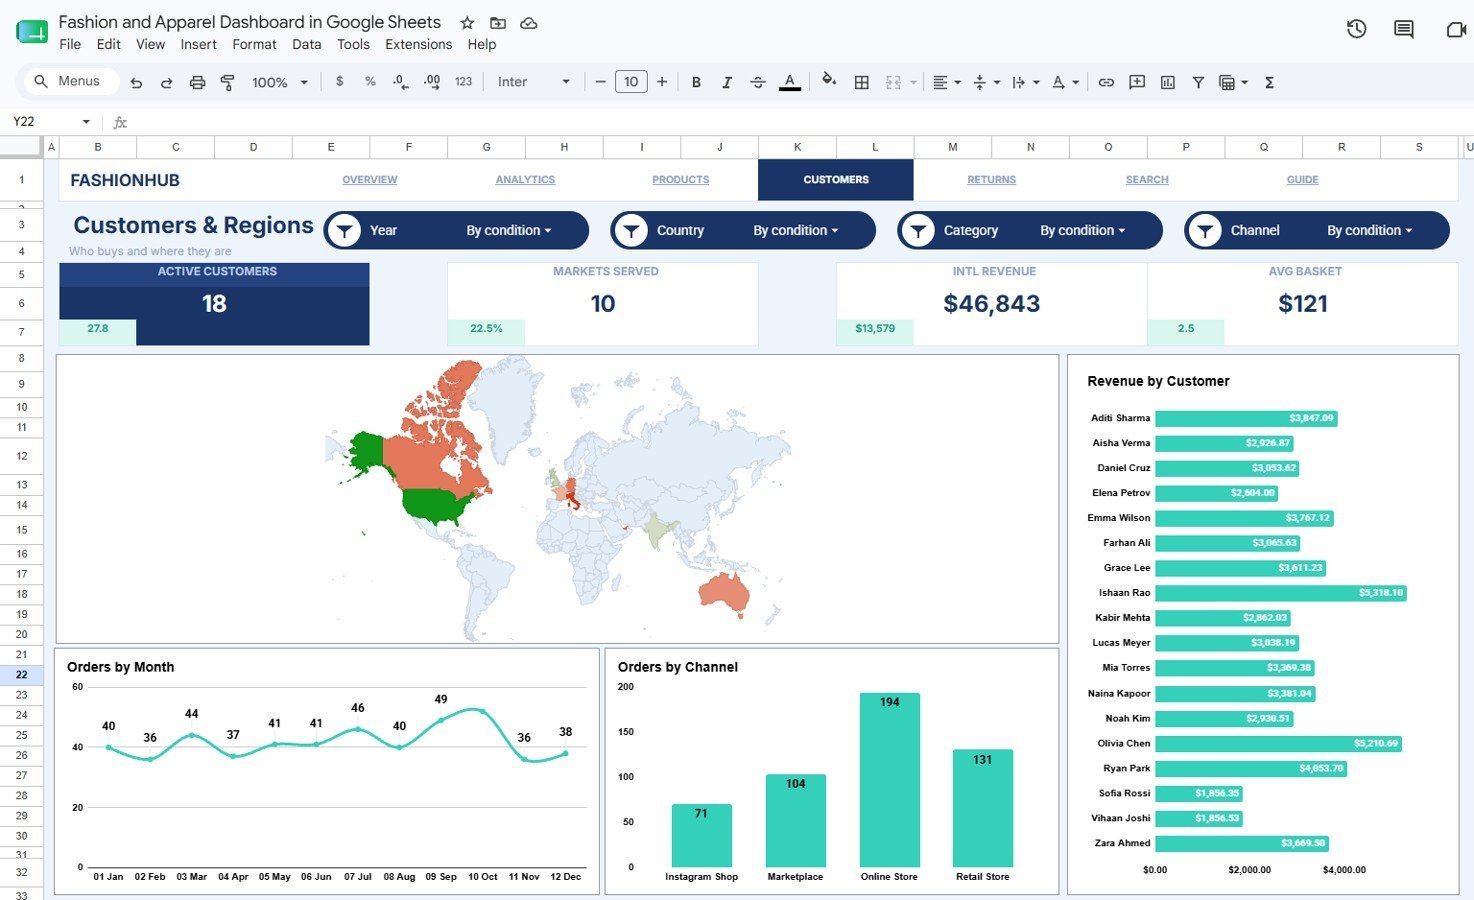
The Customers and Regions tab connects customer behavior with geography and channels. It helps teams understand who buys, where orders come from, and how customer demand changes by month.
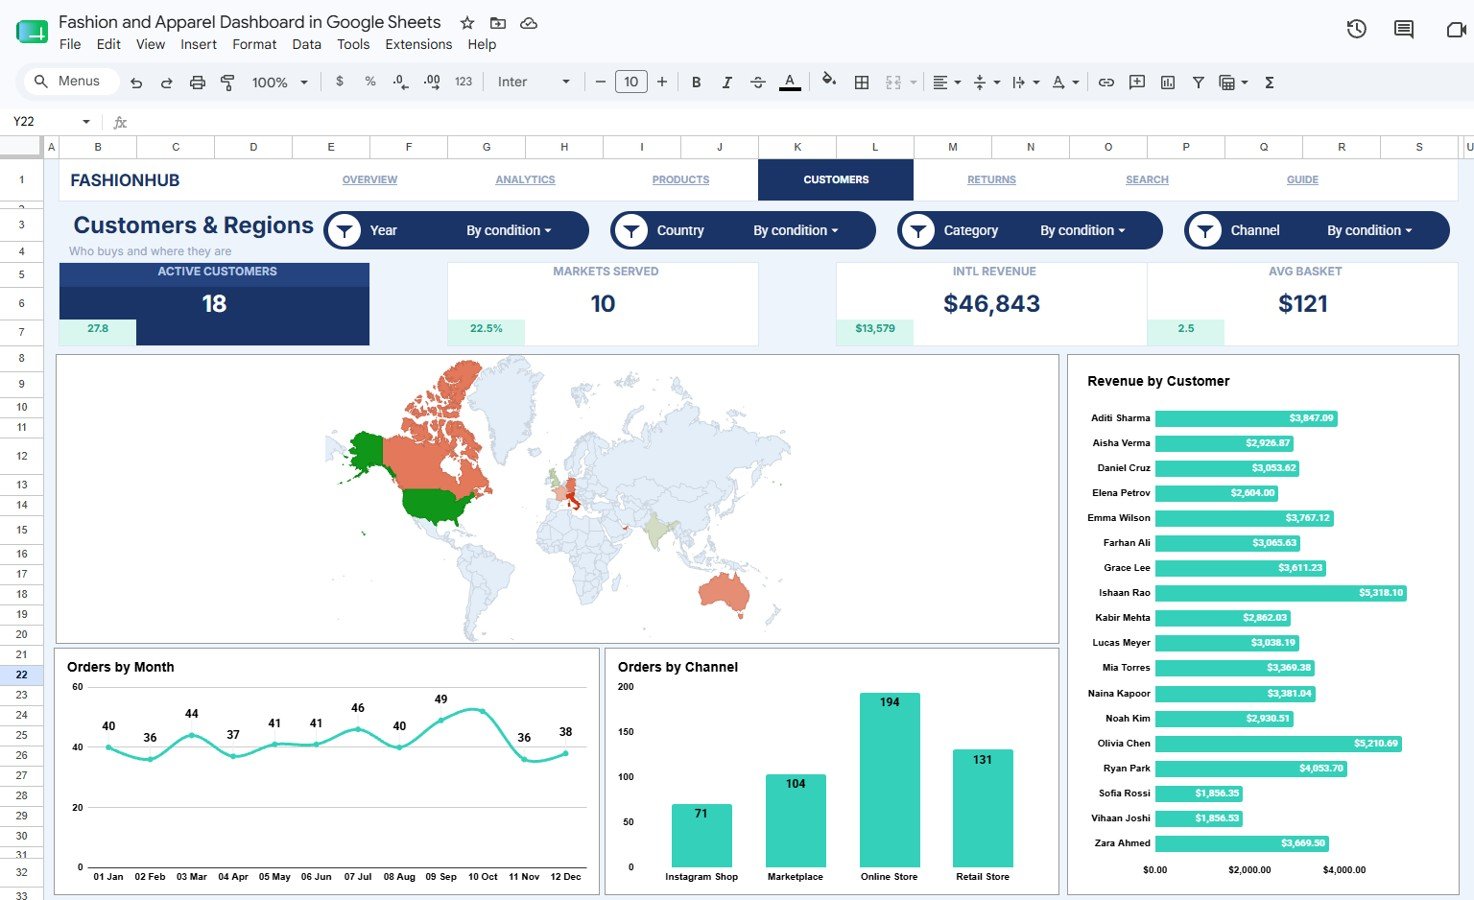
Revenue by Country: This chart compares revenue across countries. It helps identify regions that drive higher sales value, not only higher order volume.
Revenue by Customer: This chart ranks customers by revenue. It helps users review high-value customers and potential repeat buyer segments.
Orders by Month: This chart shows order movement over time. It helps teams compare recent demand with earlier periods.
Orders by Channel: This chart compares order count by channel. It helps users understand where customers are placing orders most often.
5. Returns and Operations
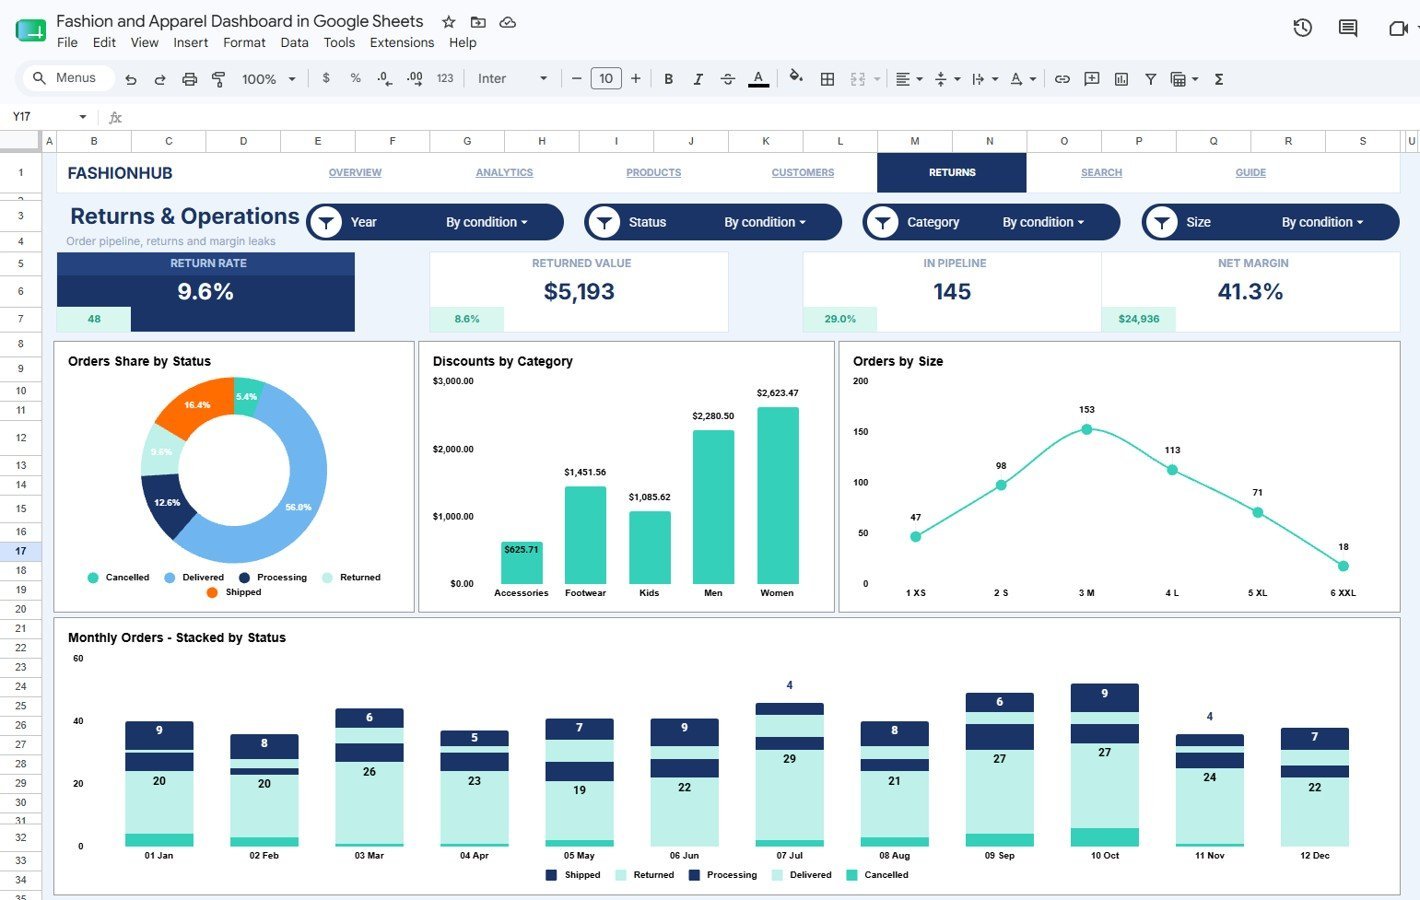
The Returns and Operations tab reviews order status, discounts, sizes, and monthly order movement. It is useful for spotting operational issues and understanding how many orders reach completion.
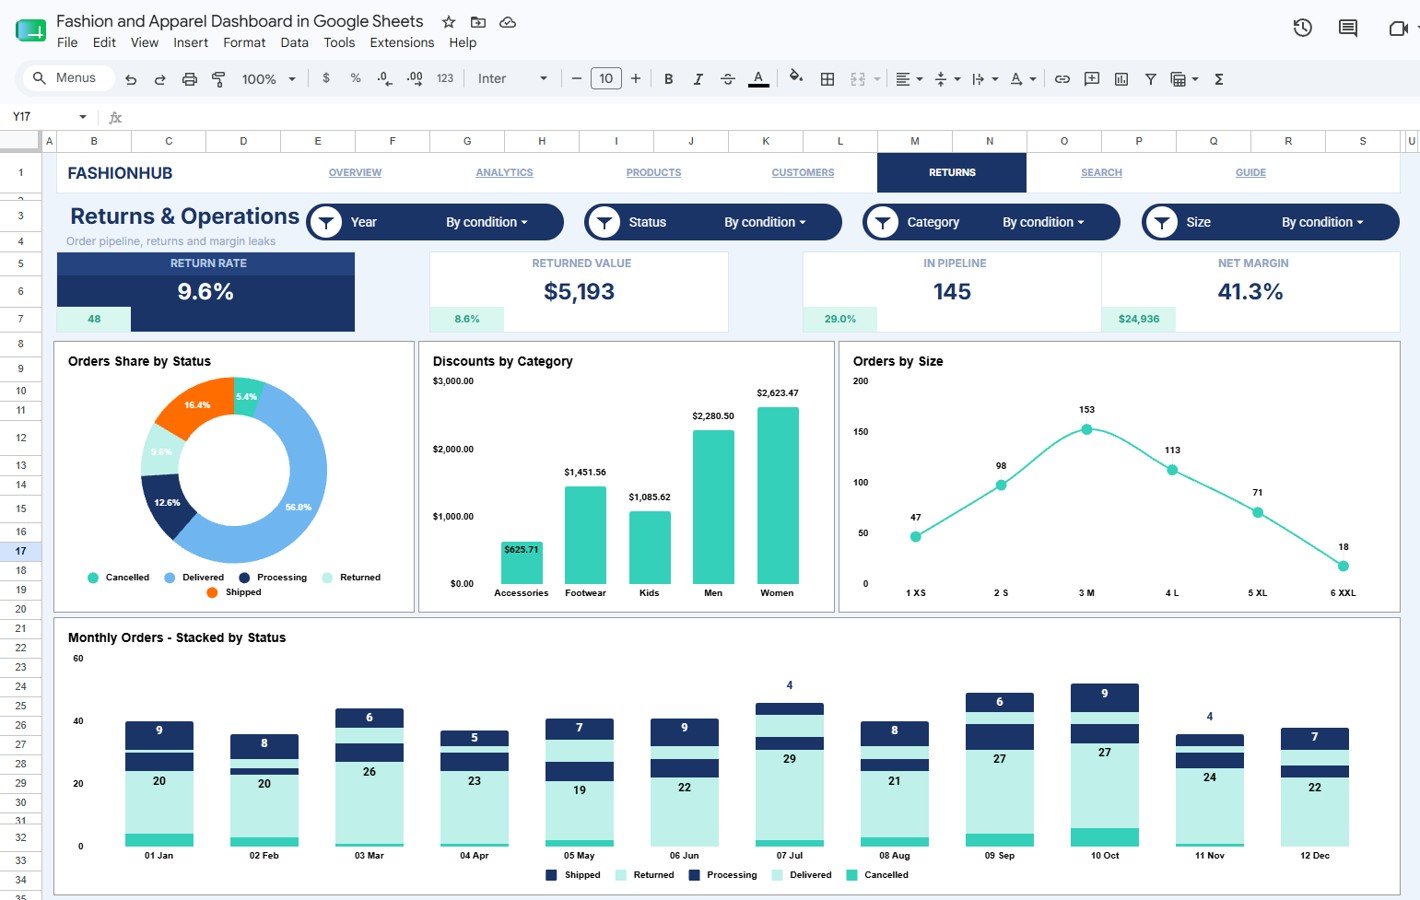
Orders Share by Status: This chart shows the share of orders by status. It helps users compare delivered, returned, pending, or other order states.
Discounts by Category: This chart compares discount value by category. It helps teams see which apparel groups rely most on price reductions.
Orders by Size: This chart compares order count by size. It helps operational teams understand size demand from an order-volume perspective.
Orders by Month and Status: This chart tracks monthly orders split by status. It helps reveal whether returns, pending orders, or delivered orders are changing over time.
6. Order Search
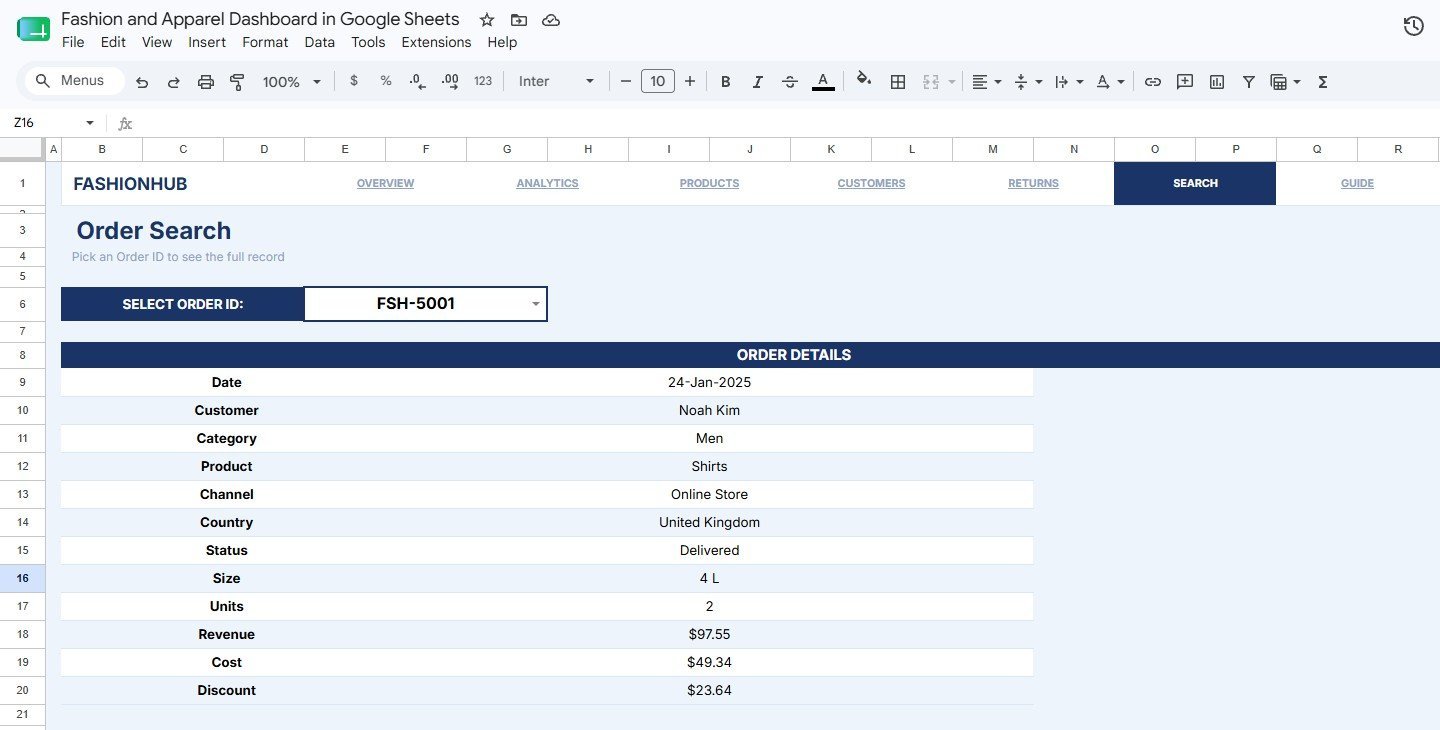
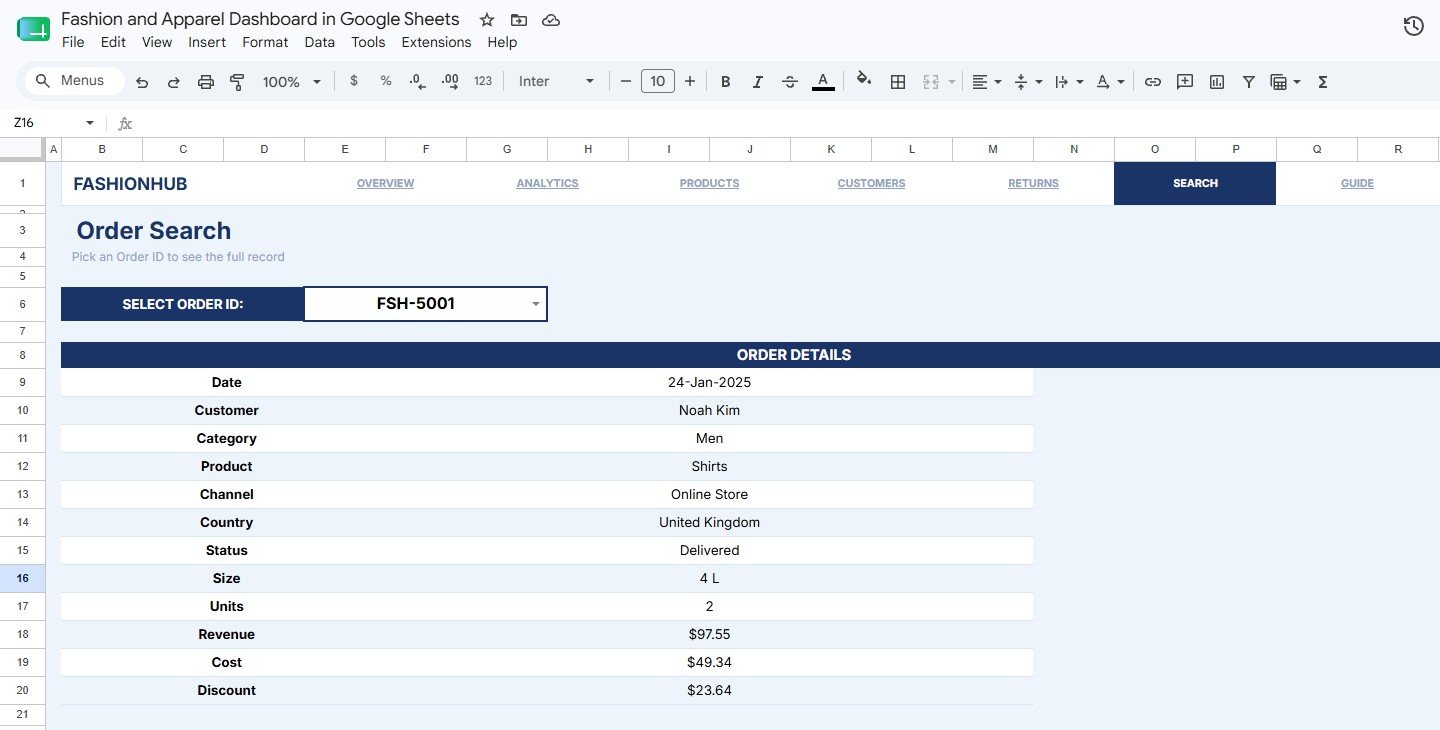
The Order Search tab lets users select an Order ID from the dropdown and instantly view the full order record. Visible fields include Date, Customer, Category, Product, Channel, Country, Status, Size, Units, Revenue, Cost, and Discount.
7. Data Sheet Tab
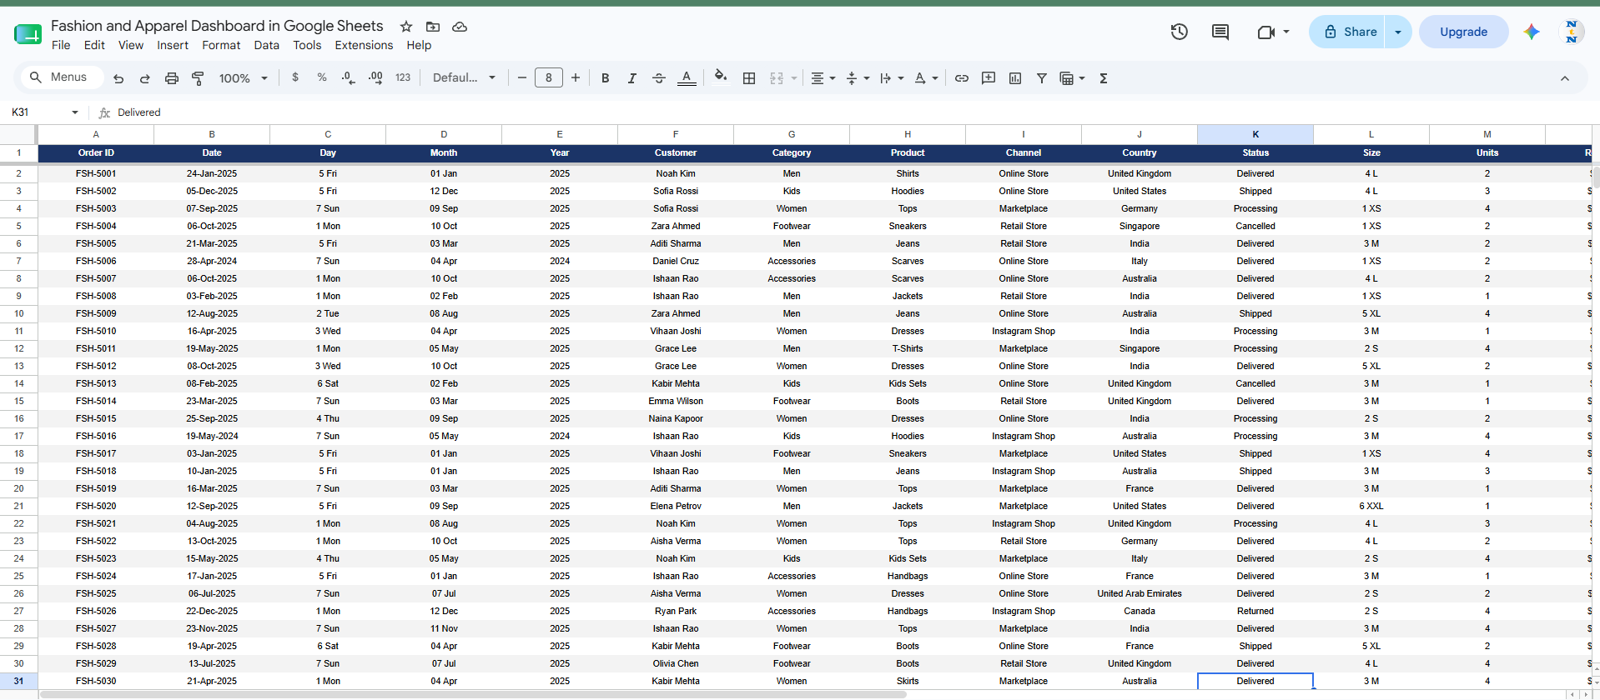
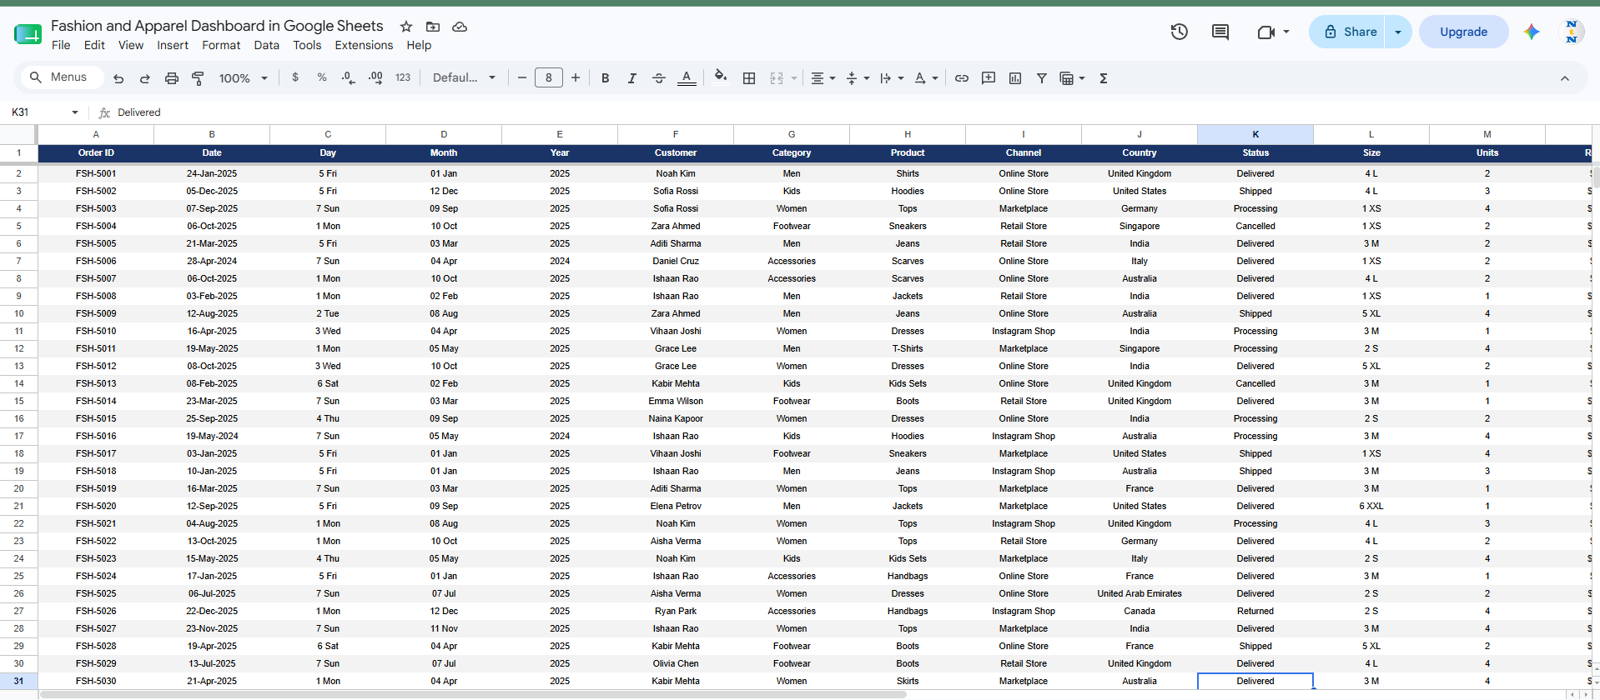
The Data Sheet is where users add fashion and apparel order records in the same format used by the dashboard. Keeping dates, customers, categories, products, channels, countries, statuses, sizes, units, revenue, cost, and discount fields consistent keeps slicers and charts clean.
Fashion and Apparel Dashboard in Google Sheets vs. Microsoft Excel Dashboard vs. Paid Retail SaaS – Where This Fits
| Feature | This Google Sheets template | Microsoft Excel dashboard | Paid retail SaaS |
|---|---|---|---|
| Cost | $9.99 sale price | Template cost plus Excel access | Monthly or annual subscription |
| Platform | Google Sheets in the browser | Excel desktop or web | Vendor-hosted app |
| Setup time | Copy file and replace sample rows | Download workbook and adapt ranges | Account setup, imports, roles, and onboarding |
| Real-time team collaboration | Native Google Drive sharing | Available with OneDrive or SharePoint | Usually included by paid seat |
| Mobile access | Google Sheets app or browser | Excel app or browser | Usually available |
| Customizable fields | Edit rows, labels, formulas, and charts | Editable workbook | Limited by plan settings |
| Share with link | Yes, through Drive permissions | Yes, through Microsoft cloud sharing | Often invite-based |
| Year-1 cost at 5 users | $9.99 template price, excluding Google account costs | Depends on Microsoft licensing | Often hundreds or thousands per year |
| Order ID lookup | Included Search Sheet | Possible with formulas | Usually tied to platform records |
| Fashion size analysis | Included Products and Sizes tab | Must be built or customized | Depends on retail plan features |
Who This Template Is For – and Who It’s Not For
Best for: boutique owners, apparel retailers, fashion ecommerce sellers, marketplace sellers, store managers, merchandising analysts, and small teams that want a clear spreadsheet dashboard for sales and order reporting.
Not the right fit for: teams needing live POS integrations, automatic inventory sync, payment processing, barcode scanning, warehouse routing, customer messaging, or enterprise role controls. This template analyzes the data you enter; it is not a full retail management system.
How to Use the Fashion and Apparel Dashboard in Google Sheets
- Open the PDF guide from your download and use the Google Sheets copy link.
- Create your own editable copy in Google Drive.
- Go to the Data Sheet and replace the sample rows while preserving the column order.
- Use consistent names for categories, products, channels, countries, statuses, and sizes.
- Review the Overview page first, then use the analysis tabs for deeper review.
- Select an Order ID on the Order Search tab when you need one complete record.
Real-World Use Cases
Maya, boutique owner: Maya filters the dashboard by channel and reviews Revenue by Weekday before planning weekend promotions.
Arjun, apparel operations lead: Arjun uses Orders by Month and Status to see whether pending or returned orders are increasing after a campaign.
Priya, fashion ecommerce analyst: Priya reviews Units Sold by Size and Revenue by Category before recommending replenishment priorities.
Frequently Asked Questions
What does the Fashion and Apparel Dashboard in Google Sheets track?
It tracks sales, purchase cost, unit growth, customer volume, delivered orders, revenue, discounts, countries, customers, products, sizes, channels, statuses, and month-level order movement.
Does this dashboard include an order search feature?
Yes. The Order Search tab lets you select an Order ID and view the matching record with date, customer, category, product, channel, country, status, size, units, revenue, cost, and discount.
Can I use this template with my team?
Yes. After copying the file to Google Drive, you can share it with selected teammates using normal Google Sheets permissions.
Does it import orders automatically?
No. You enter or paste order records into the Data Sheet. If you export data from Shopify, WooCommerce, POS software, or a marketplace, prepare it in the same column structure before pasting.
Can I customize the dashboard?
Yes. The file is editable, but keep formulas, slicer ranges, chart ranges, and source columns aligned when making structural changes.
Is this a one-time purchase?
Yes. It is sold as a one-time template purchase on NextGenTemplates and does not require a recurring dashboard subscription.
About the Author
Built by PK – Microsoft Certified Professional with 15+ years of Excel, Google Sheets, and Power BI experience. Founder of NextGenTemplates, reaching 300K+ subscribers across YouTube channels. Every template is hand-built and tested before release.
Explore Related Templates
- Fashion KPI Dashboard in Google Sheets
- Fashion KPI Scorecard in Google Sheets
- Retail Profit Margin KPI Dashboard in Google Sheets
- Baby Products Retail Dashboard in Power BI
- Browse more Google Sheets dashboard templates and Sales and Marketing Google Sheets templates.
Ready to turn fashion order data into clear reporting? Add the Fashion and Apparel Dashboard in Google Sheets to your toolkit and review sales, costs, products, customers, regions, returns, and order records from one editable workbook.
Watch the step-by-step video Demo:
Last updated: July 31, 2026.