

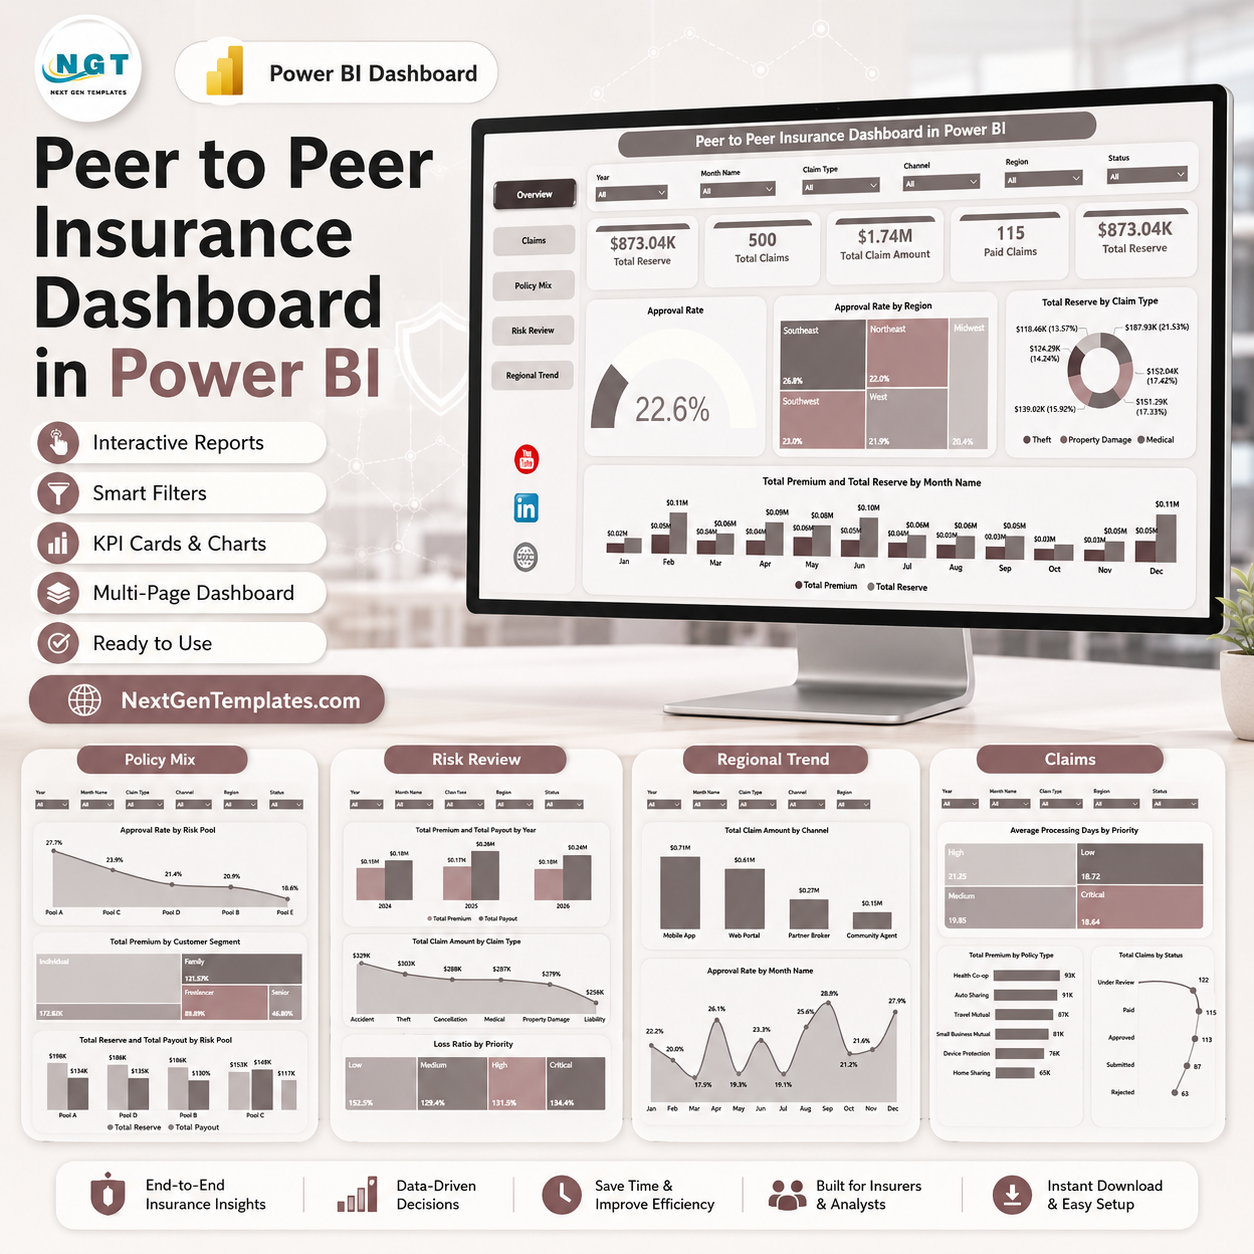

Peer to Peer Insurance Dashboard in Power BI is an editable PBIX reporting template for insurance teams that need a quicker way to review reserves, claims, claim amounts, paid claims, premiums, approvals, risk pools, policy mix, payouts, loss ratio, channels, regions, and monthly trends. IndustryARC forecasts the peer-to-peer insurance market to reach $2.36 billion by 2030, with a 32.4% CAGR from 2024 to 2030, so small insurance models and community-based risk pools need clear reporting discipline. This one-time downloadable template gives you 5 focused Power BI pages, ready-made visuals, slicers, instant file access, and a practical starting point without building the report from a blank canvas.
Key Features of Peer to Peer Insurance Dashboard in Power BI
- 5 Power BI pages: Overview, Claims, Policy Mix, Risk Review, and Regional Trend.
- Executive KPI cards: Total Reserve, Total Claims, Total Claim Amount, and Paid Claims for fast leadership review.
- Claims analysis: Track approval rate, processing days, claim status, claim type, paid claims, and claim amount.
- Policy and premium review: Compare premium by policy type, customer segment, month, year, and risk pool.
- Risk pool reporting: Review reserve, payout, approval rate, loss ratio, and priority movement.
- Interactive slicers: Filter the report quickly during claims, finance, regional, and underwriting discussions.
- Editable PBIX file: Open in Power BI Desktop, replace the sample data, refresh, and customize pages, measures, slicers, and visuals.
What’s Inside the Peer to Peer Insurance Dashboard in Power BI
1 – Overview Page
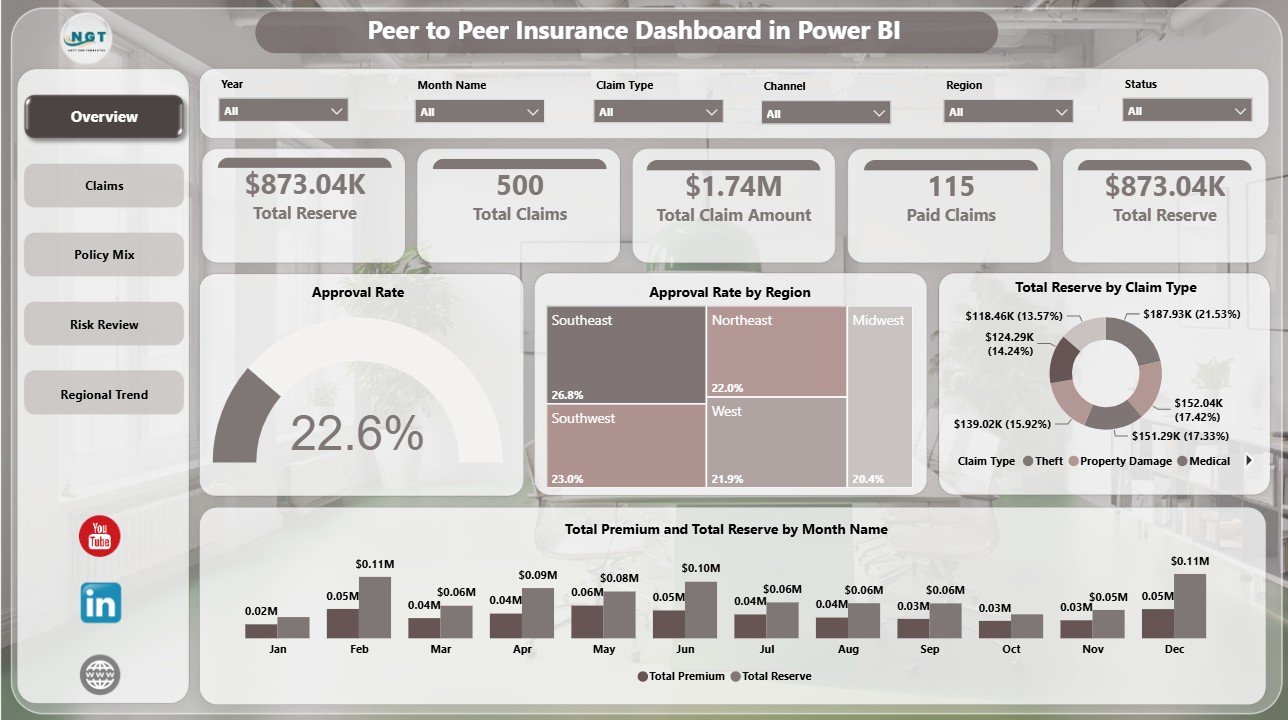
The Overview page gives decision-makers a high-level view of peer-to-peer insurance operations. The top cards show reserve, claims volume, claim amount, and paid claims so users can see financial exposure and claims activity before moving into page-level analysis.
Approval Rate by Overall Claims: This chart compares approval rate against overall claims activity. It helps claims leaders understand whether approval outcomes are moving in line with claim volume.
Approval Rate by Region: This visual shows how approval performance differs by region. It helps teams identify regional underwriting or claims review patterns that may need follow-up.
Total Reserve by Claim Type: This chart breaks total reserve by claim type. It helps finance and risk teams understand which claim categories are holding the largest reserve amounts.
Total Premium and Total Reserve by Month Name: This monthly trend compares premium and reserve movement. It helps teams review whether collected premium is aligned with reserve pressure over time.
2 – Claims
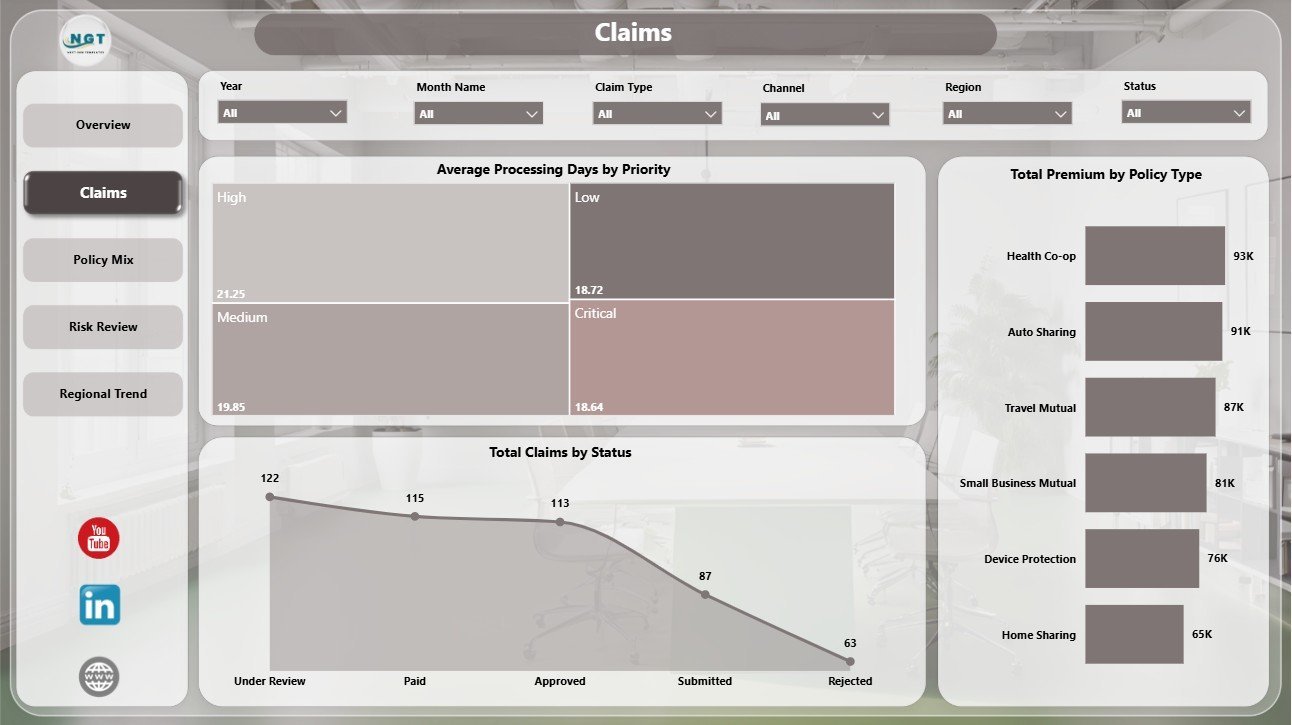
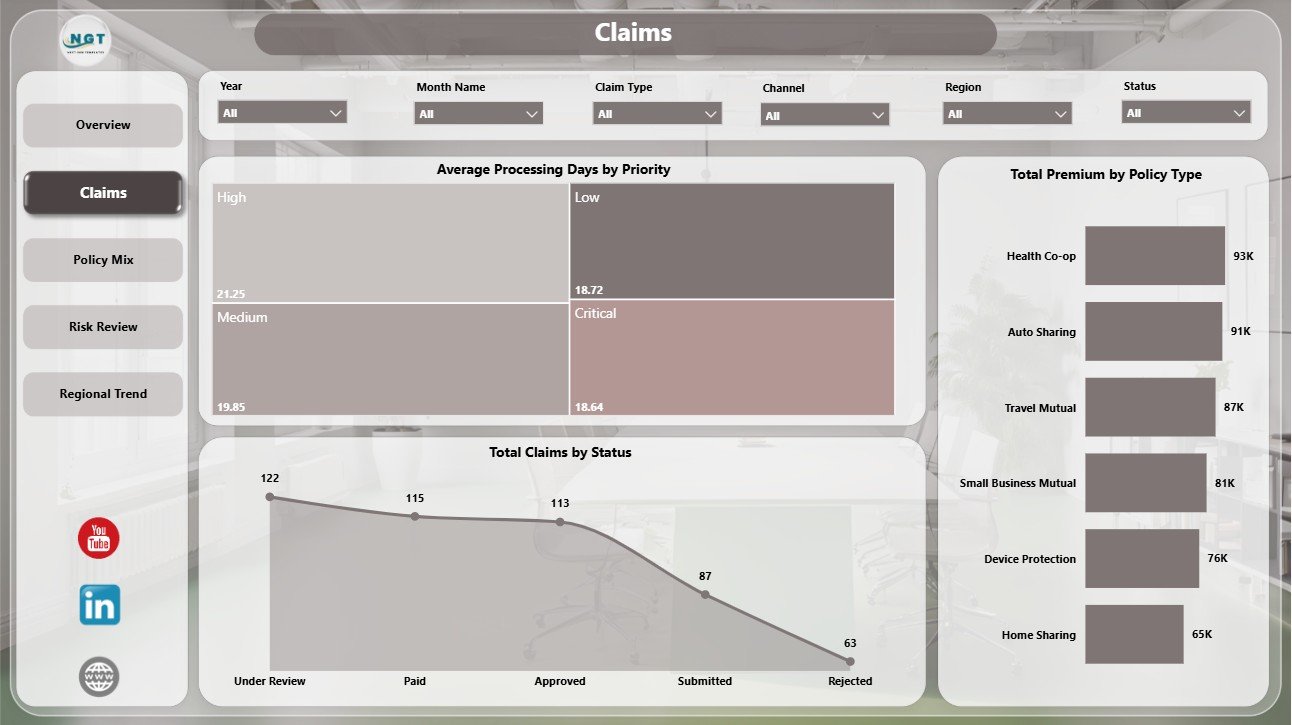
The Claims page is built for operational claims review. Average Processing Days by Priority shows how long claims take by priority level and helps spot urgent queues that need attention. Total Claims by Status explains claim workload by status, while Total Premium by Policy Type connects claims analysis with premium distribution.
3 – Policy Mix
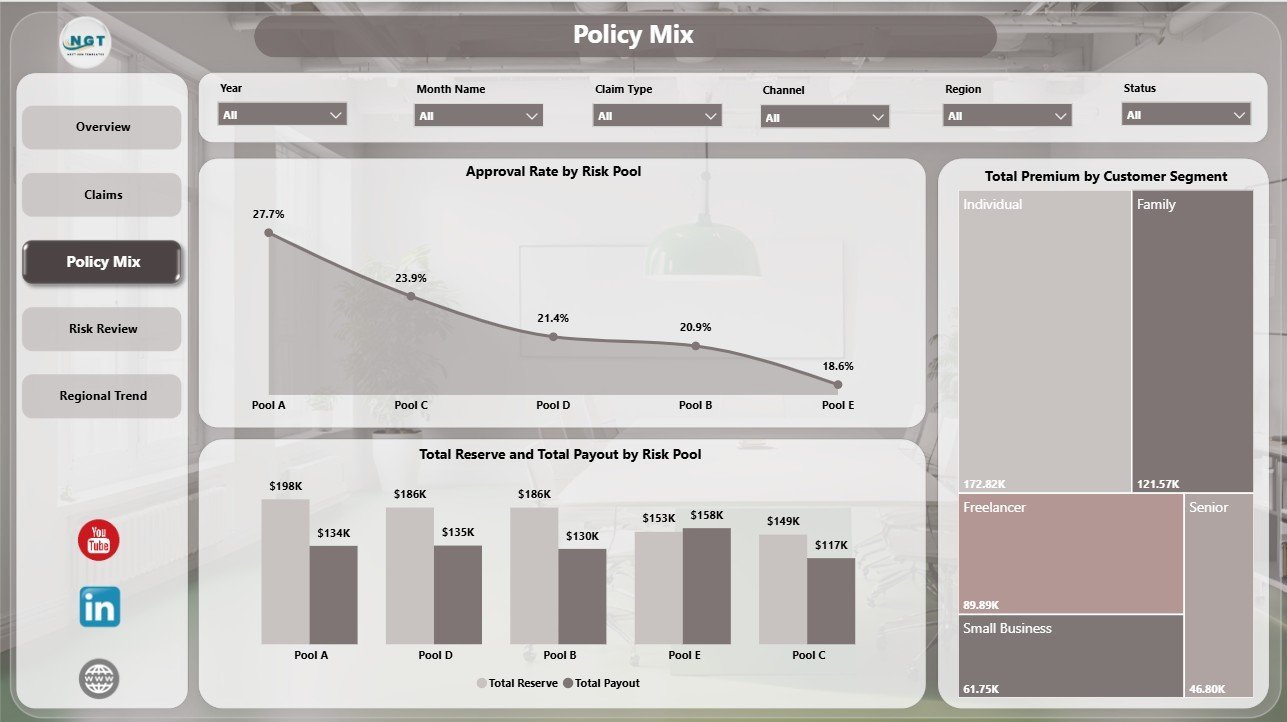
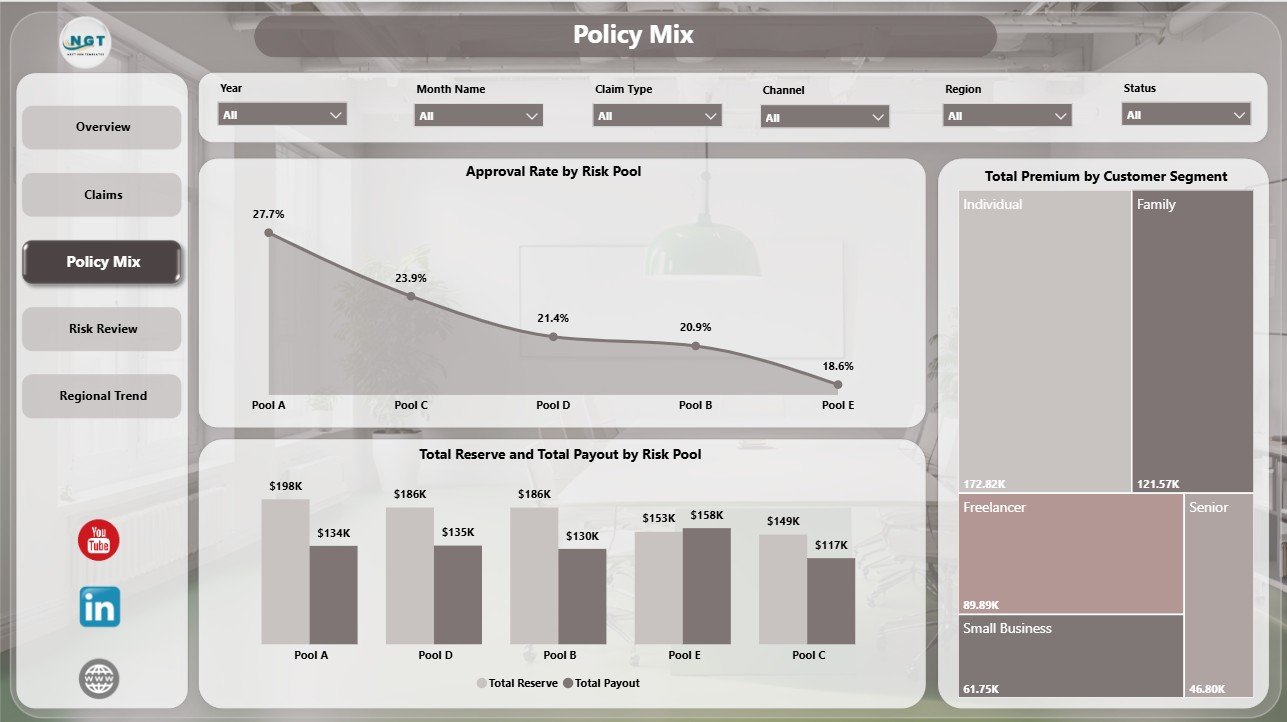
The Policy Mix page focuses on risk pools, payout, reserve, premium, and customer segmentation. Approval Rate by Risk Pool compares approval performance across pools. Total Reserve and Total Payout by Risk Pool helps teams review exposure and payout pressure. Total Premium by Customer Segment shows which customer groups contribute the most premium.
4 – Risk Review
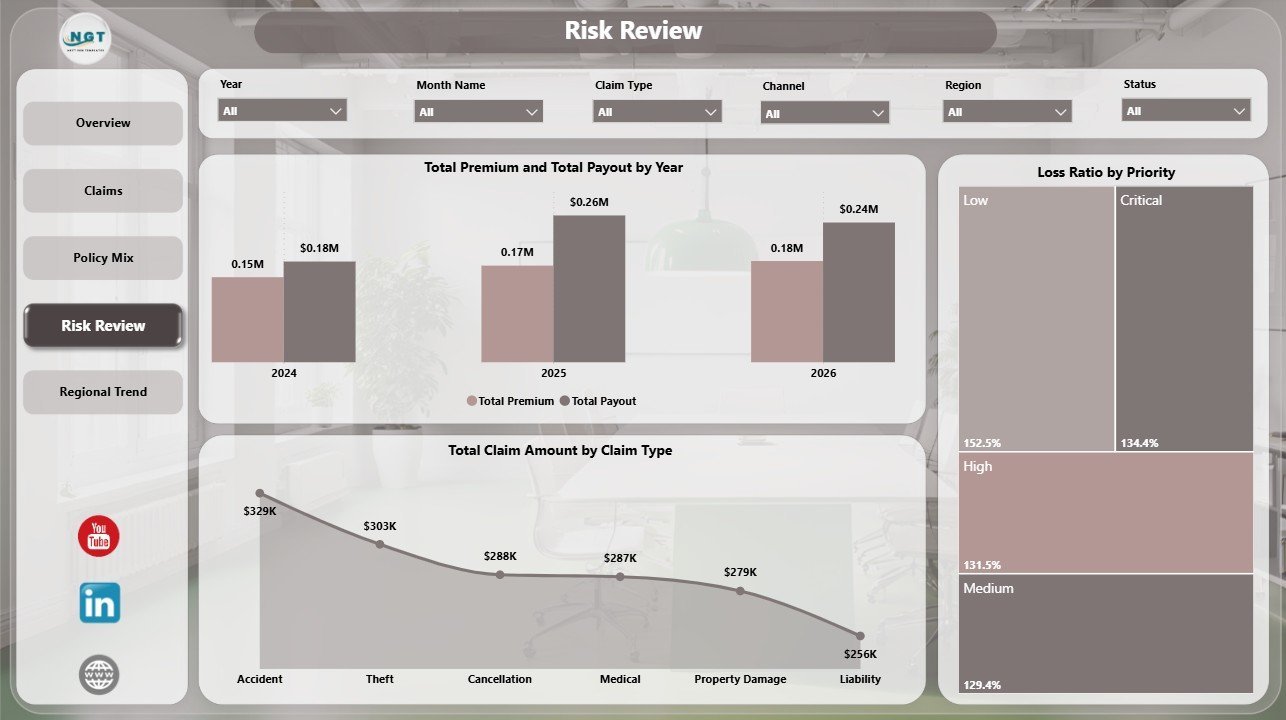
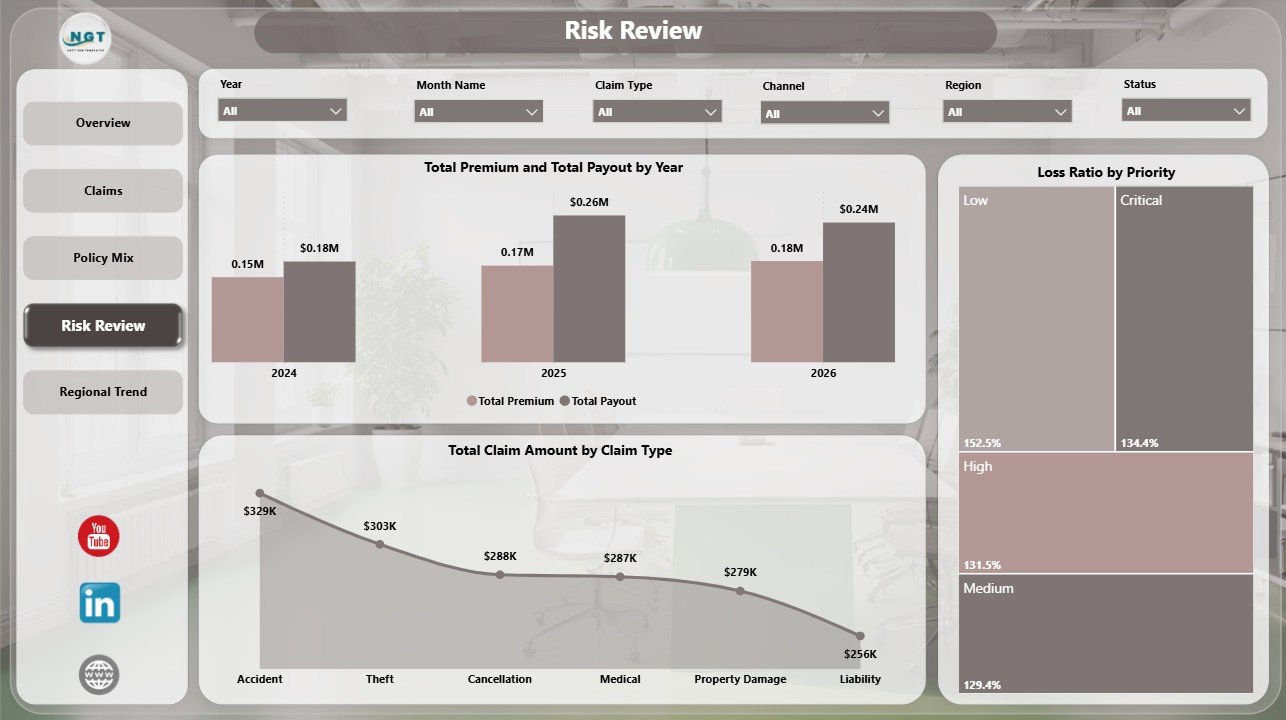
The Risk Review page supports finance, underwriting, and portfolio review. Total Premium and Total Payout by Year shows annual movement in funding and payout. Total Claim Amount by Claim Type highlights claim categories with larger claim amount exposure. Loss Ratio by Priority helps users compare risk performance by priority level.
5 – Regional Trend
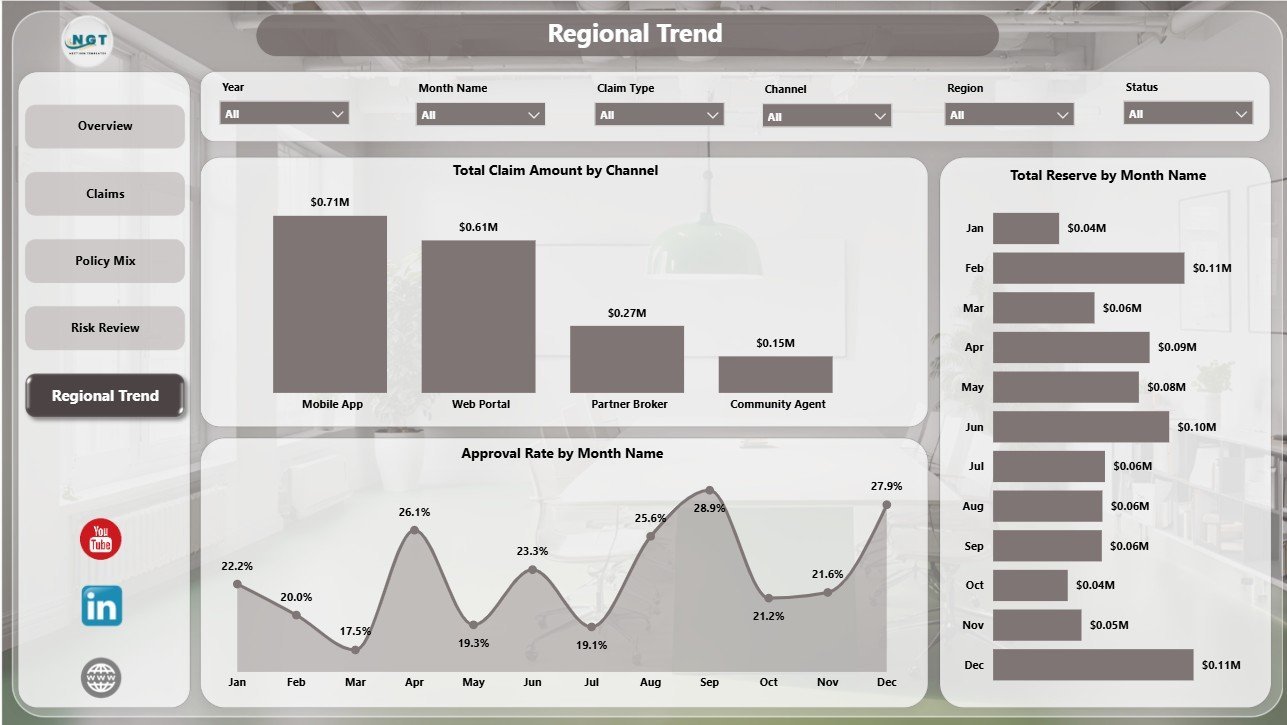
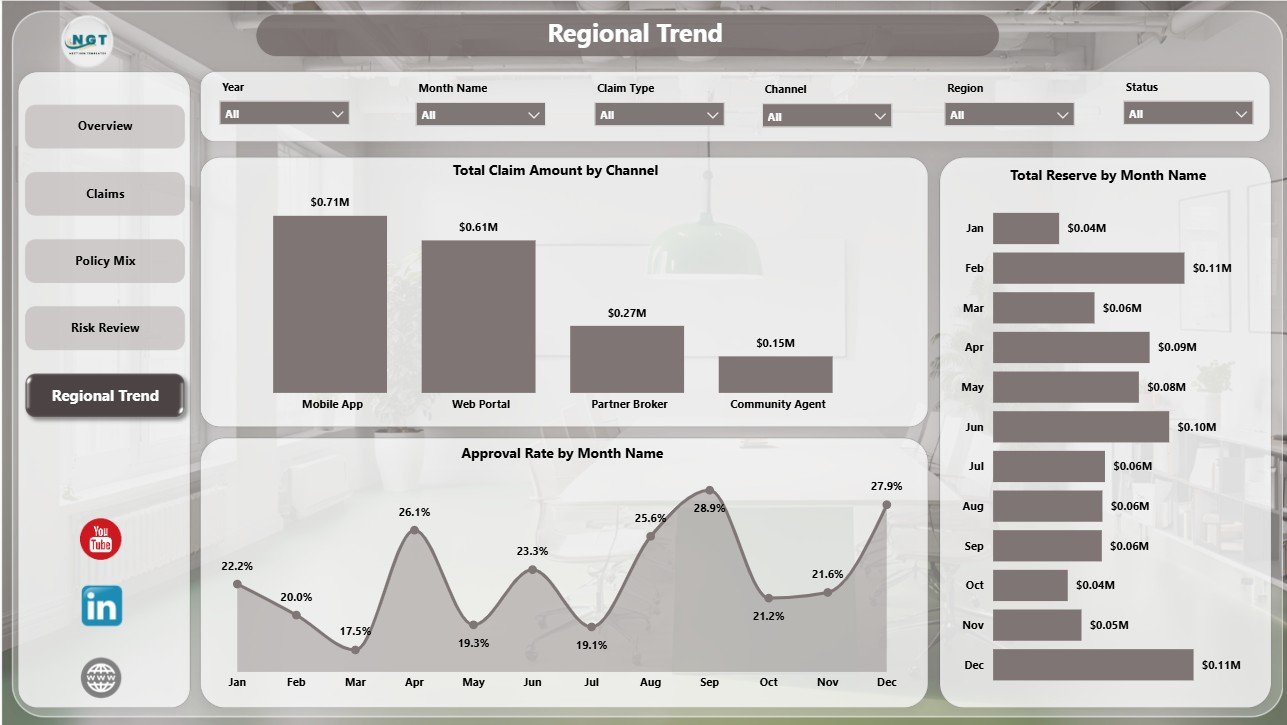
The Regional Trend page is designed for channel and monthly trend monitoring. Total Claim Amount by Channel compares claim amount across channels. Approval Rate by Month Name tracks monthly approval movement. Total Reserve by Month Name helps teams monitor reserve changes across the reporting period.
Peer to Peer Insurance Dashboard in Power BI vs. Tableau vs. Paid Insurance SaaS – Where This Fits
| Feature | This Power BI dashboard | Tableau or Qlik alternative | Paid insurance SaaS |
|---|---|---|---|
| Cost | $17.99 sale price, one-time | License cost plus analyst build time | Monthly or annual subscription |
| Platform | Power BI Desktop and optional Power BI Service | Tableau or Qlik environment | Vendor cloud platform |
| Setup time | Open PBIX, replace or connect data, refresh | Build model, measures, and visuals manually | Implementation and configuration |
| Real-time team collaboration | Available after publishing to Power BI Service | Available by plan | Usually included |
| Mobile access | Power BI mobile app after publishing | Vendor mobile app | Usually included |
| Customizable fields | Edit visuals, slicers, pages, measures, and source connections | Editable with analyst skills | Often limited by vendor settings |
| Share with link | Available through Power BI permissions | Available through platform permissions | Usually login controlled |
| Year-1 cost at 5 users | Template price plus any Microsoft licensing | License cost plus build time | Often much higher |
| P2P insurance reporting | Built for reserves, claims, premiums, payouts, approvals, loss ratio, risk pools, regions, channels, and trends | Requires custom design | Depends on vendor reporting module |
Who This Template Is For – and Who It’s Not For
This template is for peer-to-peer insurance founders, claims managers, risk pool administrators, insurance analysts, finance teams, underwriting teams, and Power BI consultants who already have structured claims, premium, payout, reserve, and policy data.
It is not a policy administration system, claims adjudication engine, actuarial pricing model, compliance system, payment platform, customer portal, or live fraud detection product. Use it as an analytics layer after your operational data has been prepared.
How to Use the Peer to Peer Insurance Dashboard in Power BI
- Download and unzip the product file.
- Open the PBIX file in Power BI Desktop.
- Review the sample pages, slicers, KPI cards, and visuals.
- Replace the sample source or connect your own structured insurance dataset.
- Refresh the report and validate reserve, claims, premium, payout, approval rate, and loss ratio totals.
- Use slicers to filter by region, claim type, risk pool, priority, status, month, year, policy type, customer segment, or channel.
- Publish to Power BI Service if your team needs browser access, permissions, or scheduled refresh.
Real-World Use Cases
Neha, claims operations manager: reviews processing days, claims by status, and approval rate before weekly claims meetings.
Marcus, insurance finance analyst: compares reserve, premium, payout, and loss ratio by month, year, and risk pool for financial review.
Anita, P2P insurance founder: uses the Overview and Regional Trend pages to monitor regional approval patterns and reserve movement.
Frequently Asked Questions
What does this Power BI dashboard track?
It tracks reserves, claims, claim amount, paid claims, approval rate, processing days, premium, payout, risk pool, policy type, customer segment, loss ratio, channel, region, month, and year.
Do I need Power BI Desktop?
Yes. Open and edit the PBIX file in Power BI Desktop. Power BI Service is optional for sharing and scheduled refresh.
Can I use my own insurance data?
Yes. Replace or connect the sample data source with your structured claims, policy, reserve, premium, and payout data.
Can I customize the dashboard?
Yes. You can edit visuals, report pages, slicers, colors, measures, labels, and source connections.
Is this a claims processing system?
No. It is a reporting dashboard, not a claims workflow, adjudication, compliance, or payment system.
Is this a subscription?
No. It is a one-time downloadable Power BI template purchase.
About the Author
Built by PK – Microsoft Certified Professional with 15+ years of Excel, Google Sheets, and Power BI experience. Founder of NextGenTemplates, reaching 300K+ subscribers across YouTube channels. Every template is hand-built and tested before release.
Explore Related Templates
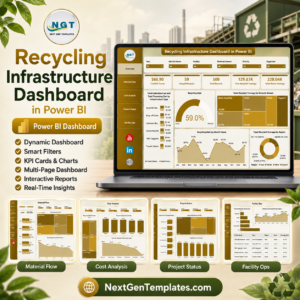
You may also like Patient Care Homes Dashboard in Power BI, Organ Donation Networks Dashboard in Power BI, and Knowledge Hubs Dashboard in Power BI. Browse more Power BI templates and Power BI dashboard templates.
Watch the demo video:
Compatibility and Requirements
- Works in Power BI Desktop, which is free. Get it from Microsoft: Get Power BI Desktop.
- The download is an editable PBIX file. Power BI Service is optional and only needed for browser access, permissions or scheduled refresh.
- Your data should be structured claims, policy, reserve, premium and payout data.
More Questions About This Template
Which pages does the dashboard include?
Five pages: Overview, Claims, Policy Mix, Risk Review and Regional Trend.
Can I filter the report by region or risk pool?
Yes. The report has interactive slicers, so you can filter by region, claim type, risk pool, priority, status, month, year, policy type, customer segment or channel.
Is there an Excel version of this dashboard?
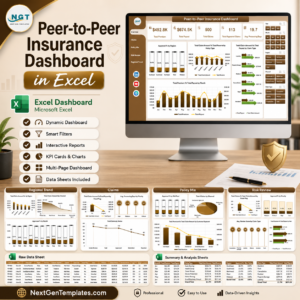
Yes. See the Peer to Peer Insurance Dashboard in Excel.
Is there another insurance dashboard in Power BI?
Yes. The Insurance Dashboard in Power BI and the Insurance Claim Dashboard in Power BI cover general insurance reporting and claims.






























Reviews
There are no reviews yet.