

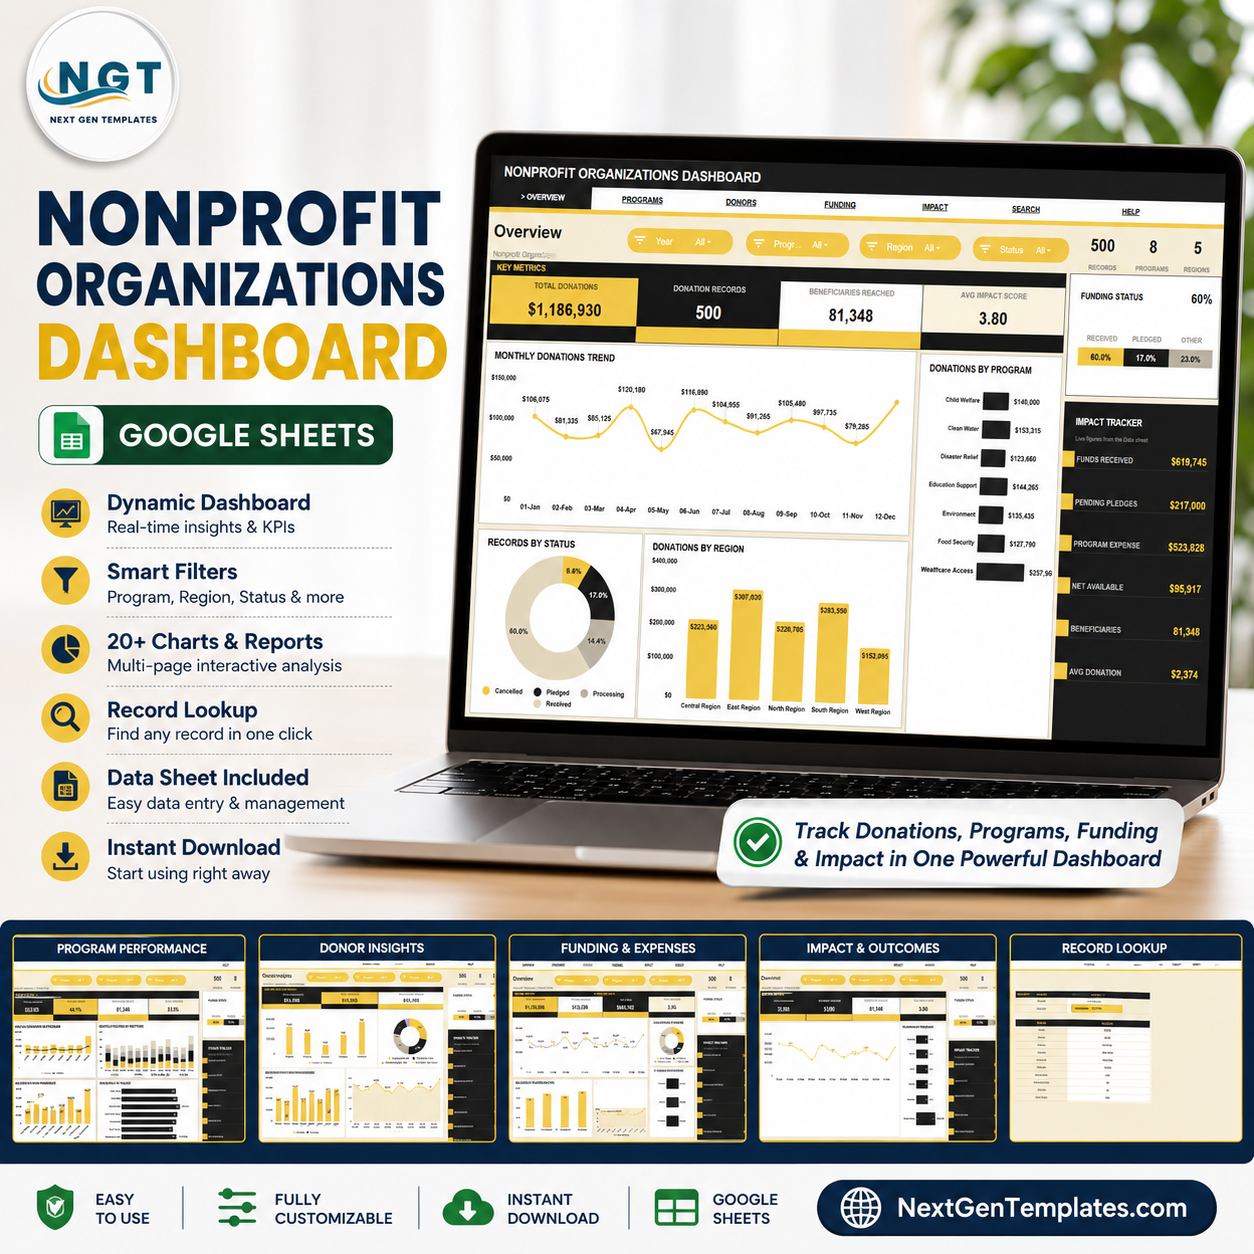

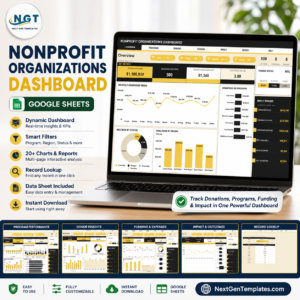
The Nonprofit Organizations Dashboard in Google Sheets tracks 13 KPI cards and 20 pre-built charts across 6 interactive pages plus a data tab. Slicers filter every chart by program, region, status, donor type and channel in one click — replace the sample data and every page recalculates in under 10 minutes.
🌍 Join 8,400+ teams in 40+ countries using NextGenTemplates to replace paid SaaS tools with one-time-purchase Excel, Google Sheets, Power BI and HTML templates.Nonprofit Organizations Dashboard in Google Sheets
✅ Instant download · One-time payment · No subscription · No per-user fees · Lifetime access
🔑 Key Features of the Nonprofit Organizations Dashboard
- 🔹 13 live KPI cards – Total Donations, Donation Records, Beneficiaries Reached, Avg Impact Score, Programs, Regions, Funds Received, Pending Pledges, Program Expense, Net Available and Avg Donation refresh the moment you add a row.
- 🔹 20 pre-built charts – Donations by Month, Records by Status, Donations by Region, Donations by Program, Beneficiaries by Program and Impact Score by Month sit alongside 14 more across five analysis pages.Nonprofit Organizations Dashboard in Google Sheets
- 🔹 Native slicers on every page – Filter charts and cards by Program, Region, Status, Donor Type, Channel or Coordinator in a single click, with no formulas to touch.Nonprofit Organizations Dashboard in Google Sheets
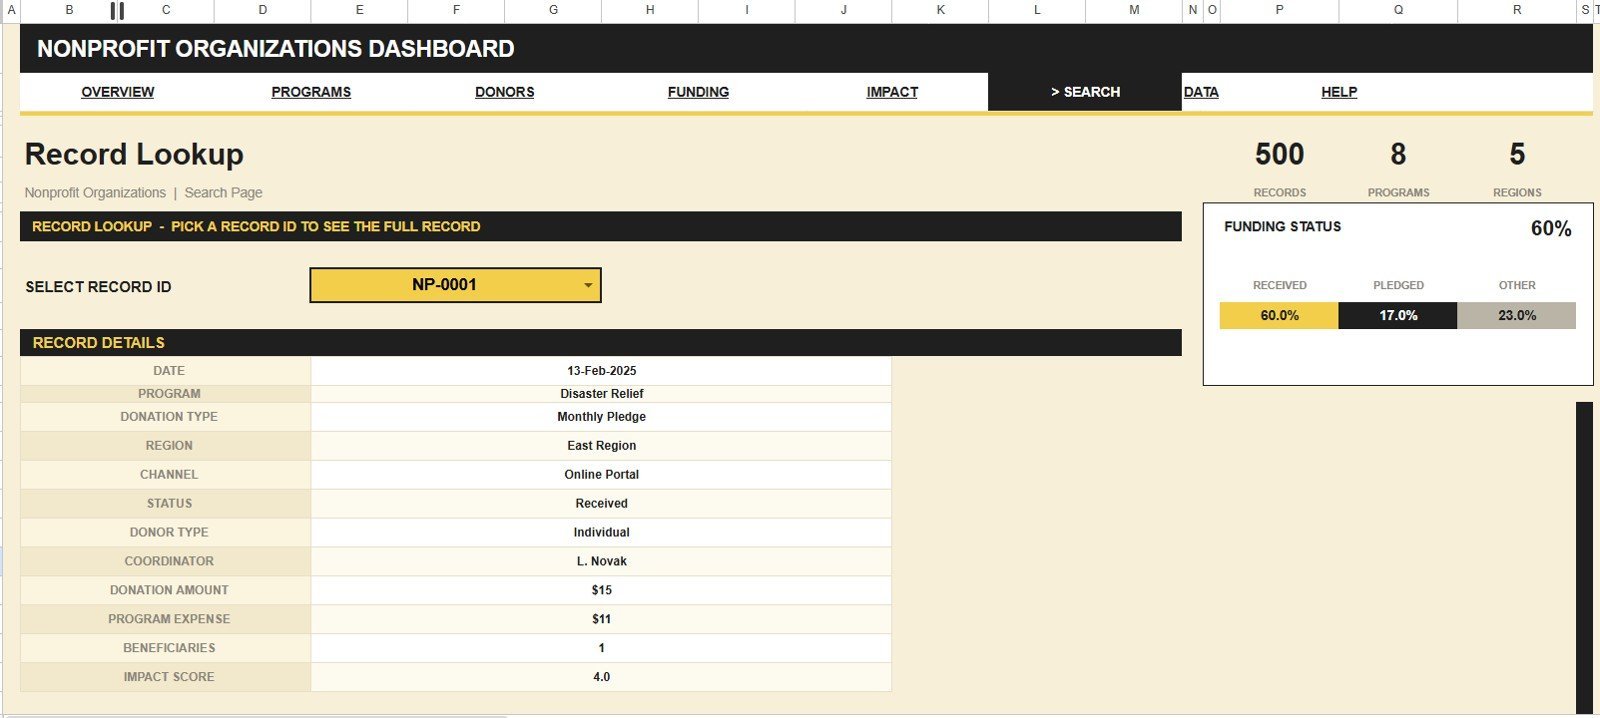
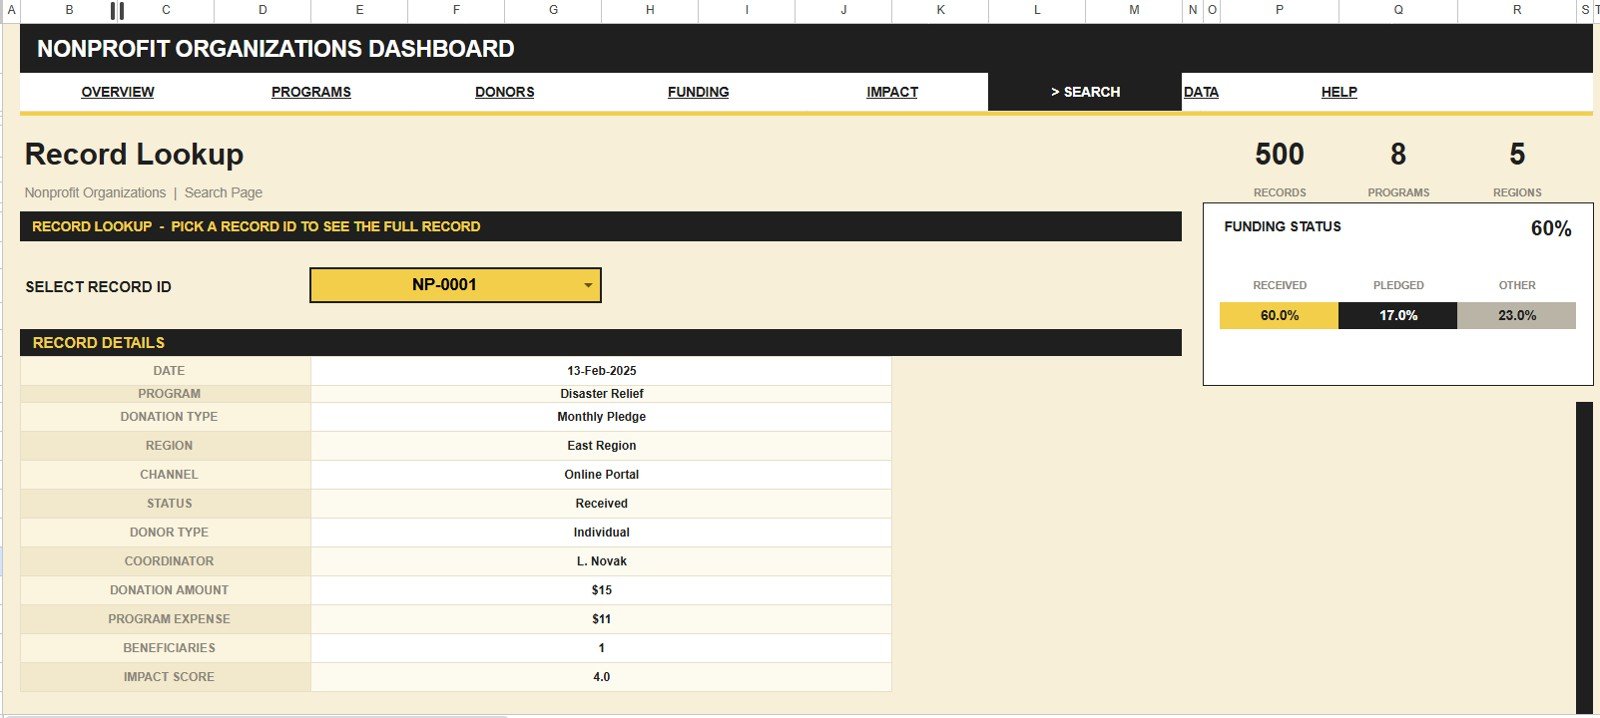
- 🔹 Record-ID search sheet – Select any Record ID and instantly pull its Date, Program, Donation Type, Region, Channel, Status, Donor Type, Coordinator, Donation Amount, Program Expense, Beneficiaries and Impact Score.
- 🔹 Fund accountability built in – Funds Received, Pending Pledges, Program Expense and Net Available reconcile money in against money spent automatically.Nonprofit Organizations Dashboard in Google Sheets
- 🔹 Runs in free Google Sheets – Works on desktop, tablet or phone and shares with your board or team through one link.
📦 What’s Inside the Nonprofit Organizations Dashboard
The template ships with seven tabs — five analysis pages, a search sheet and a data sheet. Each analysis page carries its own slicers so program staff and board members can filter to exactly what they need.
Page 1: Overview
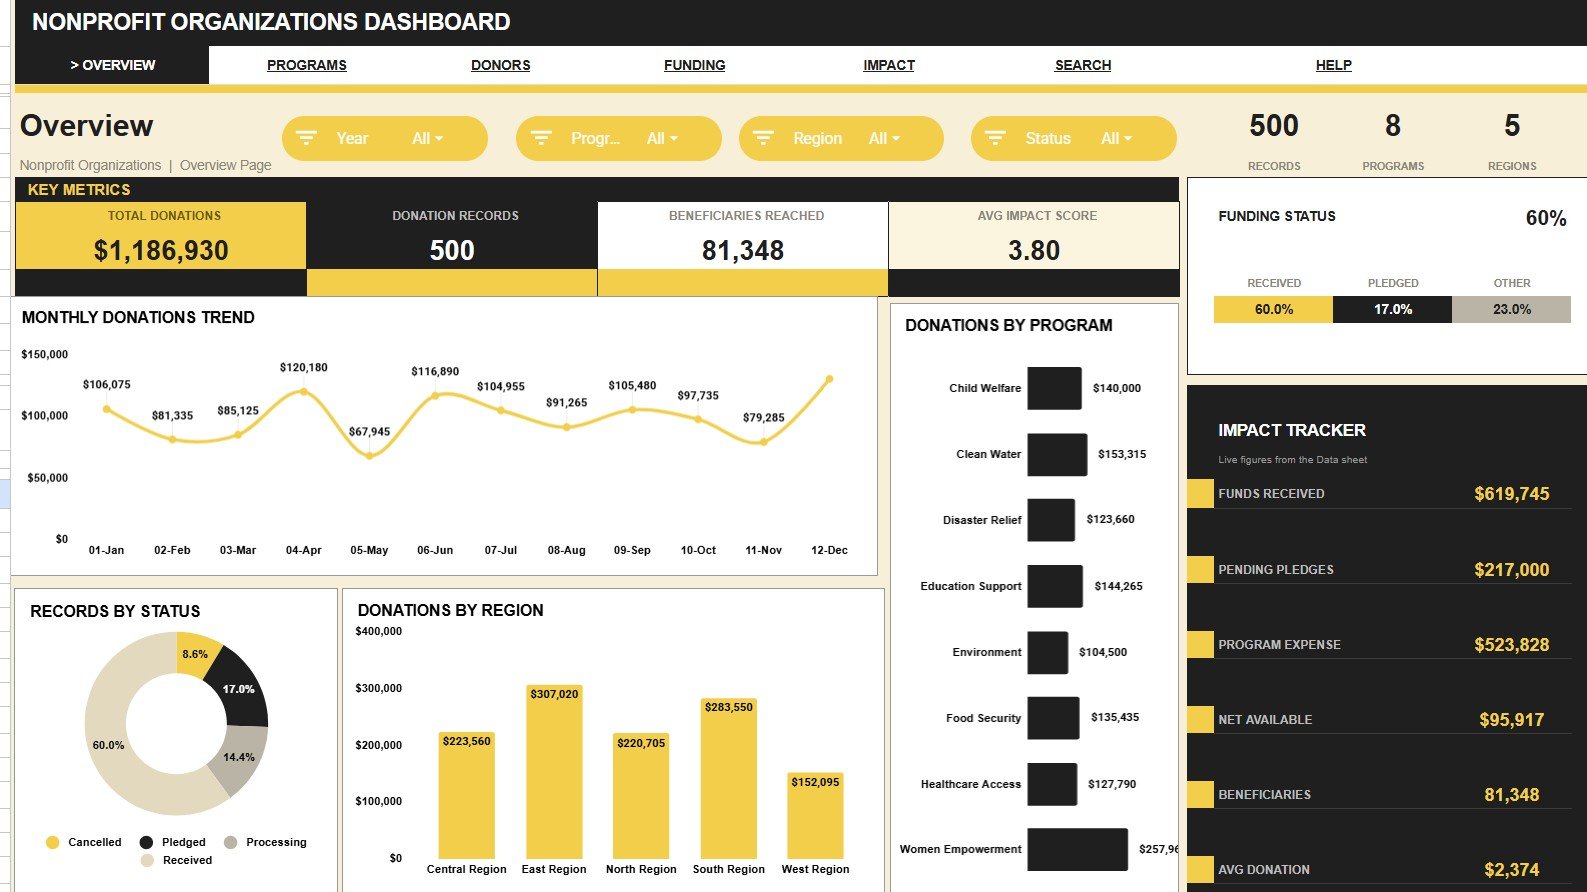
The Overview page shows 13 KPI cards — Total Donations, Donation Records, Beneficiaries Reached, Avg Impact Score, Records, Programs, Regions, Funding Status, Funds Received, Pending Pledges, Program Expense, Net Available and Avg Donation — above four charts: Donations by Month, Records by Status, Donations by Region and Donations by Program.
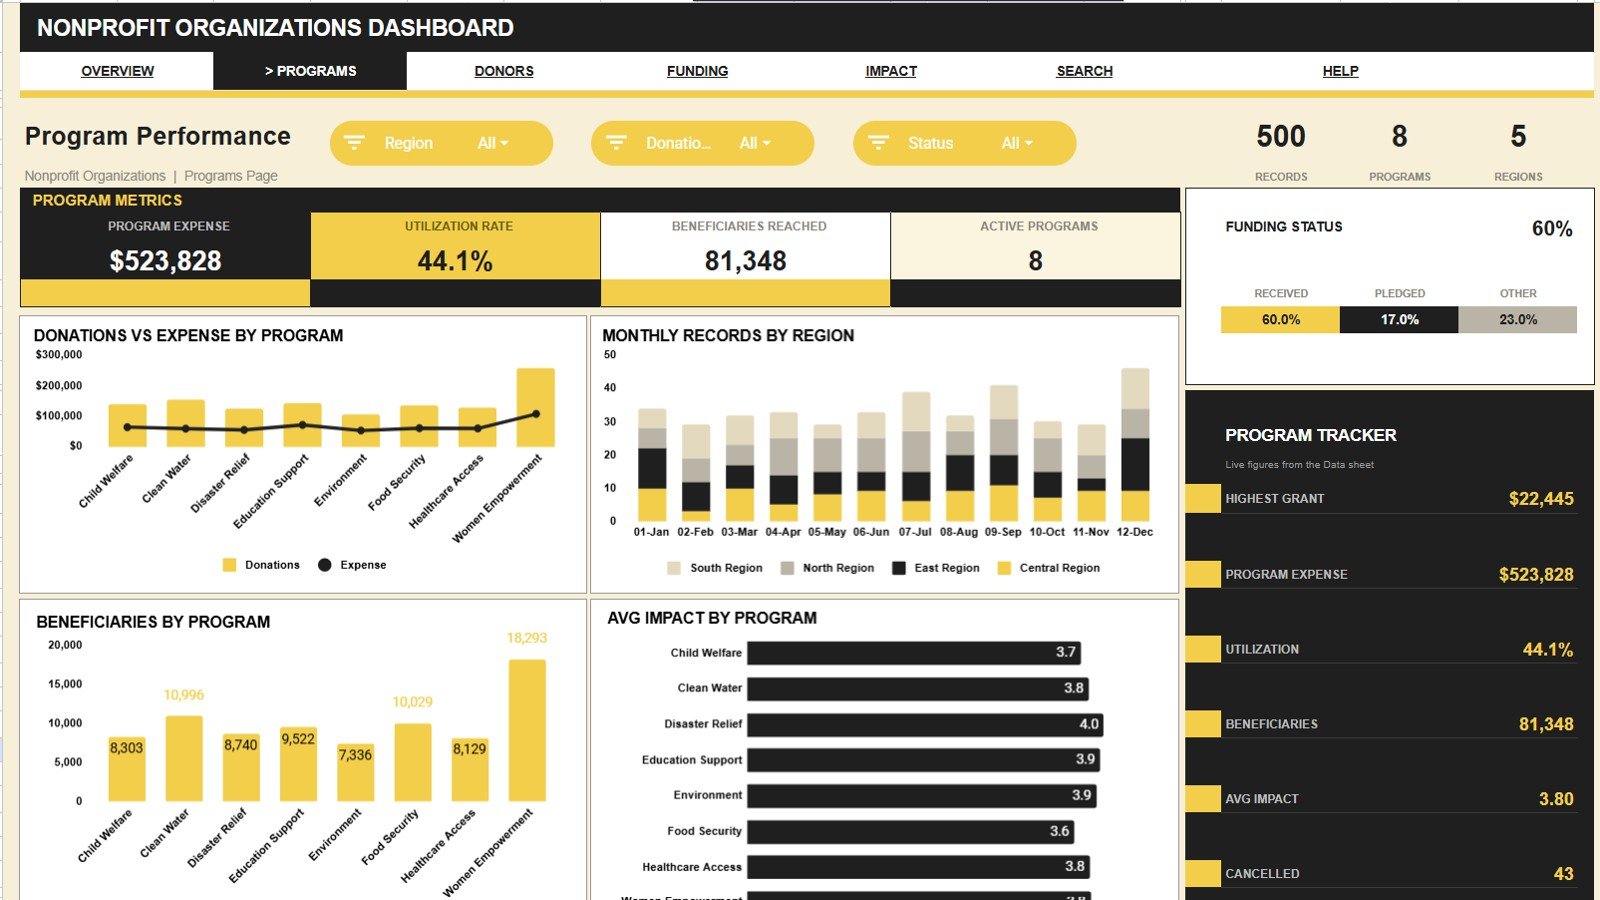
Page 2: Program Performance
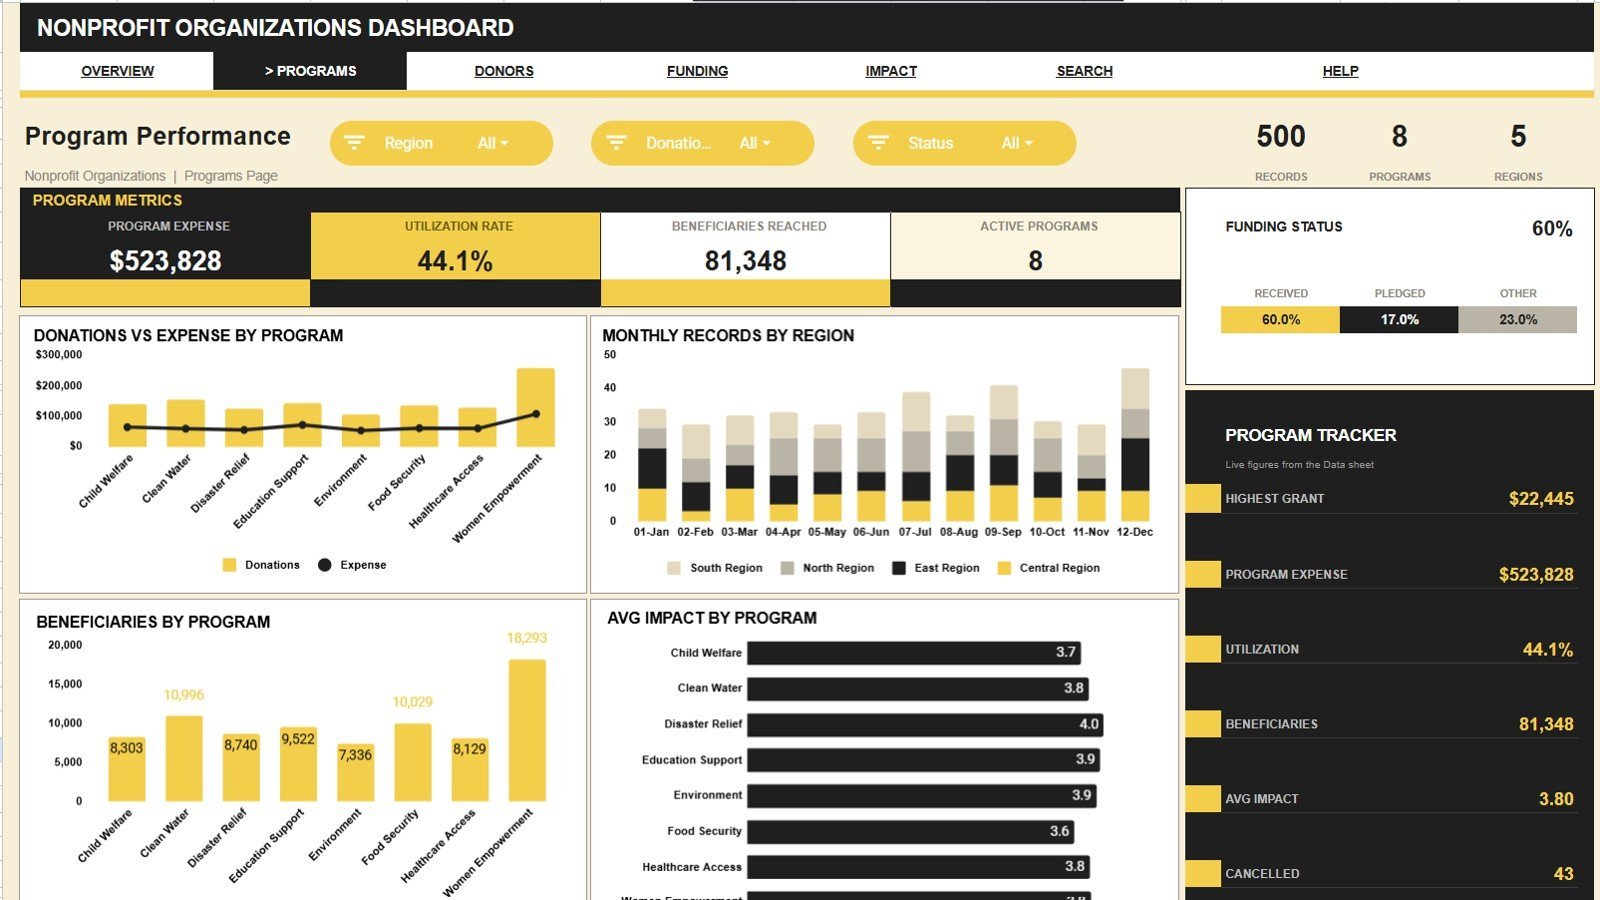
This page compares programs side by side with Donations and Expense by Program, Records by Month and Region, Beneficiaries by Program and Average Impact Score by Program — so you can see which programs deliver the most reach per dollar.
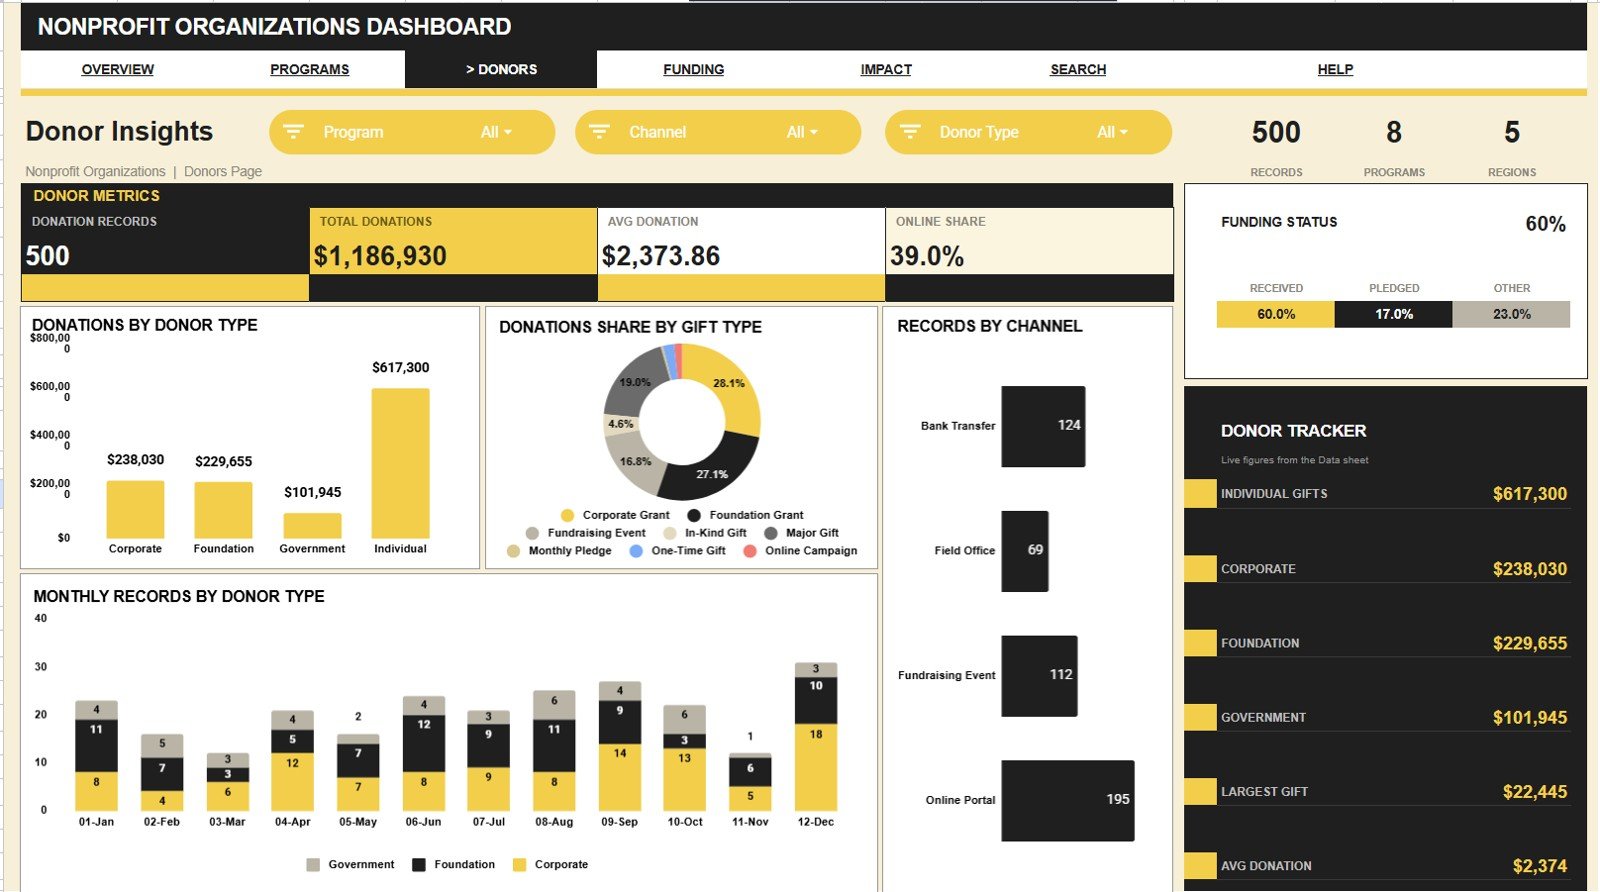
Page 3: Donor Insights
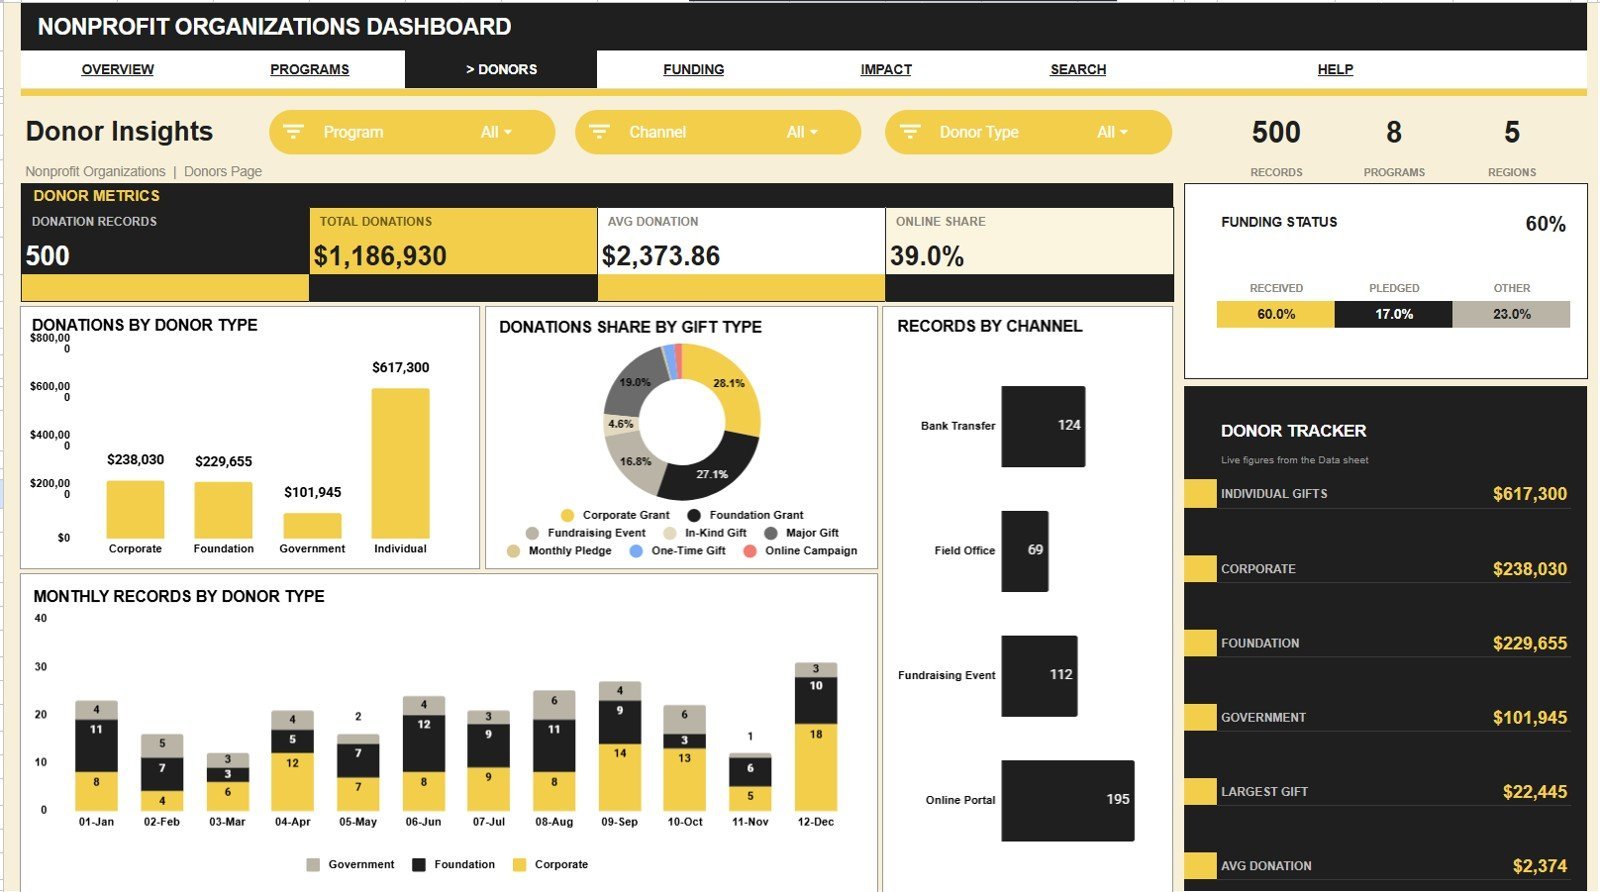
The Donor Insights page breaks giving down by Donations by Donor Type, Donations by Gift Type, Records by Channel and Records by Month and Donor Type — helping you spot which donor segments and channels drive the most support.
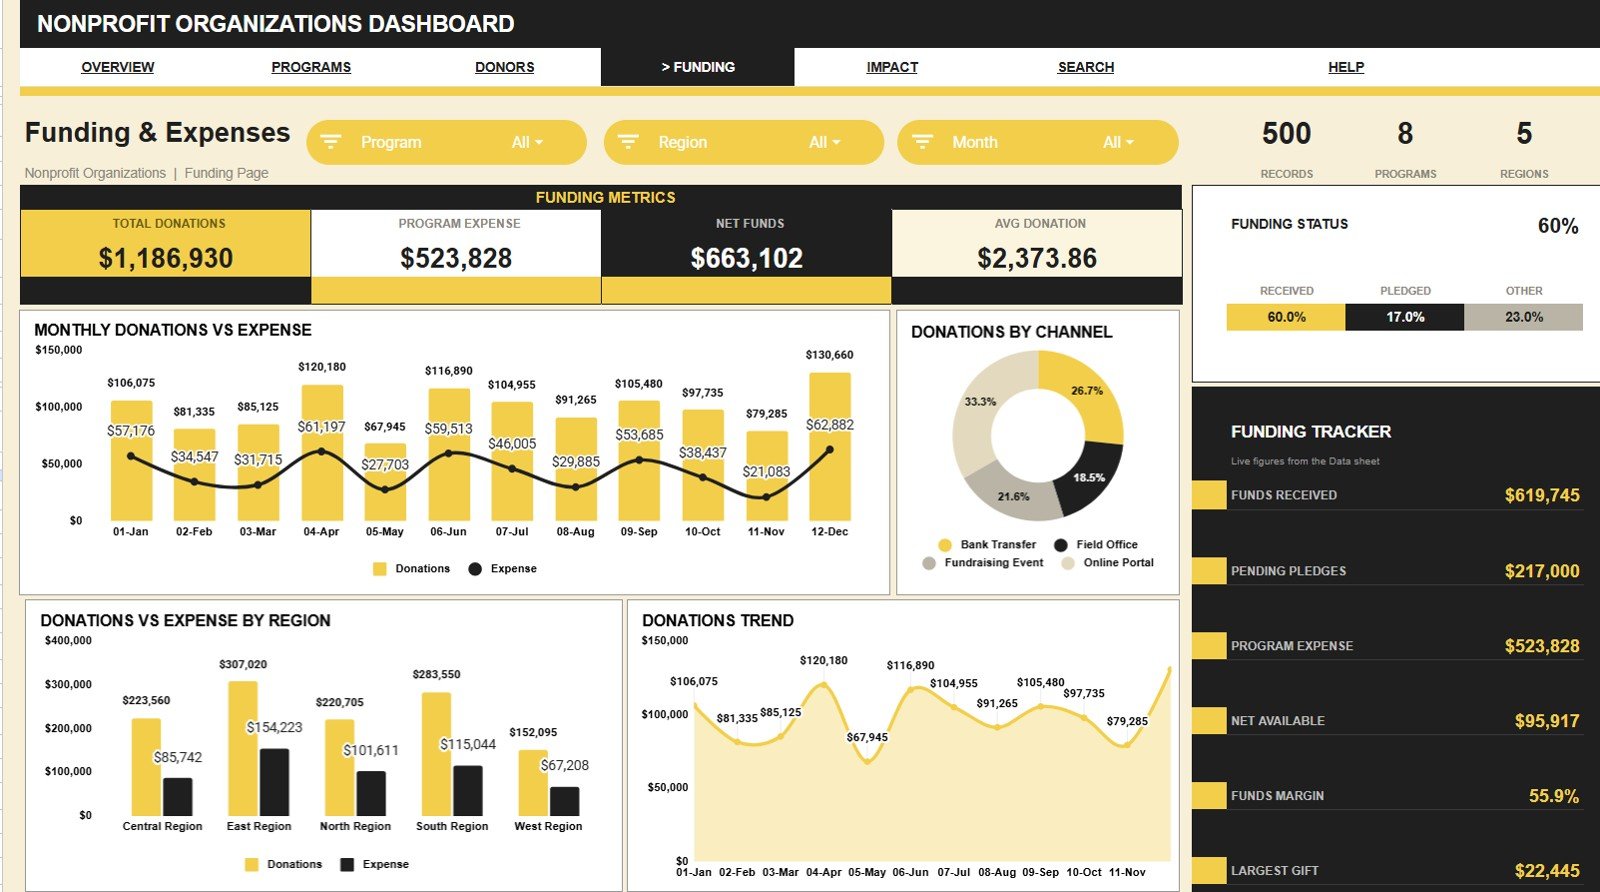
Page 4: Funding and Expenses
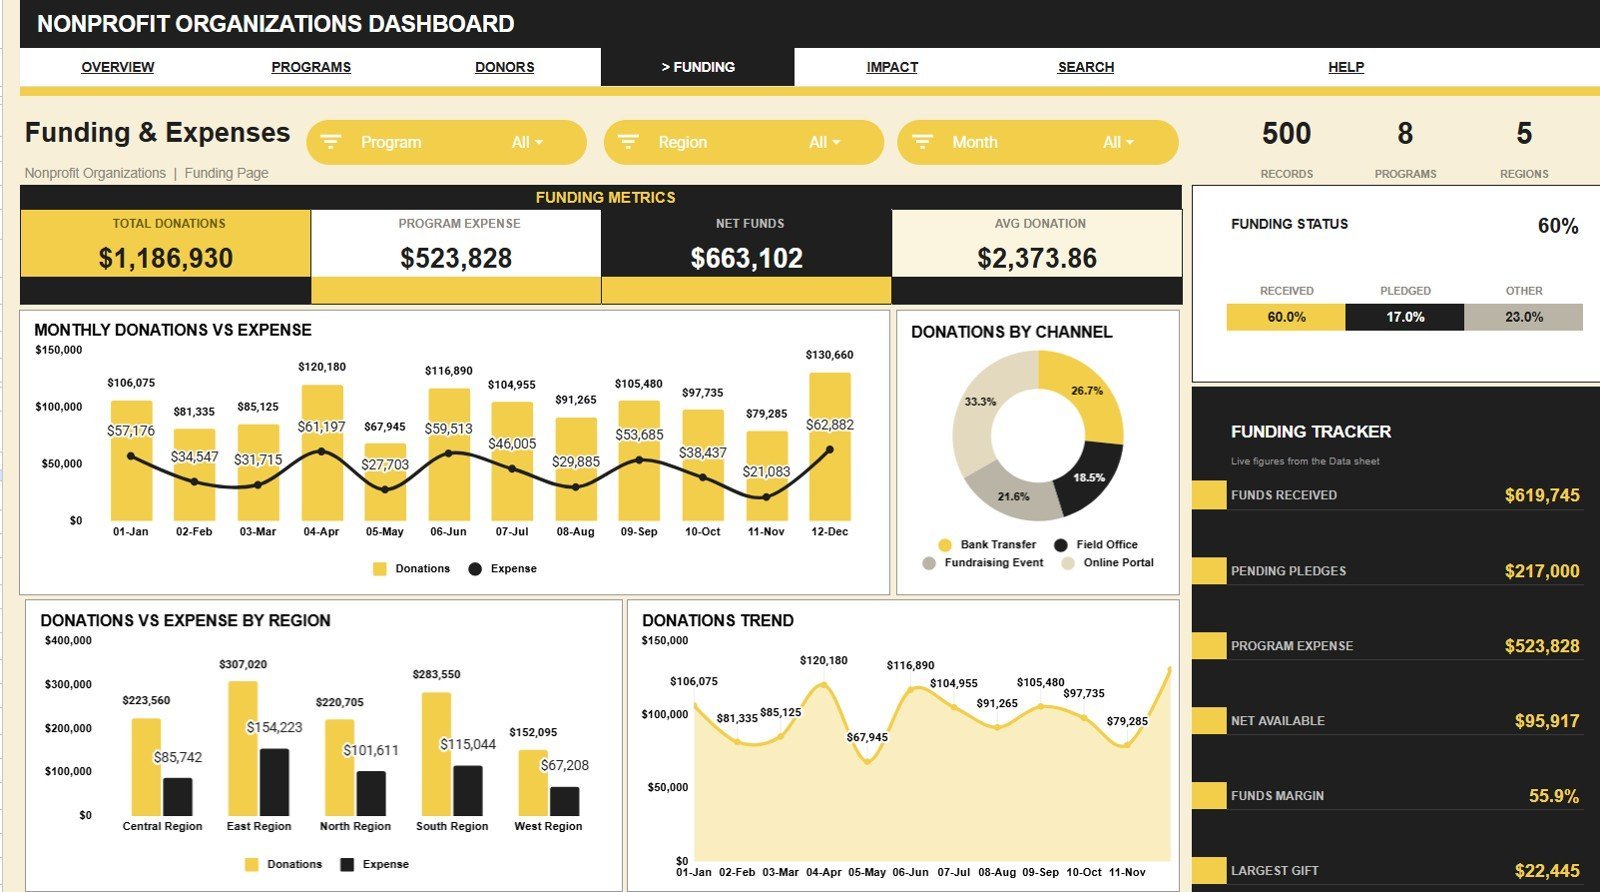
This page reconciles income against spending with Donations and Expense by Month, Donations by Channel, Donations and Expense by Region and Donations by Month — a clear view of where funds come from and where they go.Nonprofit Organizations Dashboard in Google Sheets
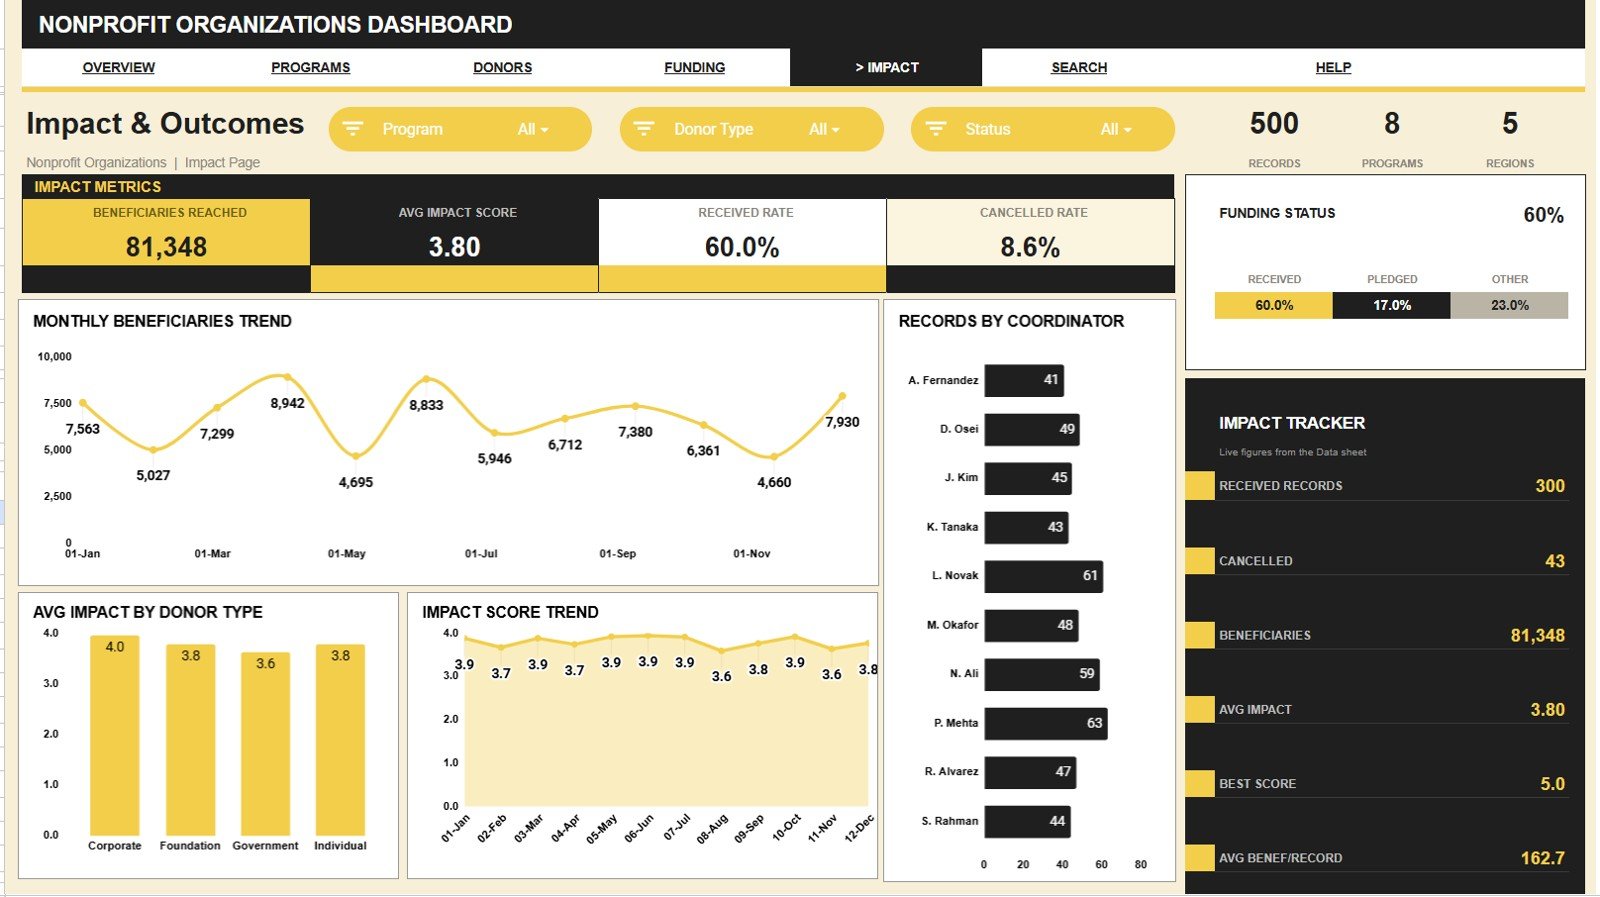
Page 5: Impact and Outcomes
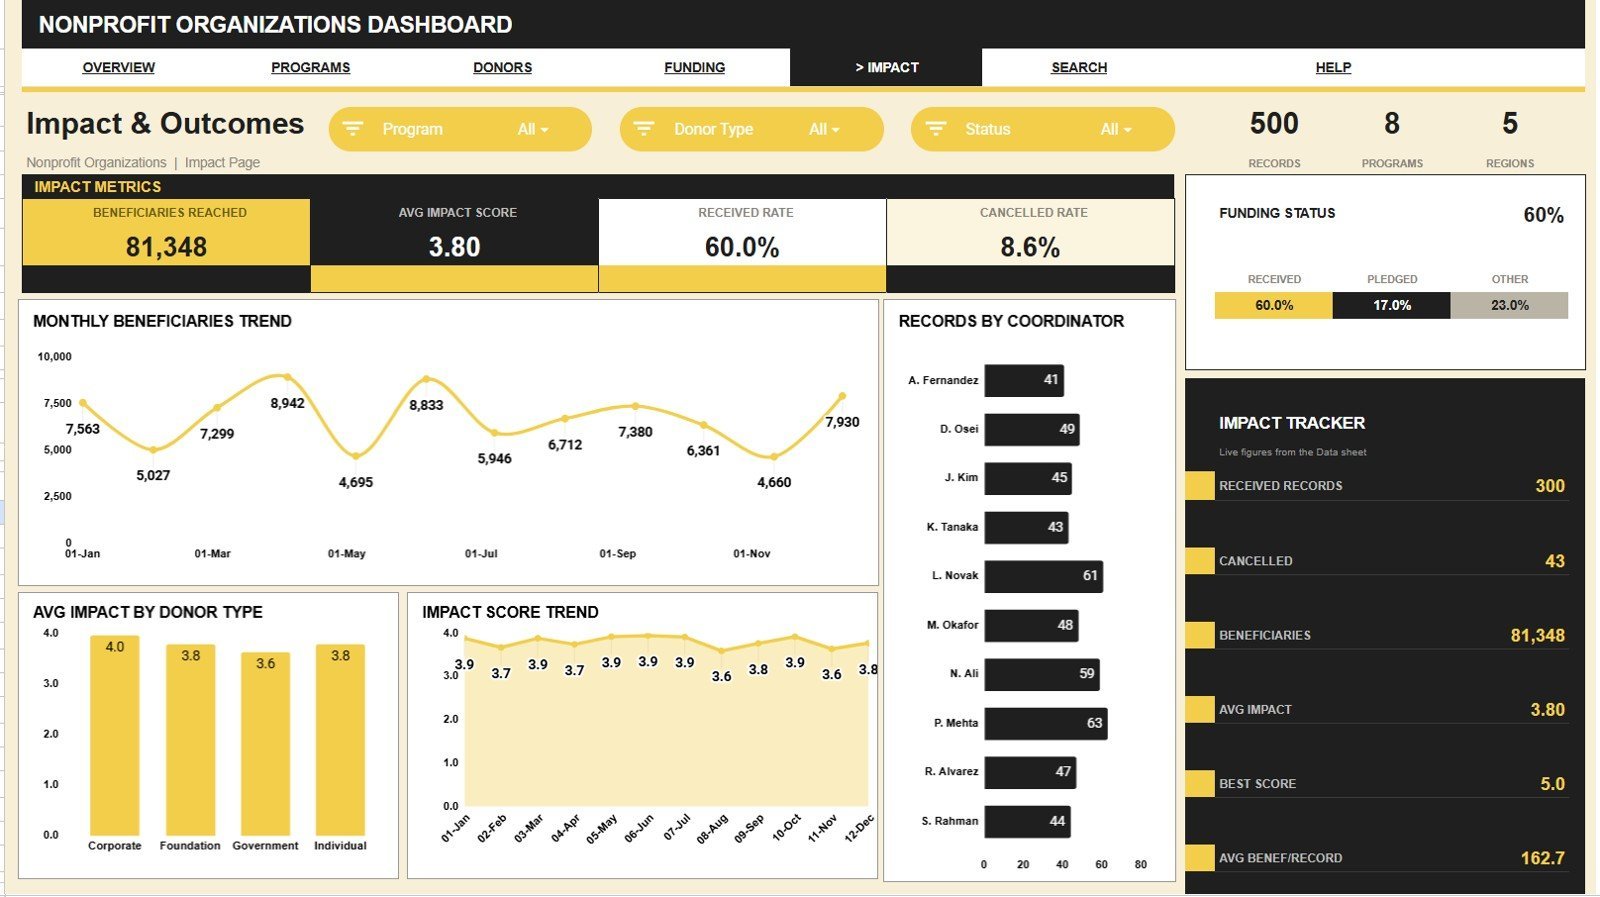
The Impact and Outcomes page focuses on results with Beneficiaries by Month, Records by Coordinator, Average Impact Score by Donor Type and Impact Score by Month — the numbers you need for grant reports and board updates.Nonprofit Organizations Dashboard in Google Sheets
Search Sheet
The Search Sheet lets users select a Record ID and instantly view the matching Date, Program, Donation Type, Region, Channel, Status, Donor Type, Coordinator, Donation Amount, Program Expense, Beneficiaries and Impact Score details — perfect for donor queries and audits.
Data Sheet
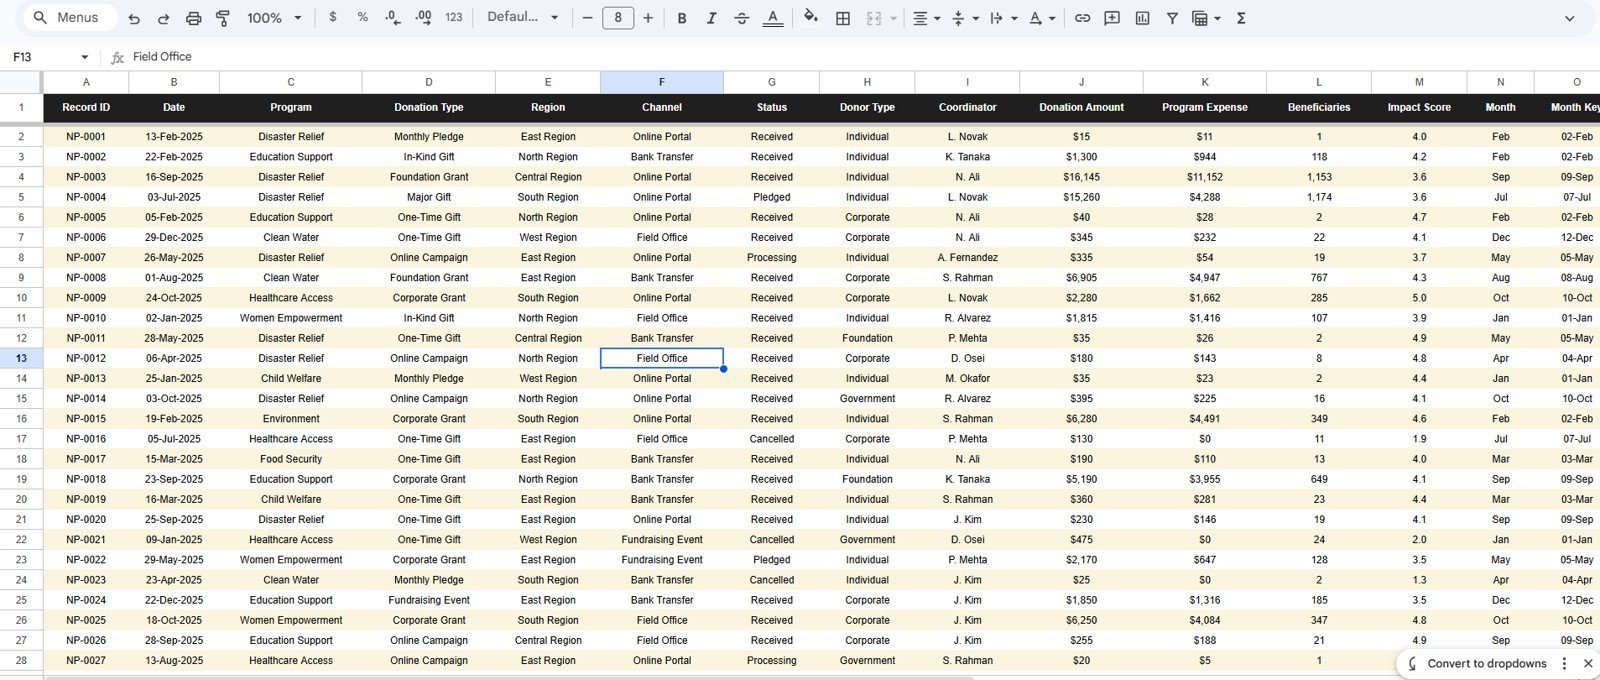
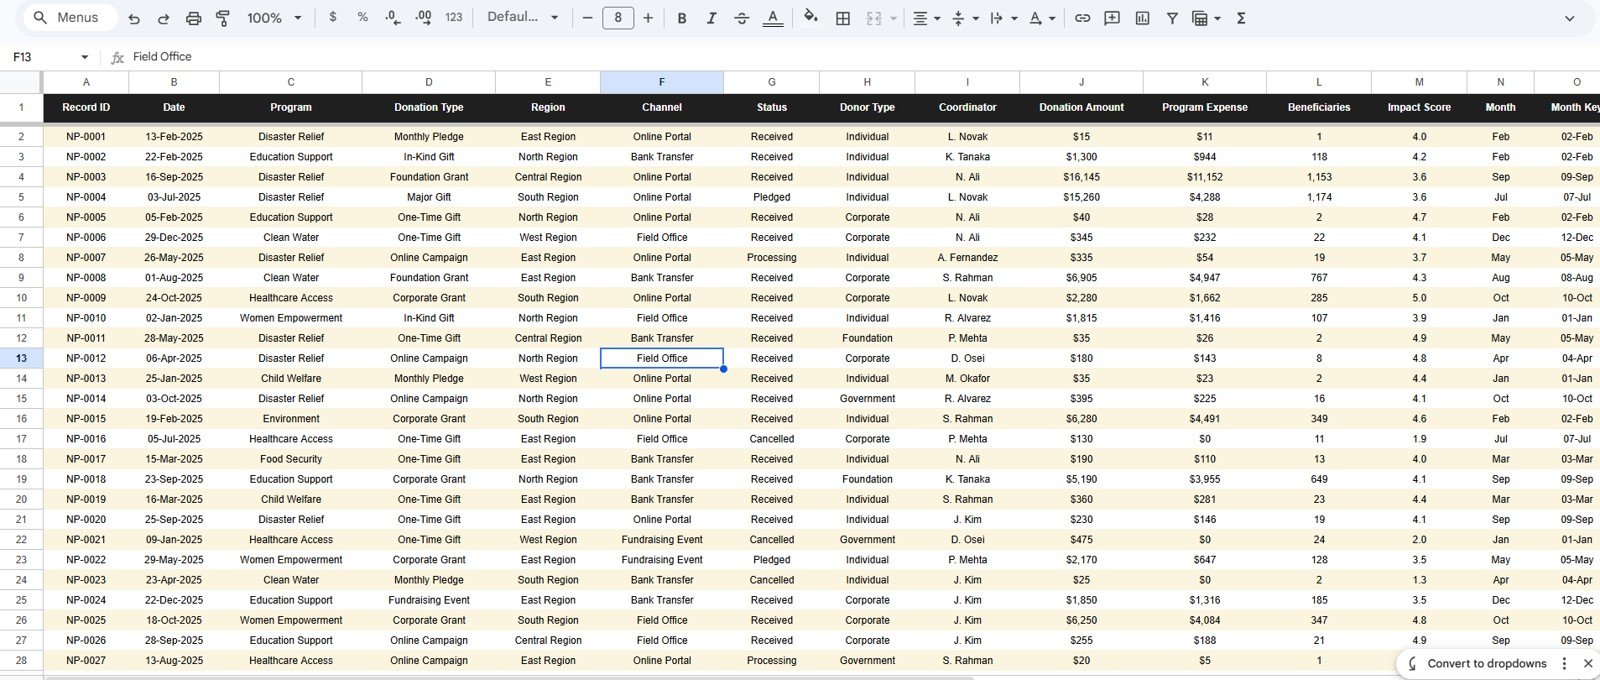
The Data Sheet is where you enter records in the same column format — Date, Program, Donation Type, Region, Channel, Status, Donor Type, Coordinator, Donation Amount, Program Expense, Beneficiaries and Impact Score. Add rows and every page and chart updates automatically.
📊 Nonprofit Organizations Dashboard vs. Excel vs. Paid Fundraising CRM — Where This Fits
| Feature | Nonprofit Organizations Dashboard (Google Sheets) | Microsoft Excel Dashboard | Blackbaud / Bloomerang / DonorPerfect |
|---|---|---|---|
| Cost | $9.99 one-time | $12–20 one-time | $99–$599 / month |
| Platform | Google Sheets (any browser) | Excel desktop | Cloud SaaS |
| Setup time | Under 10 minutes | 15–20 minutes | Days of onboarding |
| Real-time team collaboration | ✅ Built in | Limited (needs OneDrive) | ✅ |
| Mobile access | ✅ Browser or Sheets app | Partial (Excel mobile) | ✅ App |
| Customizable fields | ✅ Fully editable | ✅ | Limited by plan tier |
| Share with link | ✅ One link | Needs cloud file | ✅ |
| Donation and pledge tracking | ✅ Funds, pledges, expense, net | Manual | ✅ |
| Year-1 cost at 5 users | $9.99 total | ~$15 total | $1,200–$7,000+ |
For nonprofits and NGOs that want donation, fund and impact reporting without a five-figure CRM contract, the Nonprofit Organizations Dashboard sits in the sweet spot.
👥 Who This Template Is For — and Who It’s Not For
✅ This template is built for:
- Small and mid-size nonprofits and NGOs (1–50 staff) tracking donations, programs and beneficiaries.
- Program managers and grant coordinators who report impact scores and beneficiary reach to funders.
- Treasurers and board members who need funds-received-vs-expense visibility without new software.
❌ This template is NOT for:
- Large charities needing automated payment gateways, receipting and CRM-grade donor pipelines.
- Teams requiring SOC 2, single sign-on or role-based database permissions.
⚙️ How to Use the Nonprofit Organizations Dashboard
- Open the PDF in your download and click the Google Sheets link to copy the template into your Drive.
- Go to the Data Sheet and replace the sample rows with your donations, programs, regions and impact scores.
- Return to any analysis page — KPI cards and charts recalculate automatically as data changes.
- Use the slicers to filter by Program, Region, Status, Donor Type or Channel.
- Open the Search Sheet and pick a Record ID to view a single donation’s full details.
💼 Real-World Use Cases
Maria coordinates programs at a 12-person community NGO. She uses the Nonprofit Organizations Dashboard to track donations by program and region, watch beneficiaries reached climb month over month and export a clean impact summary for her quarterly grant report — without paying for a donor CRM.
David is the volunteer treasurer of a local charity. He relies on the Funding and Expenses page to reconcile funds received against program expense and keep an eye on Net Available and Pending Pledges before every board meeting.
Aisha runs fundraising at an education nonprofit. She opens the Donor Insights page to see which donor types and channels bring in the most, then focuses her next campaign on the segments that convert.
❓ Frequently Asked Questions
What KPIs does the Nonprofit Organizations Dashboard track?
The Nonprofit Organizations Dashboard tracks 13 KPIs including Total Donations, Beneficiaries Reached, Avg Impact Score, Funds Received, Pending Pledges, Program Expense and Net Available. Every metric updates automatically when you replace the sample data in the Data Sheet.
Do I need Excel or any paid software to use it?
No. The Nonprofit Organizations Dashboard runs entirely in free Google Sheets. You only need a Google account and a browser — it works the same on Windows, Mac, Chromebook, tablet and phone.
How long does setup take?
Setup takes under 10 minutes. Copy the sheet to your Drive, paste your records into the Data Sheet and every KPI card and chart across all six pages recalculates on its own — no formula editing required.
How does this compare to a paid fundraising CRM like Bloomerang or DonorPerfect?
Paid fundraising CRMs run $99–$599 per month and take days to onboard. The Nonprofit Organizations Dashboard is a $9.99 one-time purchase that covers donation, fund and impact reporting for small and mid-size nonprofits without any subscription.
Can I add my own programs, regions and donor types?
Yes. All lists are fully editable. Add your own programs, regions, channels, donor types and coordinators in the data, and the slicers, KPI cards and charts pick them up automatically.
Can my whole team use it at once?
Yes. Because the Nonprofit Organizations Dashboard lives in Google Sheets, you can share one link and your board, program staff and volunteers can view or edit together in real time, with no per-user fee.
👤 About the Author
Built by PK — Microsoft Certified Professional with 15+ years of Excel, Google Sheets and Power BI experience. Founder of NextGenTemplates, reaching 300K+ subscribers across YouTube channels (@PK-AnExcelExpert, @NextGenTemplates, @NeoTechNavigators). Every template is hand-built and tested before release.
🔗 Explore Related Templates
- Fundraising Campaign KPI Dashboard in Google Sheets — track campaign goals, pledges and conversion.
- Charity Fundraising KPI Scorecard in Google Sheets — a scorecard view of fundraising health.
- Donation Register Data Entry System in Excel — log individual donations with a form-based entry system.
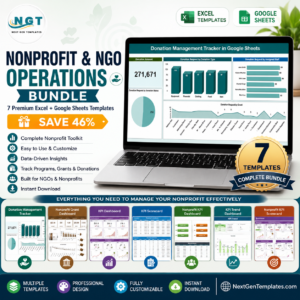
💎 Save 46% — get this plus six more tools in the Nonprofit & NGO Operations Bundle.
📖 Read the detailed blog post for a full walkthrough
🎥 Visit our YouTube channel for step-by-step video tutorials
👉 YouTube.com/@NextGenTemplates
Watch the step-by-step video Demo:
📅 Last updated: July 2026































Reviews
There are no reviews yet.