

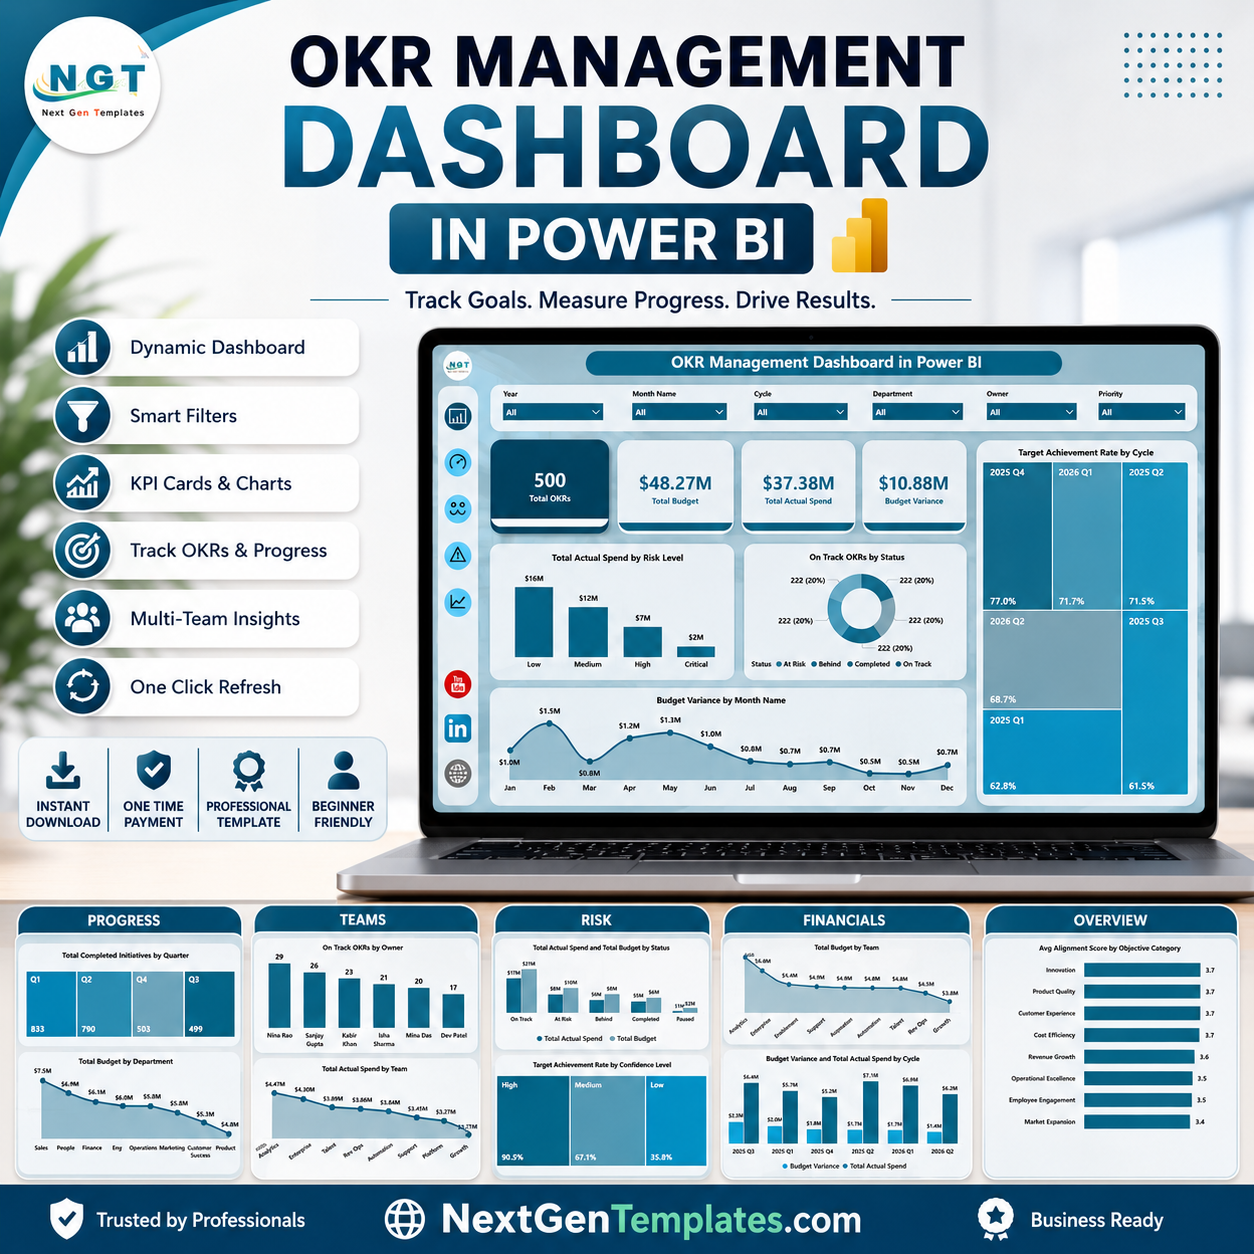

OKR Management Dashboard in Power BI gives leadership teams 5 interactive report pages, 4 executive KPI cards, and 16 focused chart views for tracking objectives, key results, initiatives, budget, risk, confidence, ownership, and financial progress. For a one-time $17.99 sale price, teams can replace scattered OKR reports with a ready Power BI file that is easier to filter, review, and present during monthly or quarterly business reviews.
Key Features of OKR Management Dashboard in Power BI
- 5 Power BI pages: Overview, Progress, Teams, Risk, and Financials.
- 4 executive cards: Total OKRs, Total Budget, Total Actual Spend, and Budget Variance.
- 16 chart views: Analyze spend, status, variance, achievement rate, initiatives, departments, owners, teams, risk, priority, and alignment.
- Interactive slicers: Filter the dashboard quickly during leadership reviews and OKR check-ins.
- Editable PBIX file: Replace sample data with your own OKR records and customize visuals in Power BI Desktop.
What’s Inside the OKR Management Dashboard in Power BI
Overview Page
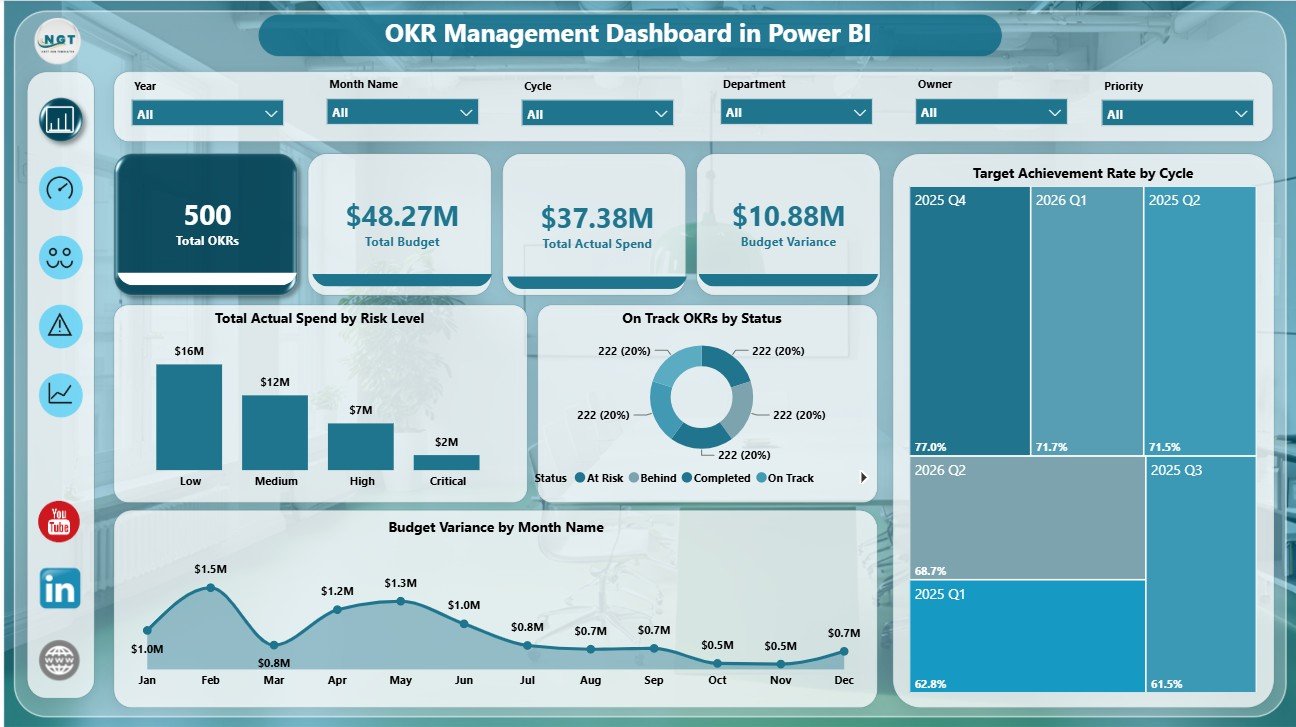
The Overview Page shows Total OKRs, Total Budget, Total Actual Spend, and Budget Variance at the top for quick executive review. Total Actual Spend by Risk Level highlights where resources are tied to higher-risk objectives, while On Track OKRs by Status helps managers see whether execution health matches the current OKR pipeline.
Budget Variance by Month Name shows how budget gaps move over time and helps finance or PMO teams spot months that need follow-up. Target Achievement Rate by Cycle compares OKR achievement across planning cycles so leaders can see whether performance is improving from one cycle to the next.
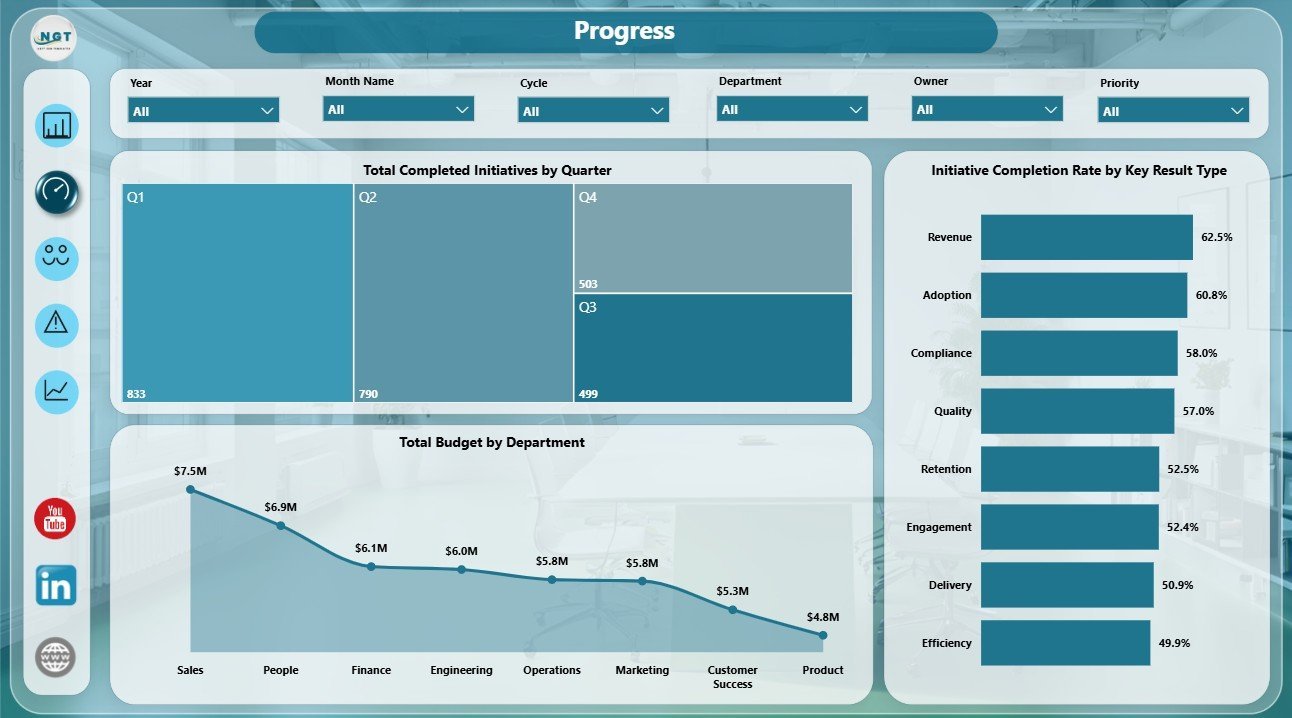
Progress
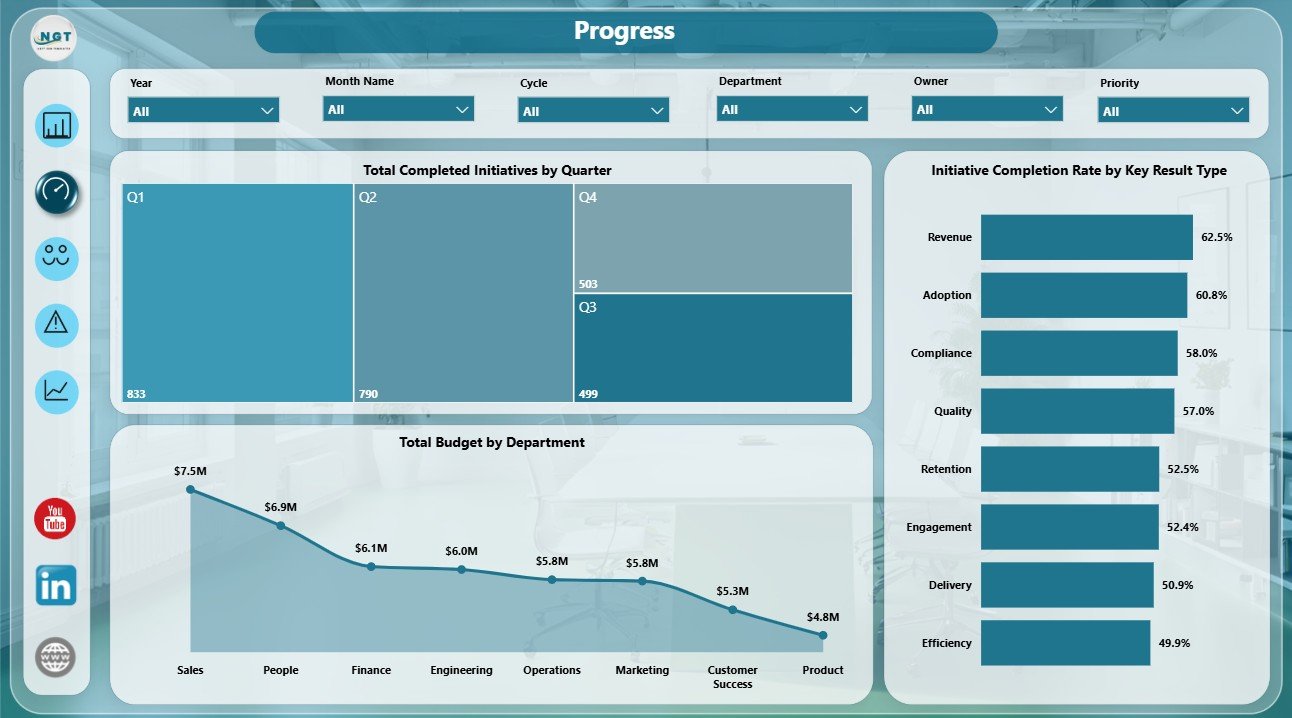
Total Completed Initiatives by Quarter shows how execution is moving across the year and helps teams identify slow or strong delivery periods. Total Budget by Department makes it easier to compare investment across departments and review whether budget allocation matches strategic priorities.
Initiative Completion Rate by Key Result Type shows which types of key results are being completed most consistently. This helps leadership understand whether operational, financial, customer, product, or strategic initiatives need more support.
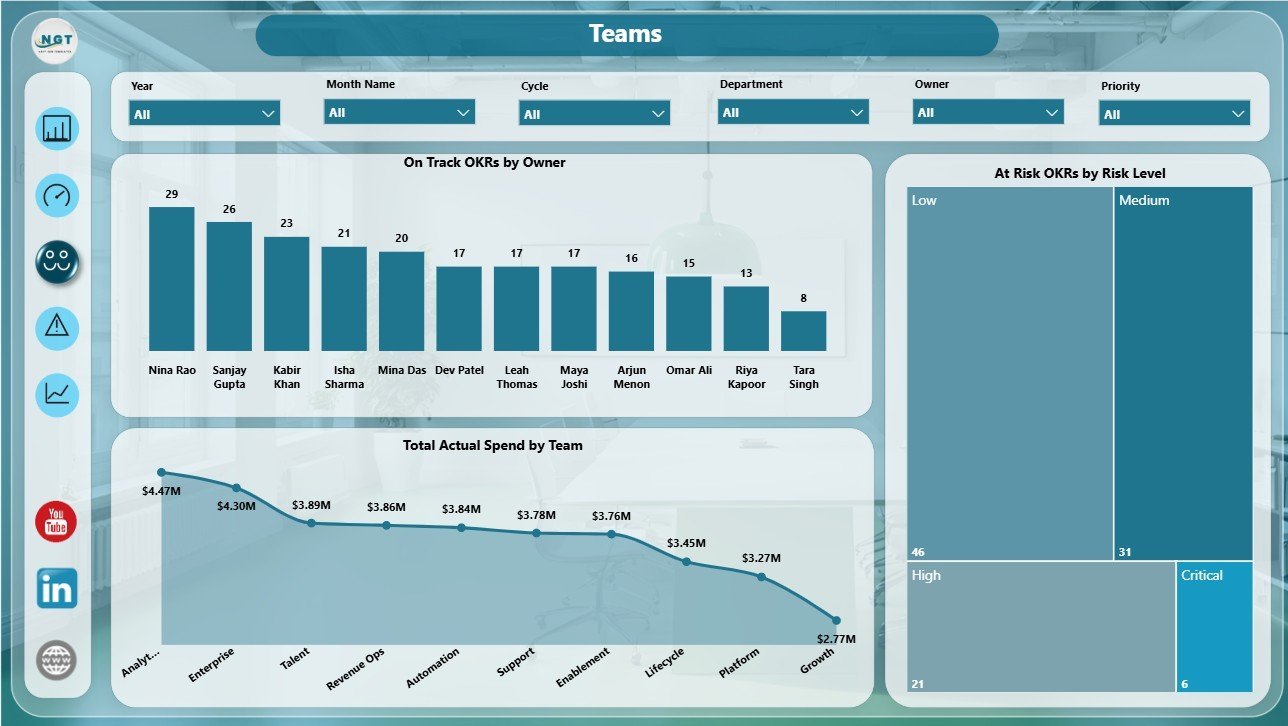
Teams
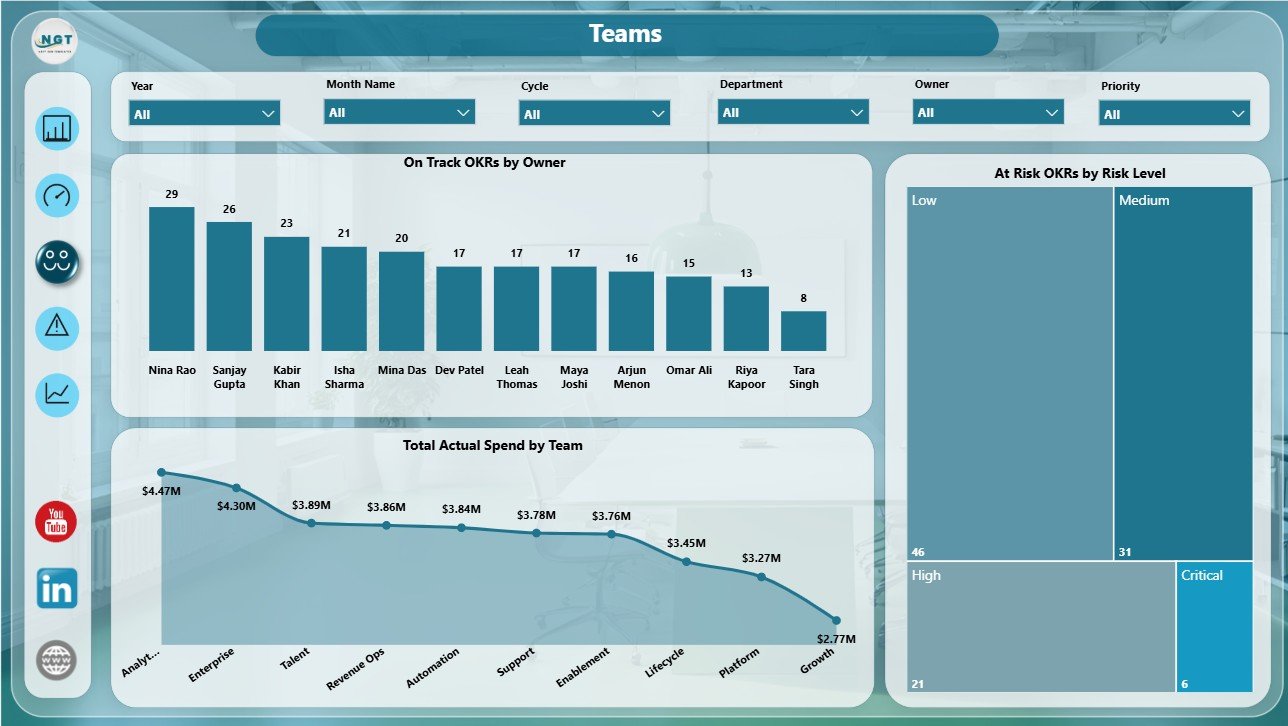
On Track OKRs by Owner compares ownership health and helps managers quickly identify owners with strong execution or objectives that may need support. Total Actual Spend by Team shows where actual spend is concentrated so team-level budget conversations are based on clear data.
At Risk OKRs by Risk Level highlights the OKRs that need review before they affect quarterly goals. This page is useful for team leads, strategy managers, and PMO users who need a people and team view of OKR progress.
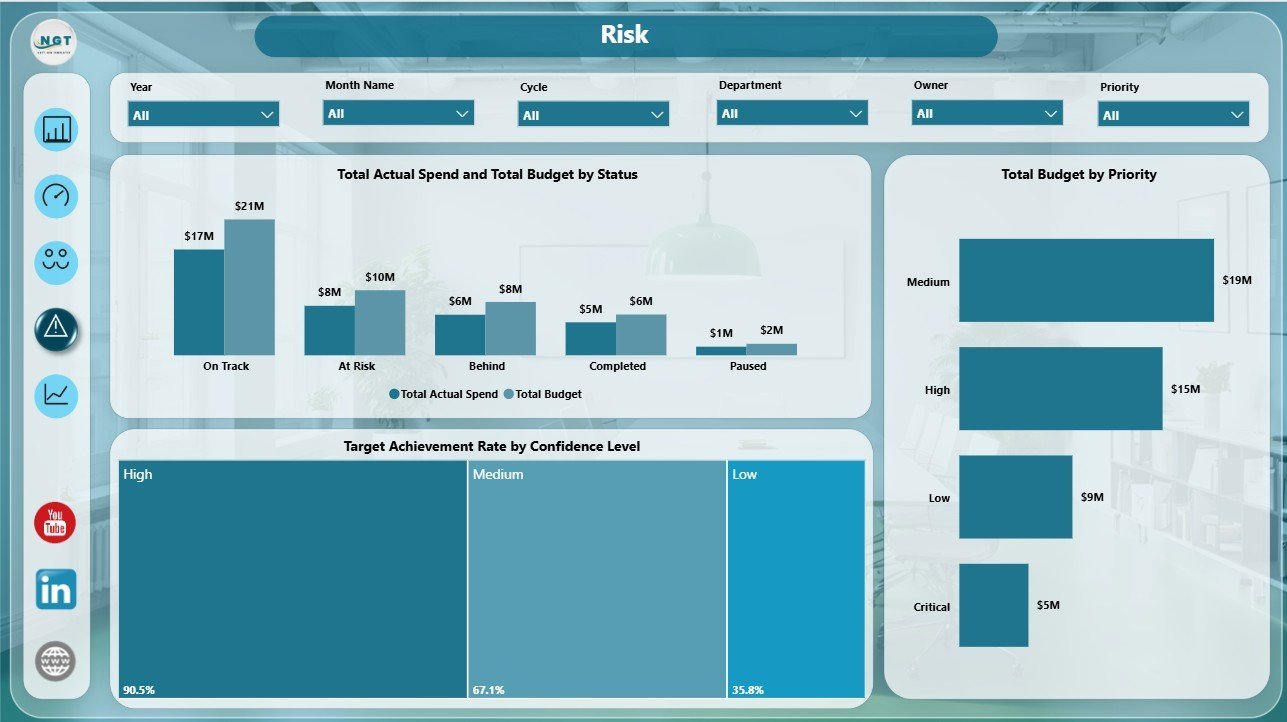
Risk
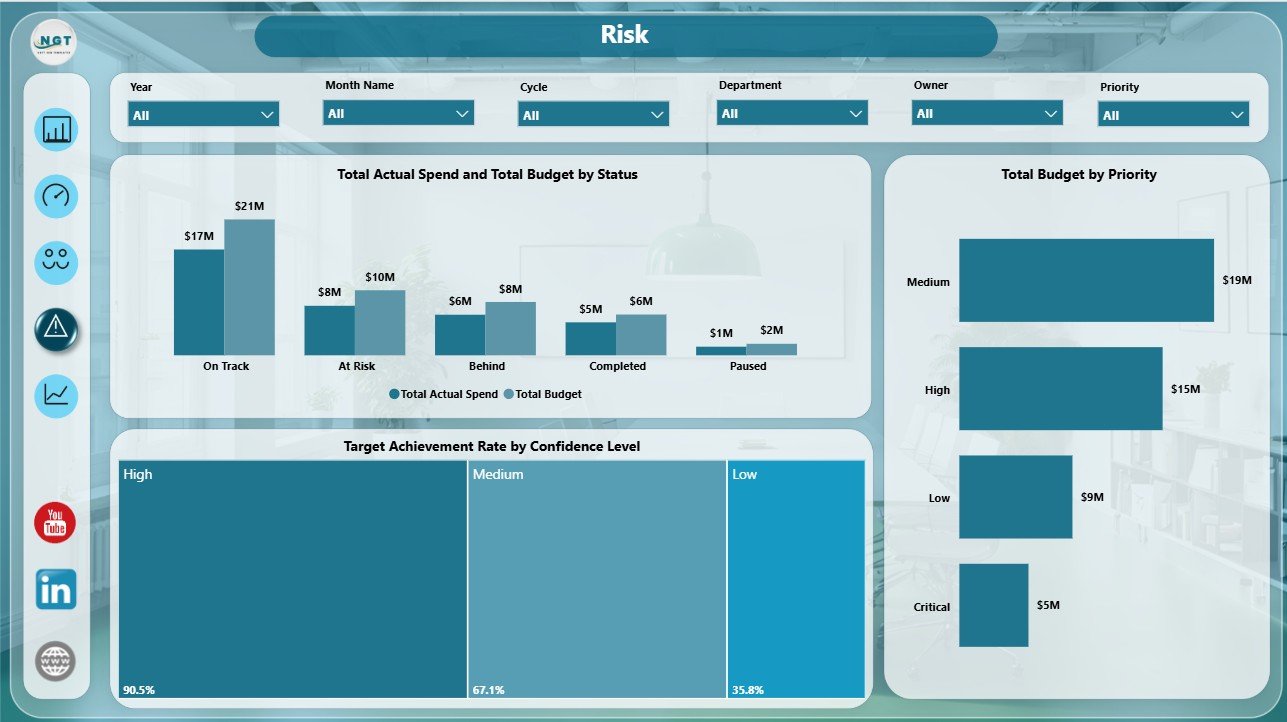
Total Actual Spend and Total Budget by Status compares budget allocation and actual consumption across OKR statuses. Target Achievement Rate by Confidence Level shows whether confidence ratings are aligned with real achievement outcomes.
Total Budget by Priority helps leaders review whether high-priority objectives are receiving enough planned investment. This page is useful before steering meetings, risk reviews, and quarterly planning sessions.
Financials
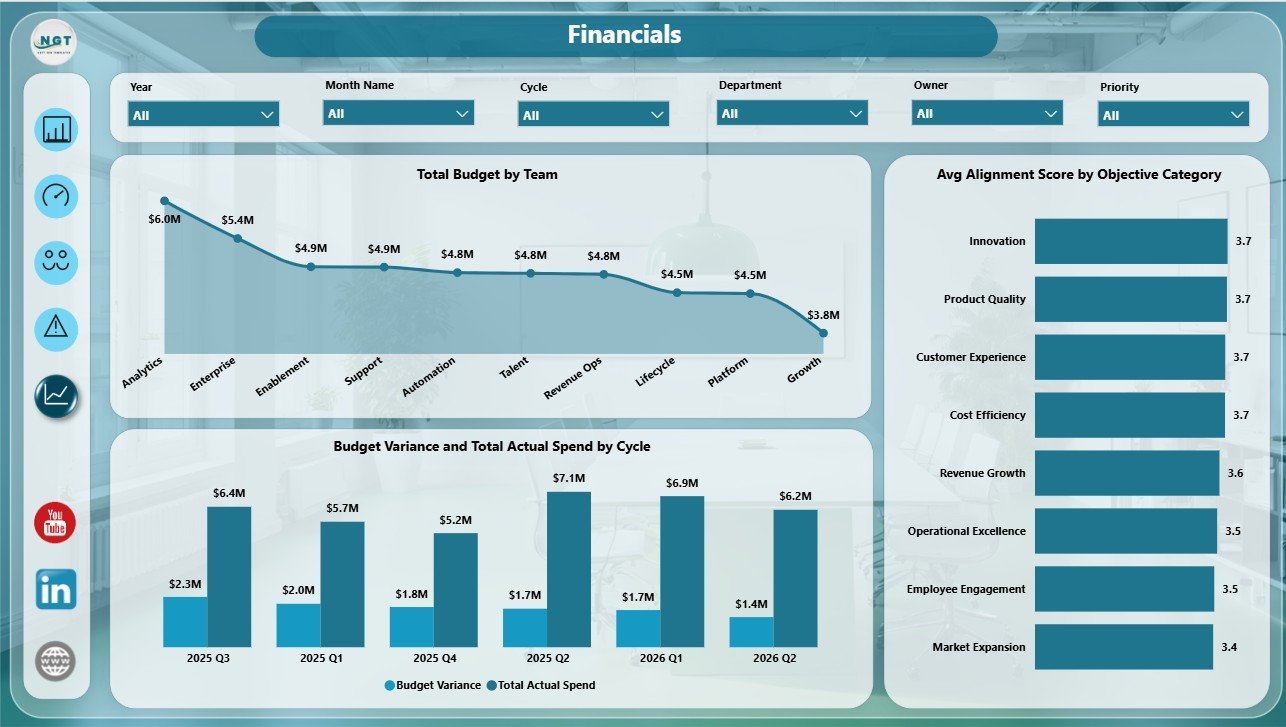
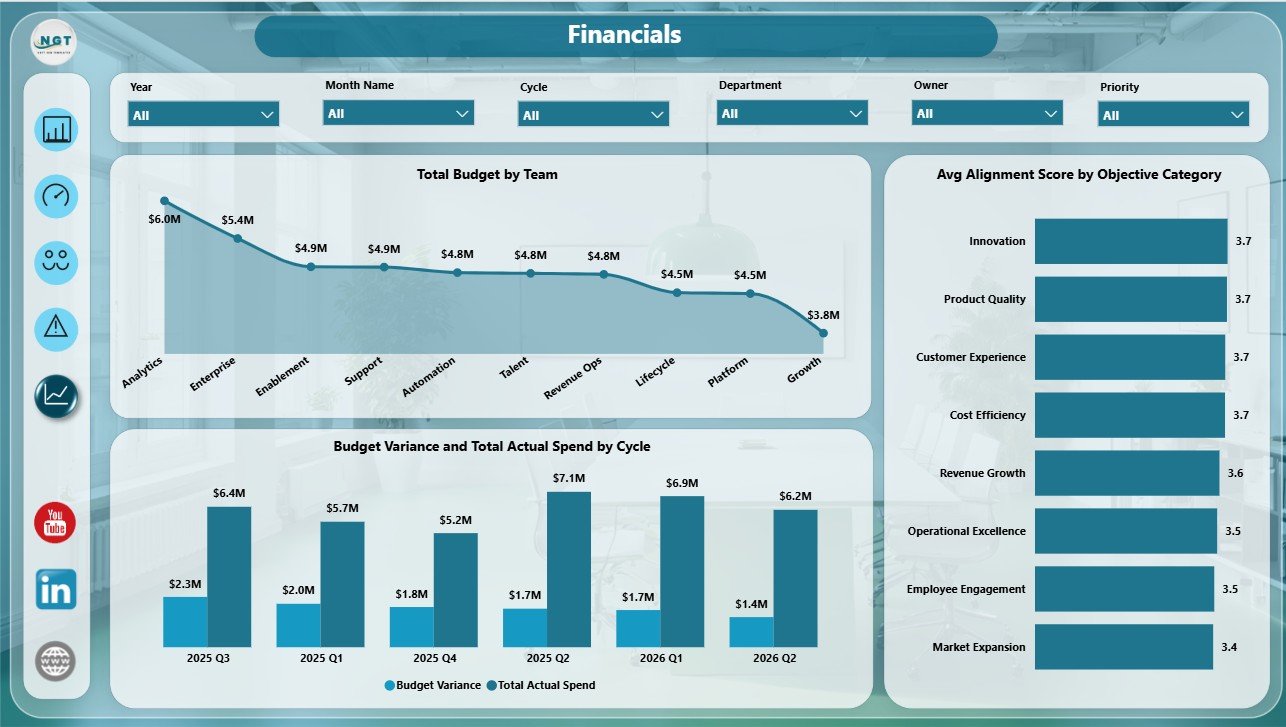
Total Budget by Team shows how planned investment is distributed across teams and helps budget owners compare funding patterns. Budget Variance and Total Actual Spend by Cycle connects financial execution with the OKR cycle calendar.
Avg Alignment Score by Objective Category shows which categories are best aligned with strategy. This helps leaders connect budget, spend, and alignment instead of reviewing OKR progress in isolation.
OKR Management Dashboard in Power BI vs. Tableau vs. Paid CRM/SaaS – Where This Fits
| Feature | This Power BI dashboard | Tableau alternative | Paid OKR SaaS |
|---|---|---|---|
| Cost | $17.99 one-time sale price | Requires Tableau licensing and build time | Recurring subscription |
| Platform | Power BI Desktop and Power BI Service | Tableau Desktop or Tableau Cloud | Vendor-hosted OKR system |
| Setup time | Replace or connect data and refresh | Build model and visuals manually | Requires onboarding and configuration |
| Custom fields | Editable model, pages, measures, and visuals | Editable if built internally | Plan and vendor dependent |
| Year-1 cost at 5 users | Template price plus any Power BI sharing license | Usually higher licensing and implementation cost | Often hundreds or thousands per year |
Who This Template Is For – and Who It’s Not For
This template is for founders, CEOs, strategy teams, PMOs, department heads, finance partners, operations leaders, and consultants who already track OKRs in structured data and want a Power BI reporting layer. It is not a full OKR management system with user permissions, automated check-ins, approval workflows, or native HRIS integrations.
How to Use the OKR Management Dashboard in Power BI
- Download and unzip the file.
- Open the .pbix file in Power BI Desktop.
- Replace the sample data source with your own OKR data.
- Refresh the model and confirm that slicers, pages, and visuals update correctly.
- Review the Overview, Progress, Teams, Risk, and Financials pages during OKR meetings.
- Publish to Power BI Service if your team needs controlled online sharing.
Real-World Use Cases
Strategy leader: Reviews Total OKRs, Target Achievement Rate, risk level, and budget variance before a quarterly business review.
PMO manager: Uses initiative completion, owner status, and risk visuals to prepare weekly follow-up actions.
Finance business partner: Compares budget, actual spend, and variance by team, department, month, and cycle.
Frequently Asked Questions
What does the OKR Management Dashboard in Power BI track?
It tracks OKRs, budget, actual spend, budget variance, risk level, status, cycle, owner, team, department, key result type, confidence level, priority, and alignment score.
Do I need Power BI Desktop?
Yes. Open the .pbix file in Power BI Desktop, which is free from Microsoft. Sharing through Power BI Service may require Microsoft licensing.
Can I use my own OKR data?
Yes. Replace the sample source with your structured OKR data and refresh the model.
Can I customize the dashboard?
Yes. You can edit pages, measures, slicers, visuals, colors, and relationships in Power BI Desktop.
Is this a full OKR software platform?
No. It is an analytics dashboard for OKR reporting, not a workflow tool for reminders, permissions, approvals, or employee check-ins.
About the Author
Built by PK – Microsoft Certified Professional with 15+ years of Excel, Google Sheets, and Power BI experience. Founder of NextGenTemplates, reaching 300K+ subscribers across YouTube channels. Every template is hand-built and tested before release.
Explore Related Templates
You may also like OKR Management Dashboard in Excel and Power BI Industry Dashboards Vol.2. Browse more Power BI Dashboard templates and Power BI templates on NextGenTemplates.
Download the OKR Management Dashboard in Power BI and make OKR review meetings clearer, faster, and more data-driven.
Last updated: July 2026































Reviews
There are no reviews yet.