

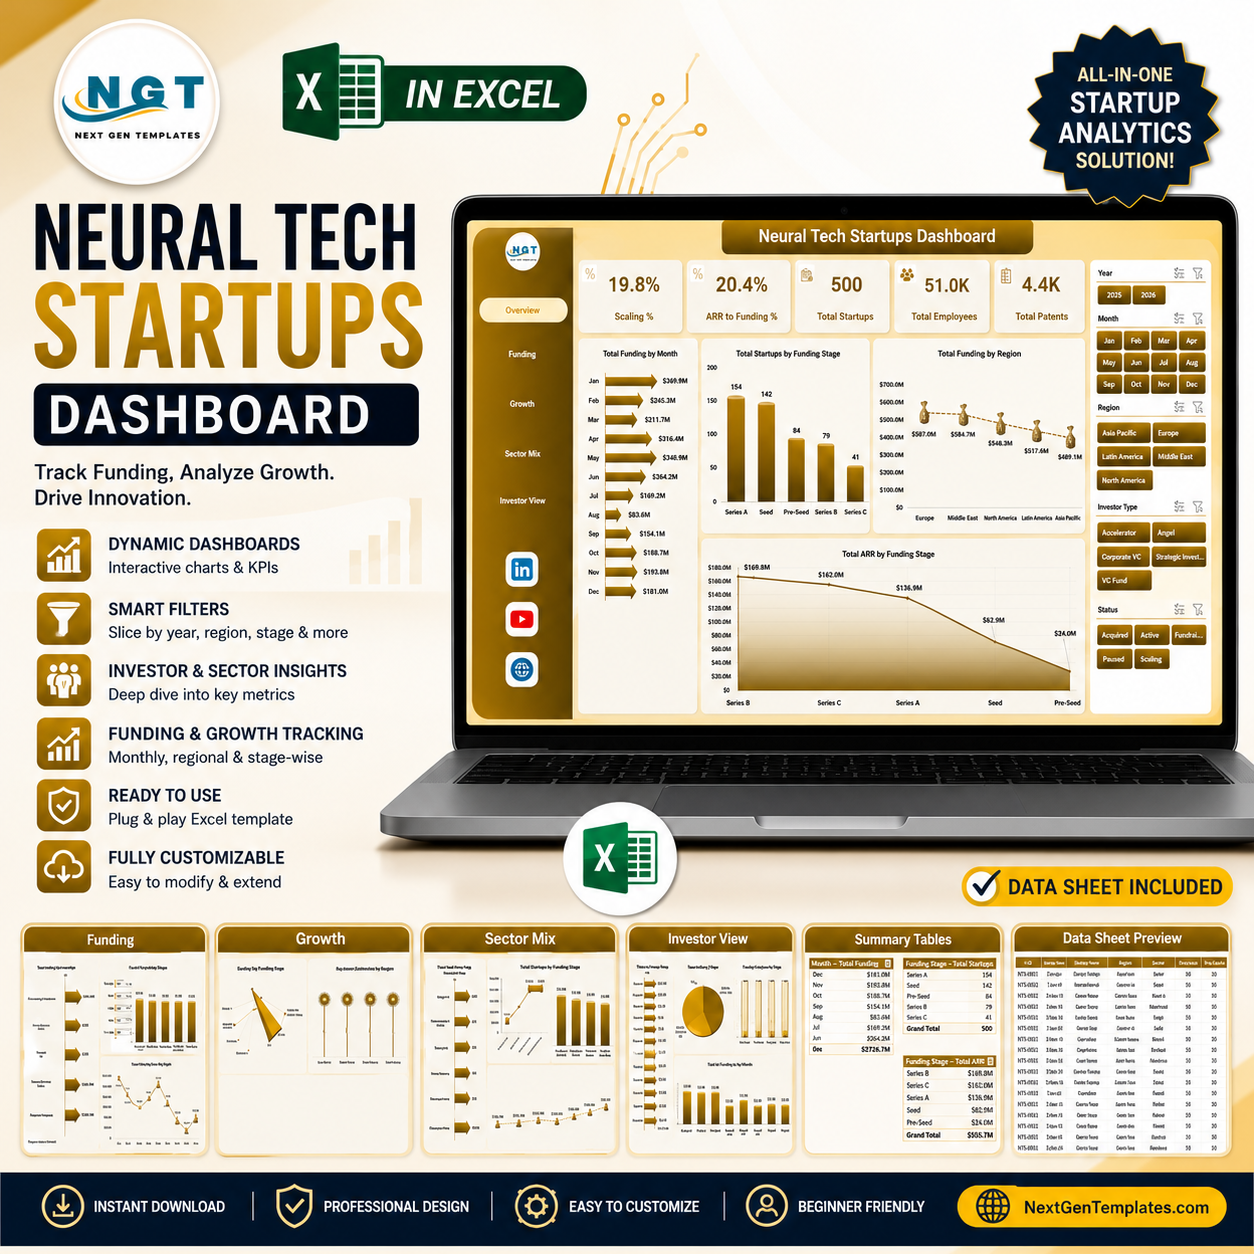


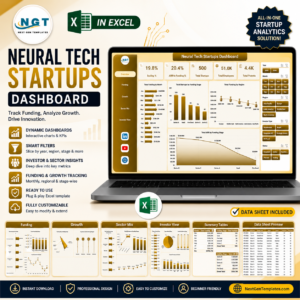
Neural Tech Startups Dashboard in Excel helps AI founders, venture analysts, accelerators, innovation teams, and startup finance managers track funding, ARR, burn, patents, pilots, scaling %, customer satisfaction, sectors, regions, stages, investor types, and employee counts in one editable workbook. The dashboard includes 5 analysis pages, 5 headline KPI cards, 20 focused charts, slicers for quick filtering, a structured Data sheet, and a Support sheet powered by pivot tables. Built by PK, a Microsoft Certified Professional with 15+ years of Excel experience and 300K+ YouTube subscribers, it gives you a one-time purchase reporting tool without a monthly SaaS fee.
Key Features of Neural Tech Startups Dashboard in Excel
- 5 dashboard pages: Overview Page, Funding, Growth, Sector Mix, and Investor View.
- 5 high-level KPI cards: Scaling %, ARR to Funding %, Total Startups, Total Employees, and Total Patents.
- 20 startup analysis charts: Review funding, ARR, monthly burn, patents, pilots, customer satisfaction, sectors, stages, regions, investor types, and status.
- Interactive slicers: Filter the dashboard quickly during founder updates, investor reviews, and accelerator portfolio meetings.
- Editable Excel workbook: Replace sample records in the Data sheet, refresh pivots from the Data tab, and the cards and charts update.
What’s Inside the Neural Tech Startups Dashboard in Excel
1 – Overview Page
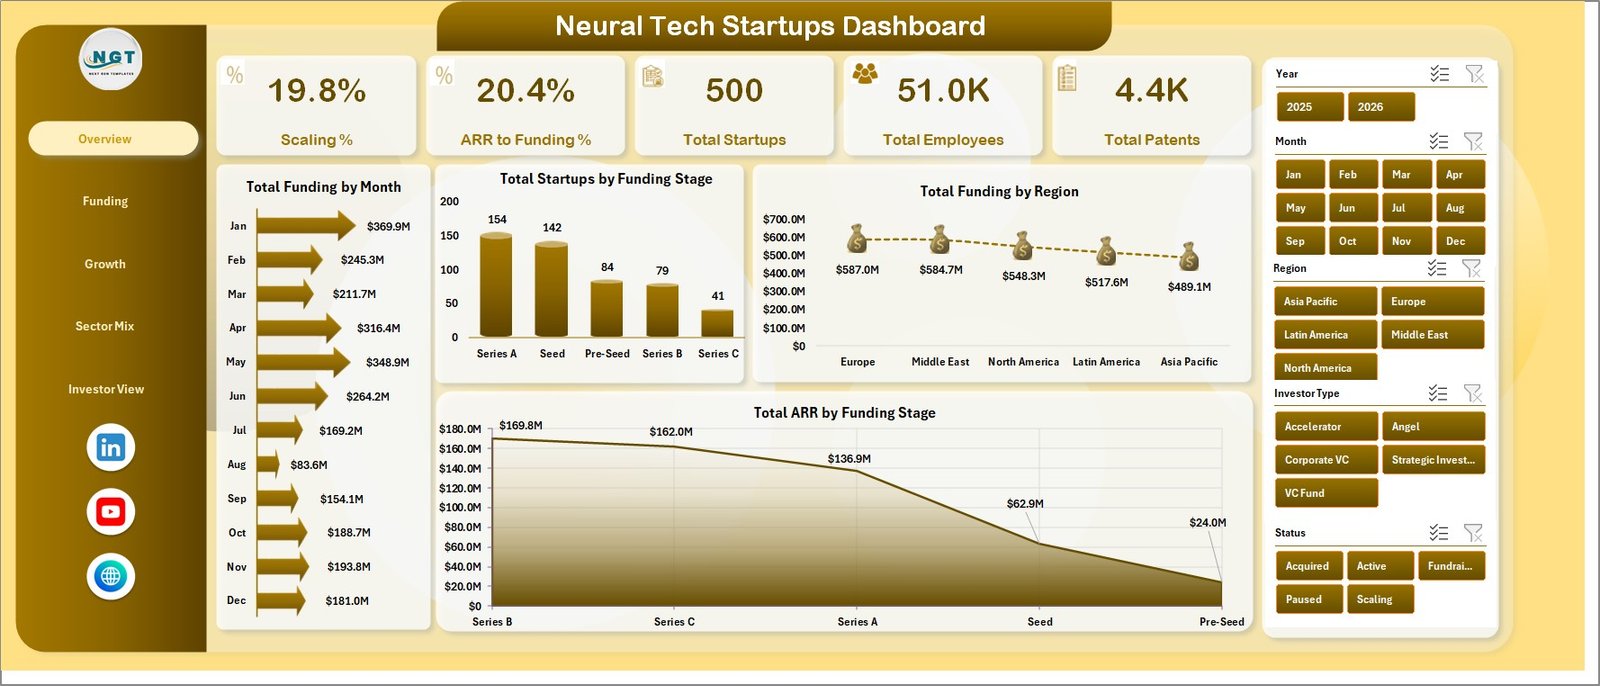
The Overview Page shows Scaling %, ARR to Funding %, Total Startups, Total Employees, and Total Patents. These cards help leaders understand commercialization progress, funding efficiency, portfolio size, workforce scale, and intellectual property output.
Total Funding by Month: This chart tracks monthly funding movement across the startup portfolio. It helps users identify months with stronger capital inflow and periods where funding activity slowed.
Total Startups by Funding Stage: This visual shows how many startups sit in each funding stage. It helps investors understand portfolio maturity across seed, Series A, Series B, growth, or other stages.
Total Funding by Region: This chart compares funding by geography. It helps users see which startup regions are attracting more capital.
Total ARR by Funding Stage: This visual connects recurring revenue with funding stage. It helps teams compare revenue traction across early and later-stage companies.
2 – Funding
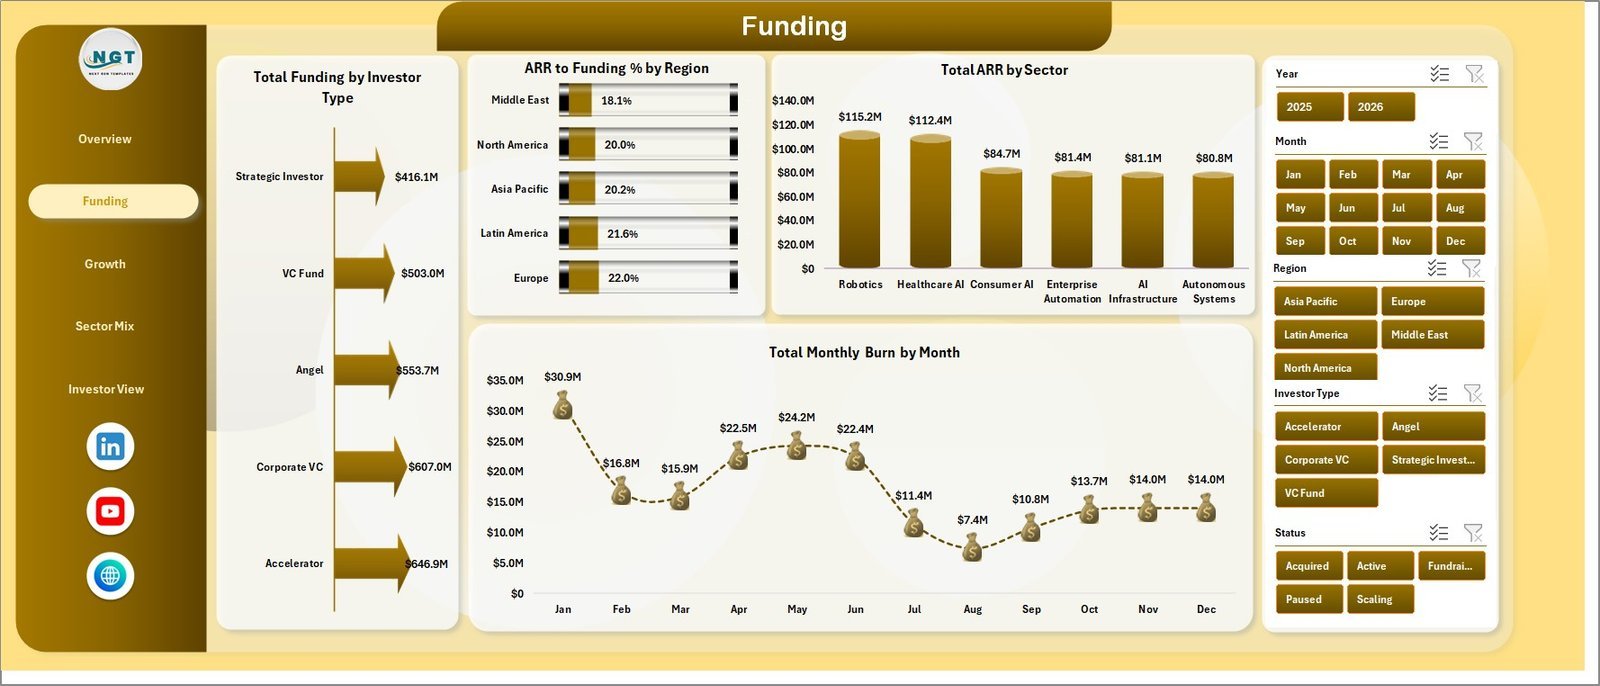
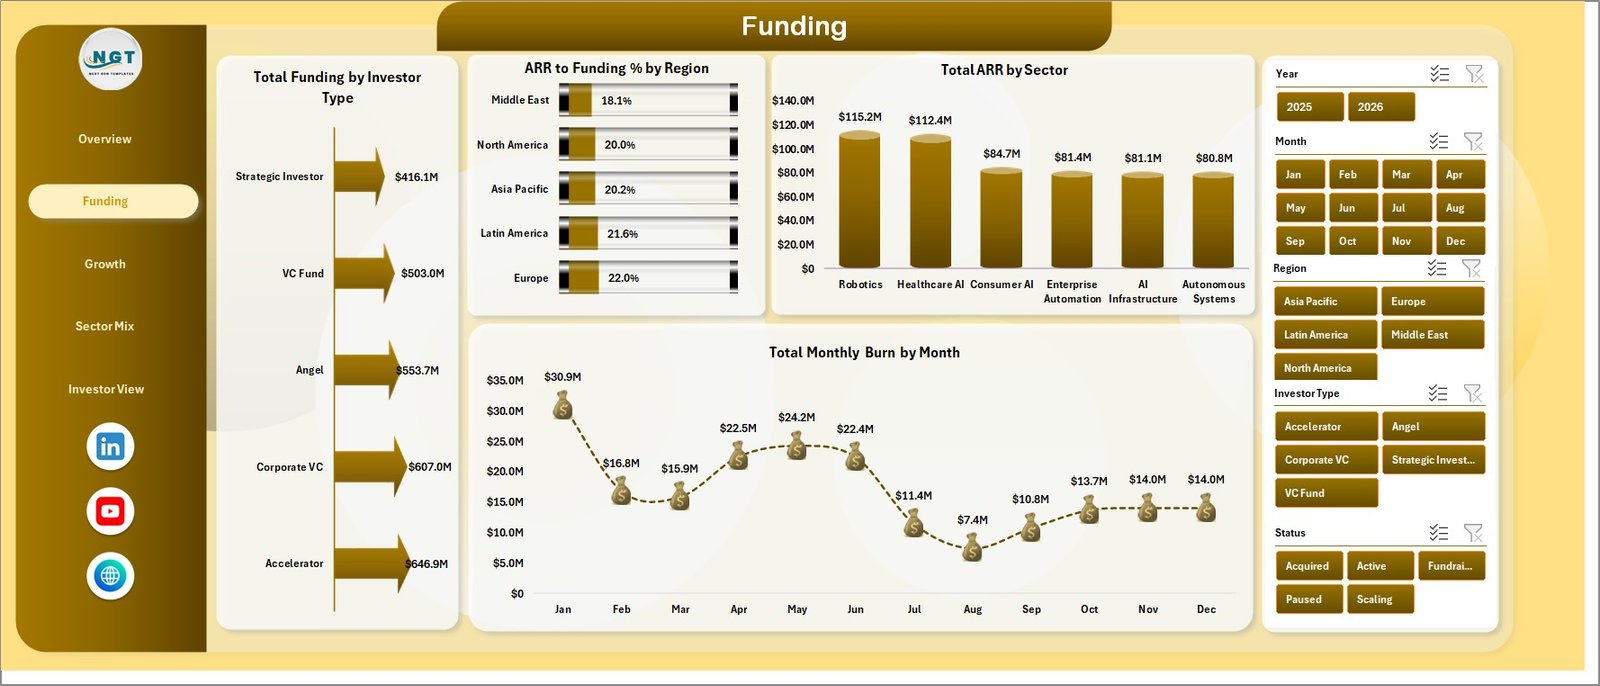
The Funding sheet focuses on capital mix, funding efficiency, revenue by sector, and burn movement.
Total Funding by Investor Type: This chart compares funding contributed by investor groups, including venture funds, angels, corporate investors, grants, and other sources.
ARR to Funding % by Region: This visual compares recurring revenue efficiency by region and helps identify where startups are converting funding into ARR more effectively.
Total ARR by Sector: This chart shows annual recurring revenue by startup sector and highlights where commercial traction is strongest.
Total Monthly Burn by Month: This chart tracks cash burn over time so founders and investors can monitor spending pressure and runway risk.
3 – Growth
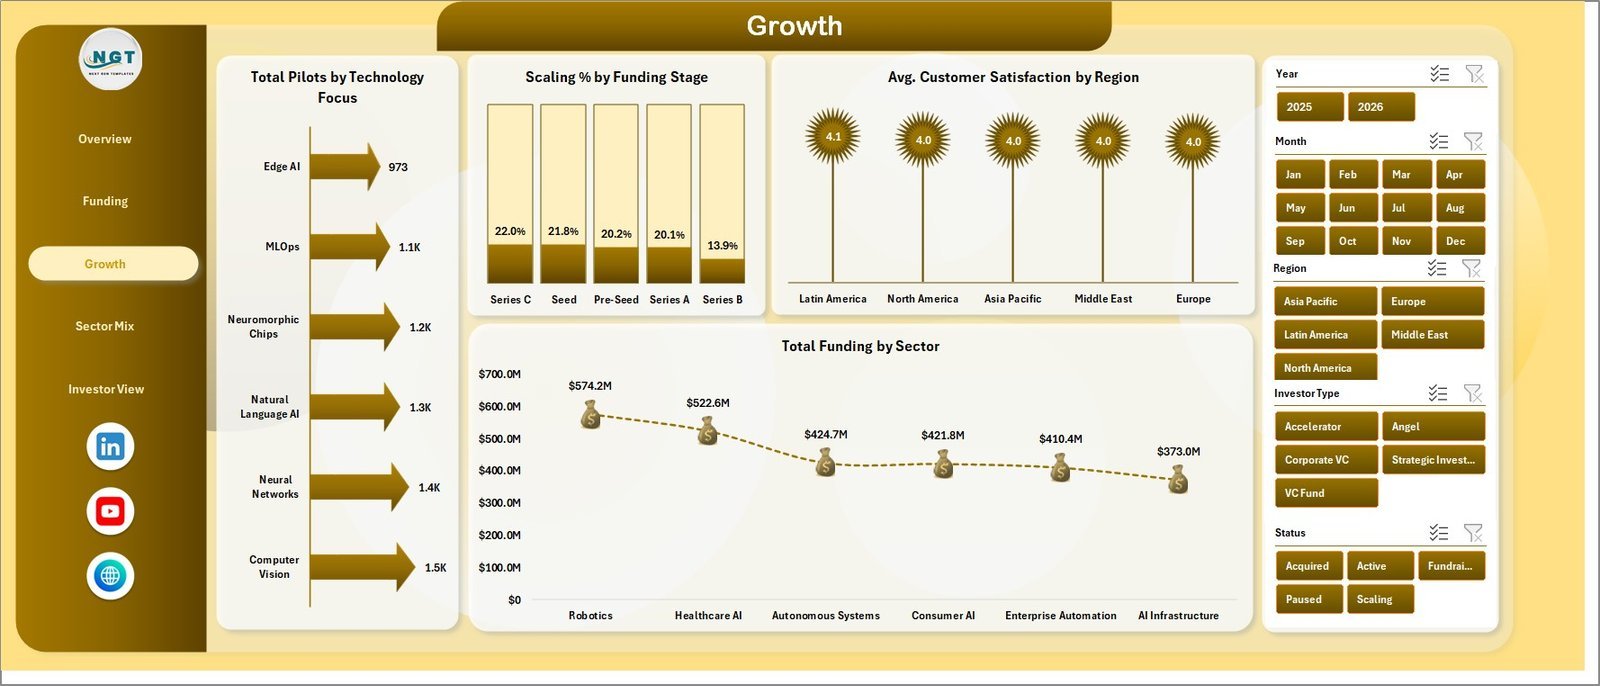
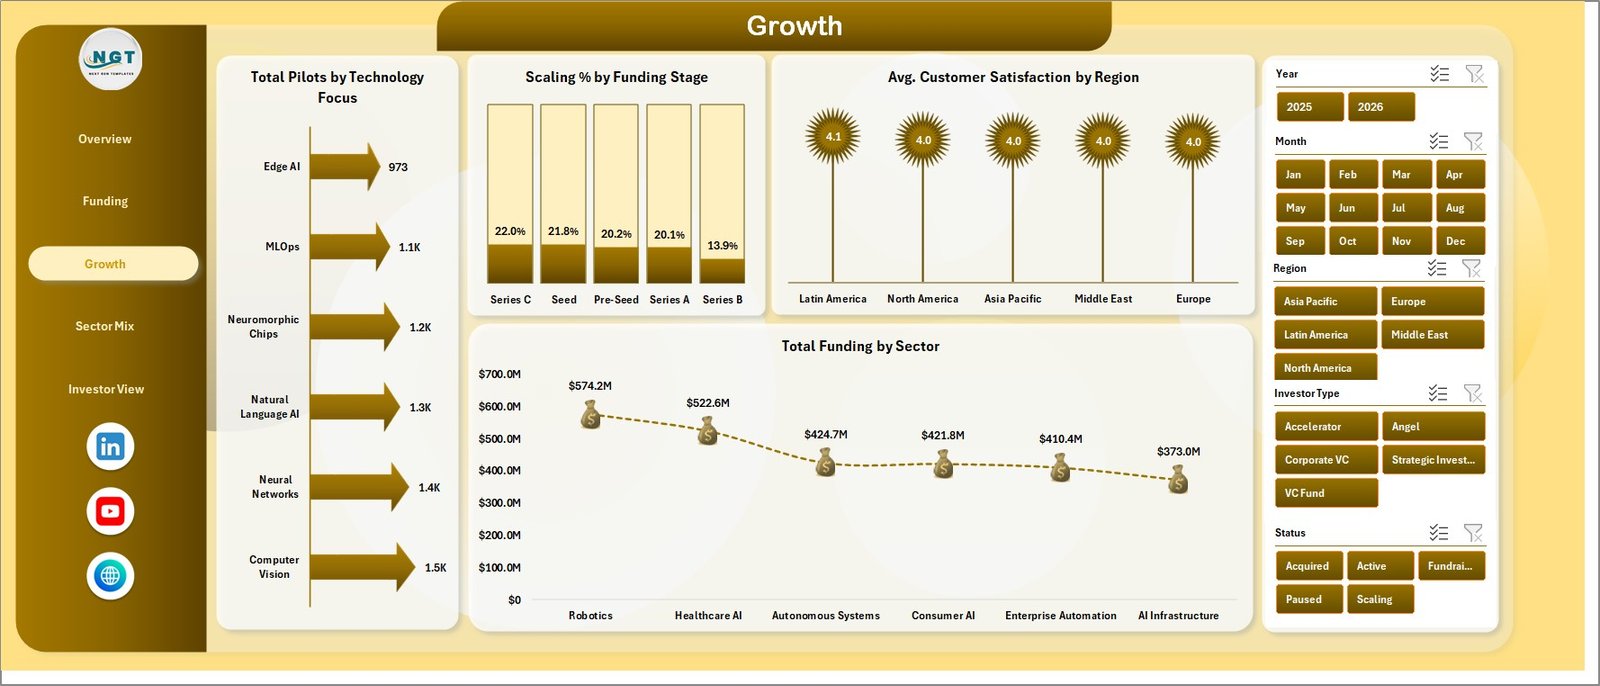
The Growth sheet reviews pilots, scaling rate, customer satisfaction, and sector funding.
Total Pilots by Technology Focus: This chart compares pilot activity across technology focus areas and shows which neural tech categories are getting real-world trials.
Scaling % by Funding Stage: This visual compares scale readiness by funding stage and helps users check whether later-stage companies show stronger scaling signals.
Avg. Customer Satisfaction by Region: This chart compares satisfaction by geography and helps teams understand where product-market fit may be stronger.
Total Funding by Sector: This visual compares capital allocation across sectors and shows which market areas are receiving the most funding.
4 – Sector Mix
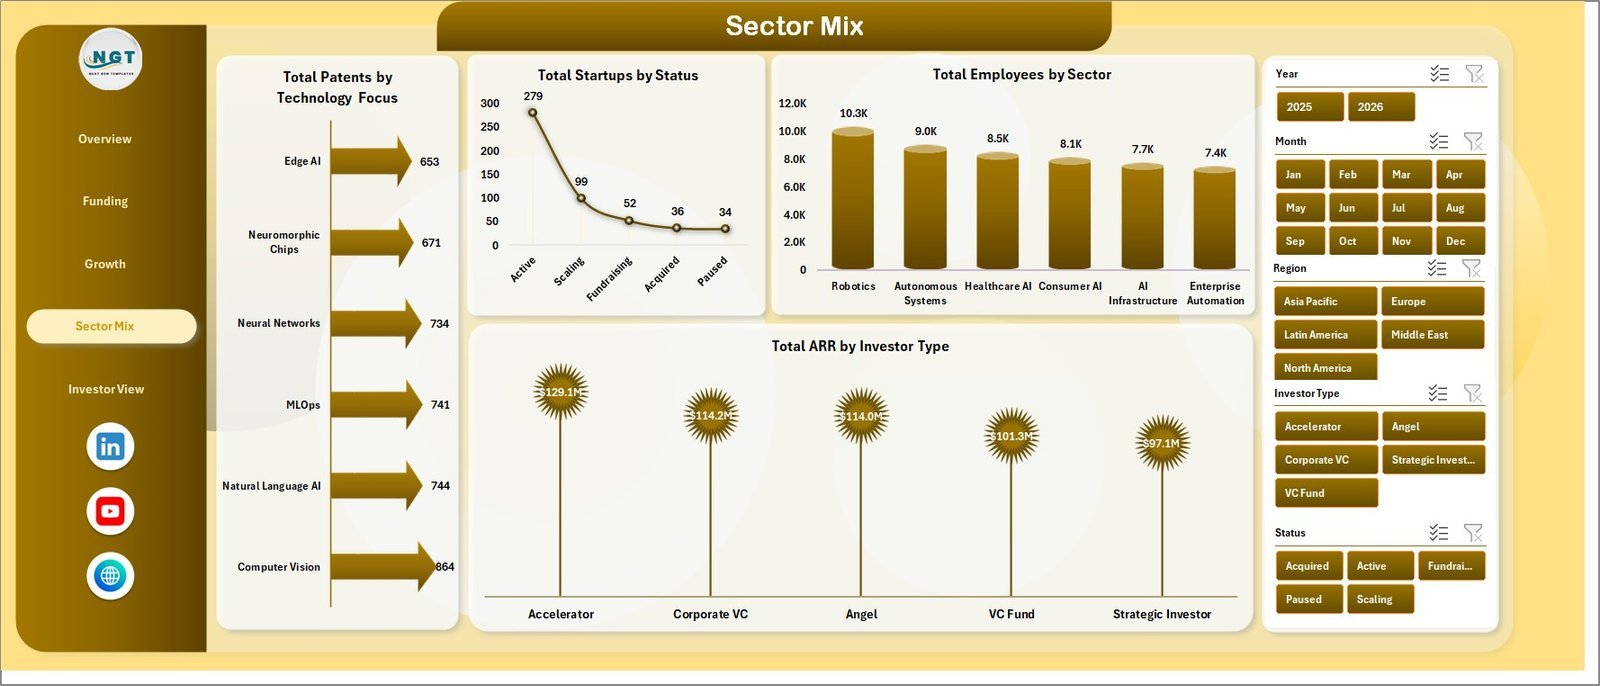
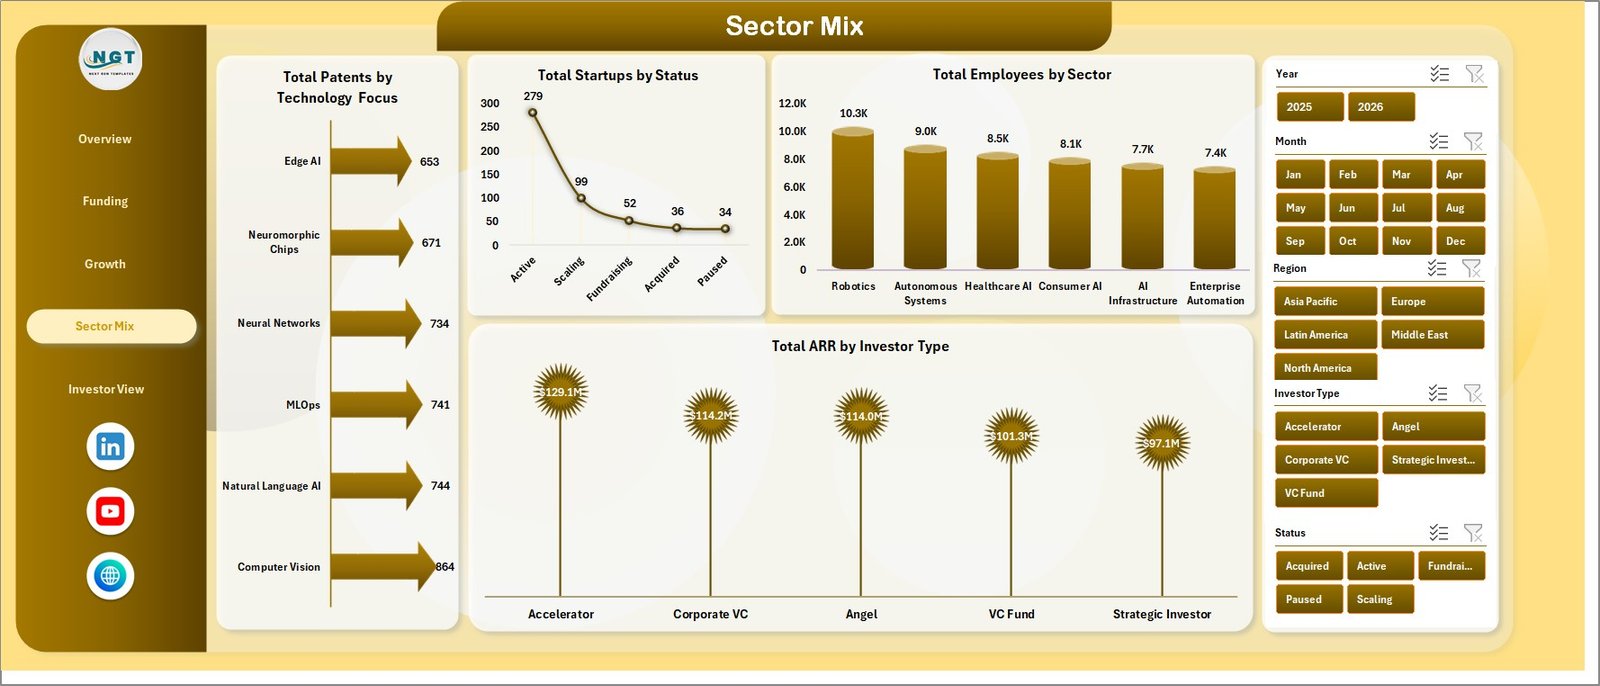
The Sector Mix sheet shows technology focus, startup status, sector workforce, and investor revenue patterns.
Total Patents by Technology Focus: This chart compares patent output by technology focus and shows where intellectual property generation is strongest.
Total Startups by Status: This visual shows startup counts by operating status and helps teams monitor active, paused, acquired, exited, or closed companies.
Total Employees by Sector: This chart compares workforce size by sector and shows where hiring and operating scale are concentrated.
Total ARR by Investor Type: This visual connects ARR with investor type and helps users understand which investor groups are backing stronger recurring revenue companies.
5 – Investor View
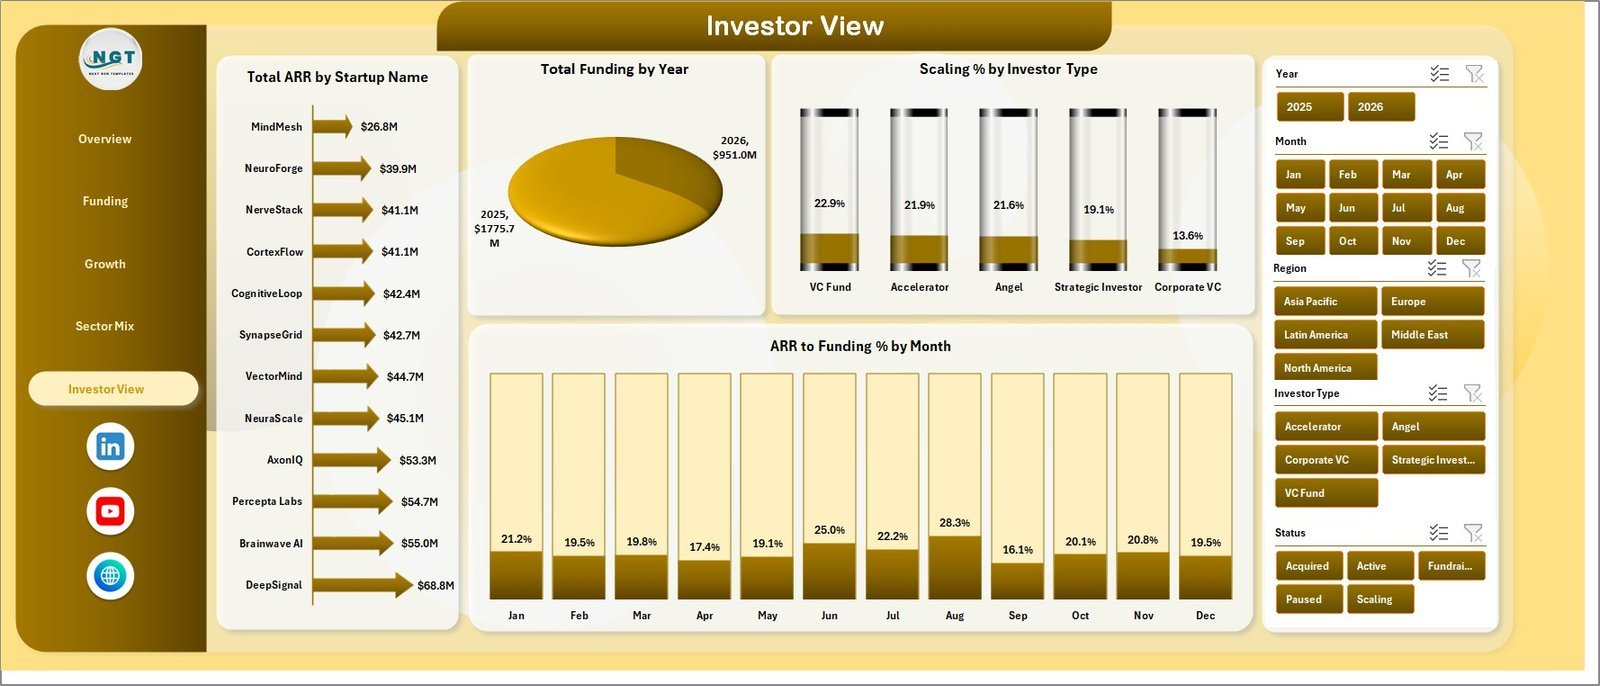
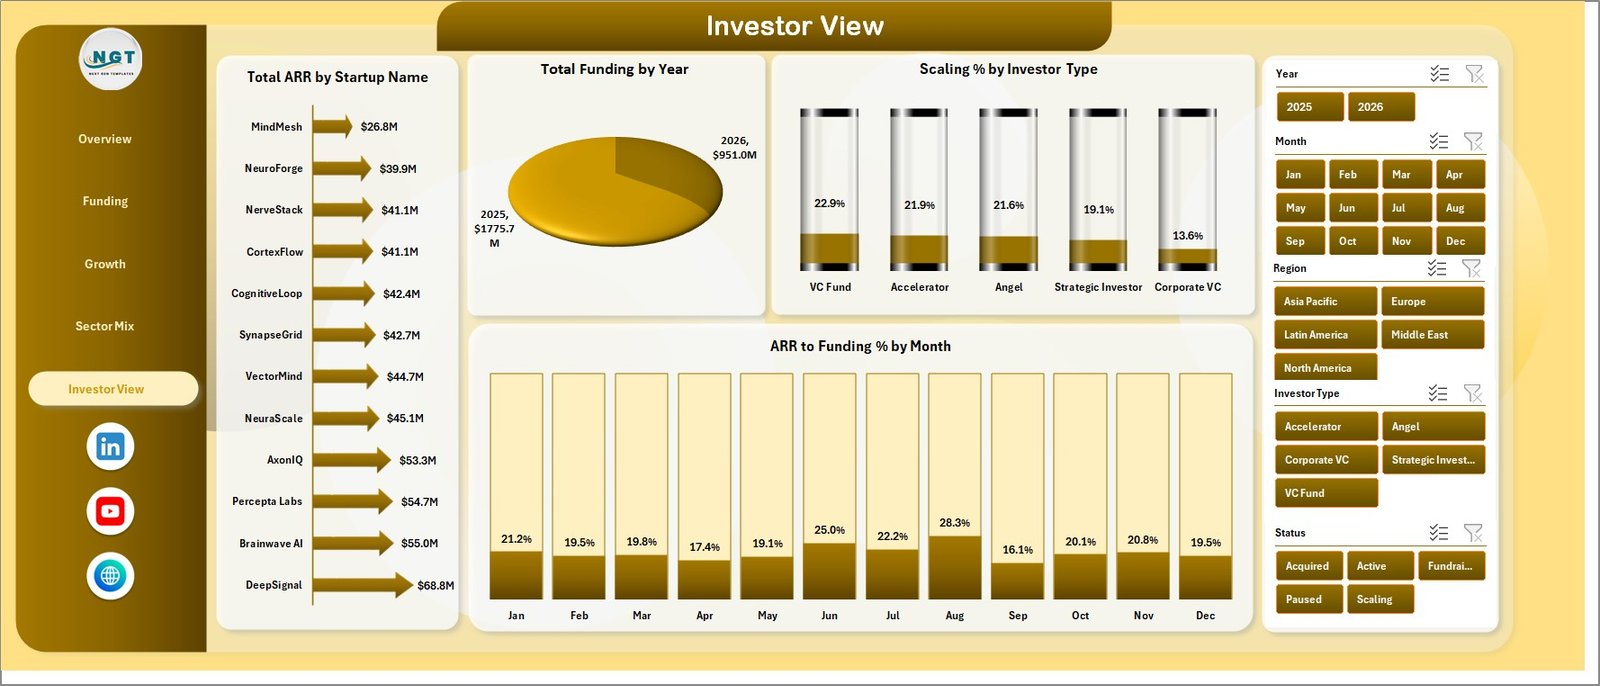
The Investor View sheet gives investor-facing context across startup revenue, annual funding, scaling by investor type, and monthly ARR-to-funding efficiency.
Total ARR by Startup Name: This chart ranks startups by recurring revenue and helps investors identify the strongest revenue generators.
Total Funding by Year: This visual tracks funding across years and helps users review long-term capital movement and fundraising cycles.
Scaling % by Investor Type: This chart compares scaling performance by investor group and shows which capital sources are associated with stronger scaling outcomes.
ARR to Funding % by Month: This chart tracks capital efficiency month by month and shows whether ARR is improving relative to funding raised.
6 – Data Sheet Tab
The Data sheet is where you enter or paste startup records in the same column format. After updating this sheet, refresh the workbook so pivots, slicers, cards, and charts reflect the latest startup data.

7 – Support Sheet
The Support sheet contains pivot tables used to create the dashboard dynamically. After changing the Data sheet, go to the Data tab in the Excel Ribbon and click Refresh All. You can keep this sheet hidden after setup.

Neural Tech Startups Dashboard in Excel vs. Google Sheets vs. Paid CRM/SaaS – Where This Fits
| Feature | This Excel dashboard | Google Sheets alternative | Paid startup CRM/SaaS |
|---|---|---|---|
| Cost | $17.99 sale price, one-time | Low tool cost but manual setup | Recurring subscription |
| Platform | Microsoft Excel | Browser-based spreadsheet | Vendor-hosted platform |
| Setup time | Replace sample data and refresh pivots | Build formulas/charts or adapt a sheet | Implementation and onboarding |
| Customizable fields | Edit sheets, pivots, charts, labels, and source rows | Editable but formula care may be needed | Limited by vendor configuration |
| Year-1 cost at 5 users | $17.99 plus Microsoft licensing if needed | Low software cost plus build time | Often hundreds or thousands |
| Startup analytics | Funding, ARR, burn, patents, pilots, sectors, stages, regions, investors, and scaling views included | Must be built or adapted | Depends on module and pricing tier |
Who This Template Is For – and Who It’s Not For
This template is for neural tech startup founders, AI accelerator teams, venture capital analysts, innovation hubs, startup finance teams, incubators, research commercialization teams, and portfolio managers who need a repeatable Excel reporting workbook.
It is not a cap table platform, investor CRM, accounting system, payroll tool, live bank feed, legal diligence system, or automated data connector.
How to Use the Neural Tech Startups Dashboard in Excel
- Download and unzip the template package.
- Open the workbook in Microsoft Excel.
- Replace the sample rows in the Data sheet with your own startup portfolio data.
- Go to the Excel Data tab and click Refresh All.
- Use slicers to filter by month, year, region, funding stage, sector, investor type, technology focus, or status.
Real-World Use Cases
Anika, accelerator program manager: reviews Total Startups, pilots, scaling %, patents, and sector funding before preparing a demo day portfolio update.
Marcus, venture analyst: compares ARR to Funding %, burn, funding stage, investor type, and region before shortlisting companies for deeper diligence.
Dev, neural tech founder: uses the Funding and Growth pages to explain fundraising progress, commercial traction, and pilot activity during board updates.
Frequently Asked Questions
What does this dashboard track?
It tracks scaling %, ARR to Funding %, startups, employees, patents, funding, ARR, burn, pilots, satisfaction, sectors, regions, stages, investor types, status, technology focus, months, and years.
Do I need advanced Excel skills?
No. You mainly replace the sample records and click Refresh All.
Can I use it for a startup accelerator portfolio?
Yes. It is suited for accelerators, incubators, innovation hubs, and investors that manage multiple startup records.
Does it connect directly to investor CRM tools?
No. Direct CRM or API connectors are not included. Export your startup data or maintain it manually in the Data sheet, then refresh the workbook.
Is this a subscription?
No. It is a one-time downloadable Excel template from NextGenTemplates.
About the Author
Built by PK – Microsoft Certified Professional with 15+ years of Excel, Google Sheets, and Power BI experience. Founder of NextGenTemplates, reaching 300K+ subscribers across YouTube channels. Every template is hand-built and tested before release.
Explore Related Templates
- Meme Marketing Dashboard in Excel
- Geothermal Energy Dashboard in Power BI
- Knowledge Hubs Dashboard in Power BI
- Browse MS Excel templates
- Browse Excel dashboard templates
Read the supporting blog post: Neural Tech Startups Dashboard in Excel.
Download the Neural Tech Startups Dashboard in Excel and start reviewing startup funding, ARR, burn, pilots, patents, sectors, investor types, regions, and scaling performance in one editable workbook.
Last updated: July 11, 2026.















Reviews
There are no reviews yet.