

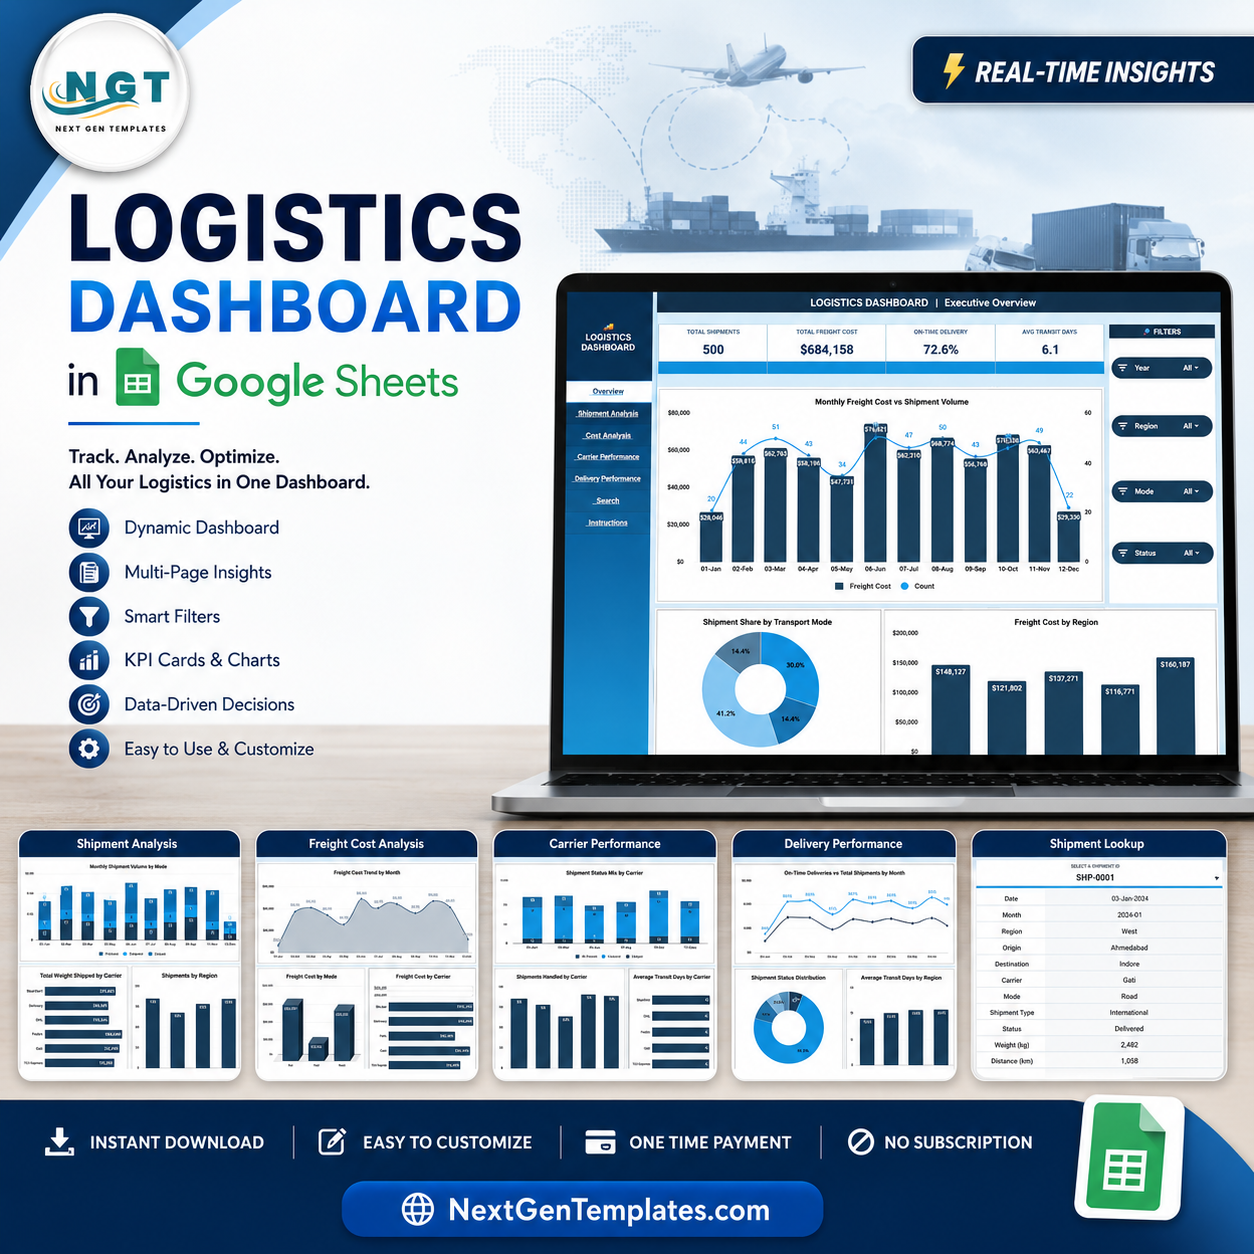

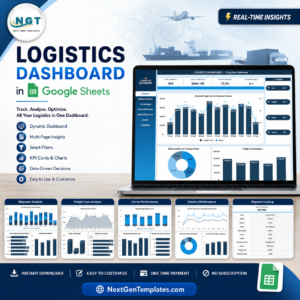
Logistics Dashboard in Google Sheets gives logistics teams 7 ready-to-use sheet tabs, 4 high-level KPI cards, 12 chart views, slicers, a Shipment ID lookup, and a structured Data Sheet for recurring freight reporting. Built by PK, whose spreadsheet tutorials reach 300K+ subscribers, this template helps managers replace scattered shipment files with one browser-based dashboard. If the downloaded file does not match this page, it is covered by a 7-day file-match review.
Key Features of Logistics Dashboard in Google Sheets
- 7 Google Sheets tabs: Overview, Shipment Analysis, Freight Cost Analysis, Carrier Performance, Delivery Performance, Search Sheet, and Data Sheet.
- 4 KPI cards: Total Shipments, Total Freight Cost, On-Time Delivery, and Avg Transit Days.
- 12 chart views: Review freight cost, shipment volume, transport mode, region, carrier, status, weight, and transit time.
- Interactive slicers: Filter the dashboard quickly without rebuilding formulas or charts.
- Shipment ID lookup: Select one shipment and view the matching record details instantly.
- Editable Data Sheet: Replace the sample rows using the same columns so the dashboard keeps updating.
- Google Sheets collaboration: Share view or edit access with your operations, logistics, finance, or supply chain team.
What’s Inside the Logistics Dashboard in Google Sheets
Overview Page
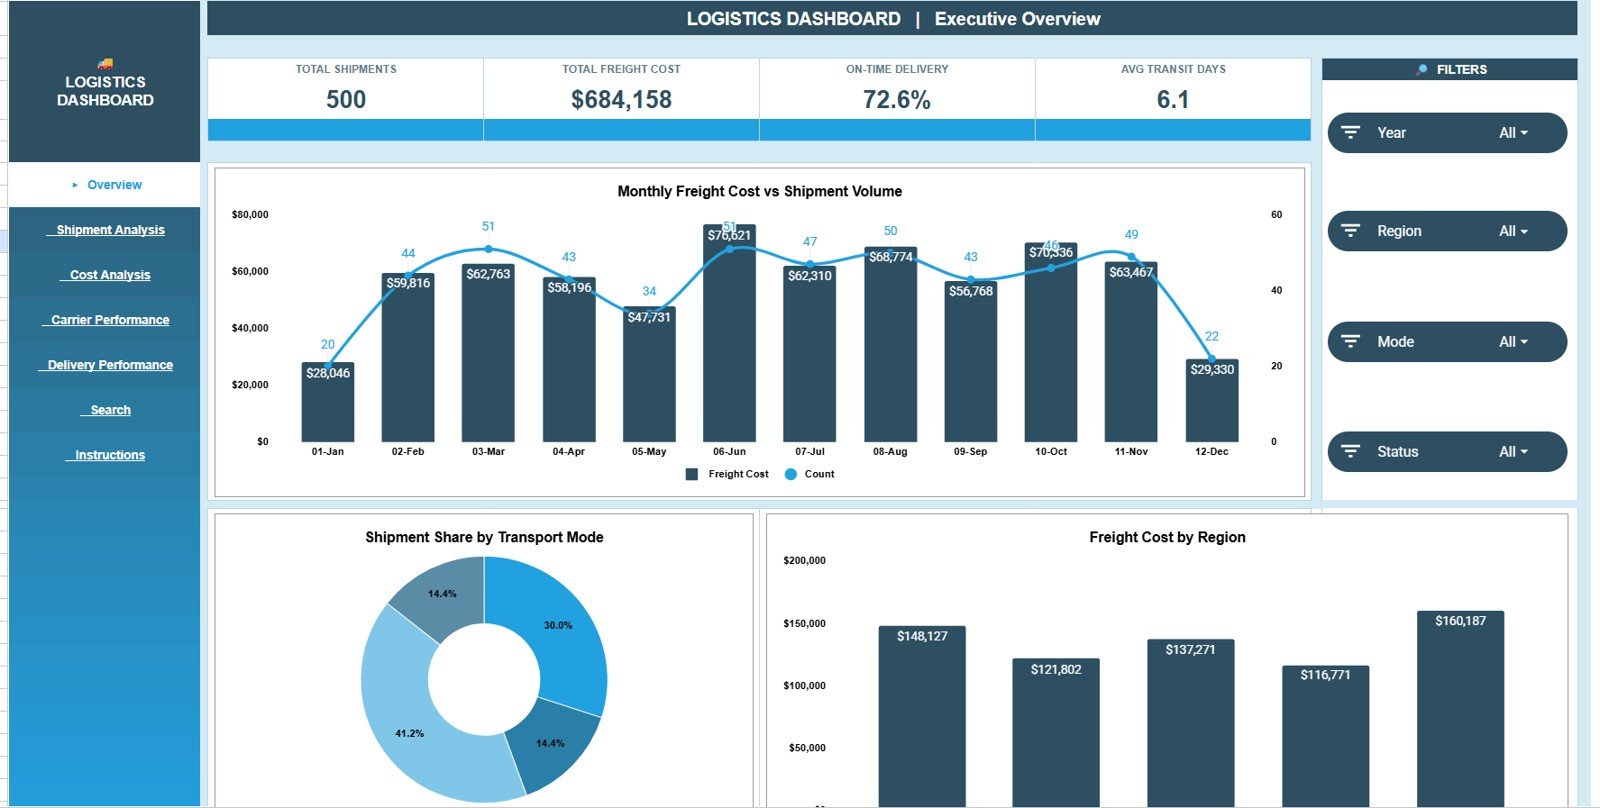
The Overview page is the executive summary tab. It shows Total Shipments, Total Freight Cost, On-Time Delivery, and Avg Transit Days at the top, then uses slicers and charts for fast logistics review.
Freight Cost and Shipment Volume by Month: This chart compares monthly freight cost with shipment count. It helps you see whether spend is rising because of shipment growth or cost pressure.
Shipment Share by Transport Mode: This chart breaks shipments across road, air, rail, sea, or other modes. It helps teams understand how freight volume is distributed by transport type.
Freight Cost by Region: This chart compares logistics spend by region. It helps identify regions that need carrier review, routing changes, or freight-cost investigation.
Shipment Analysis
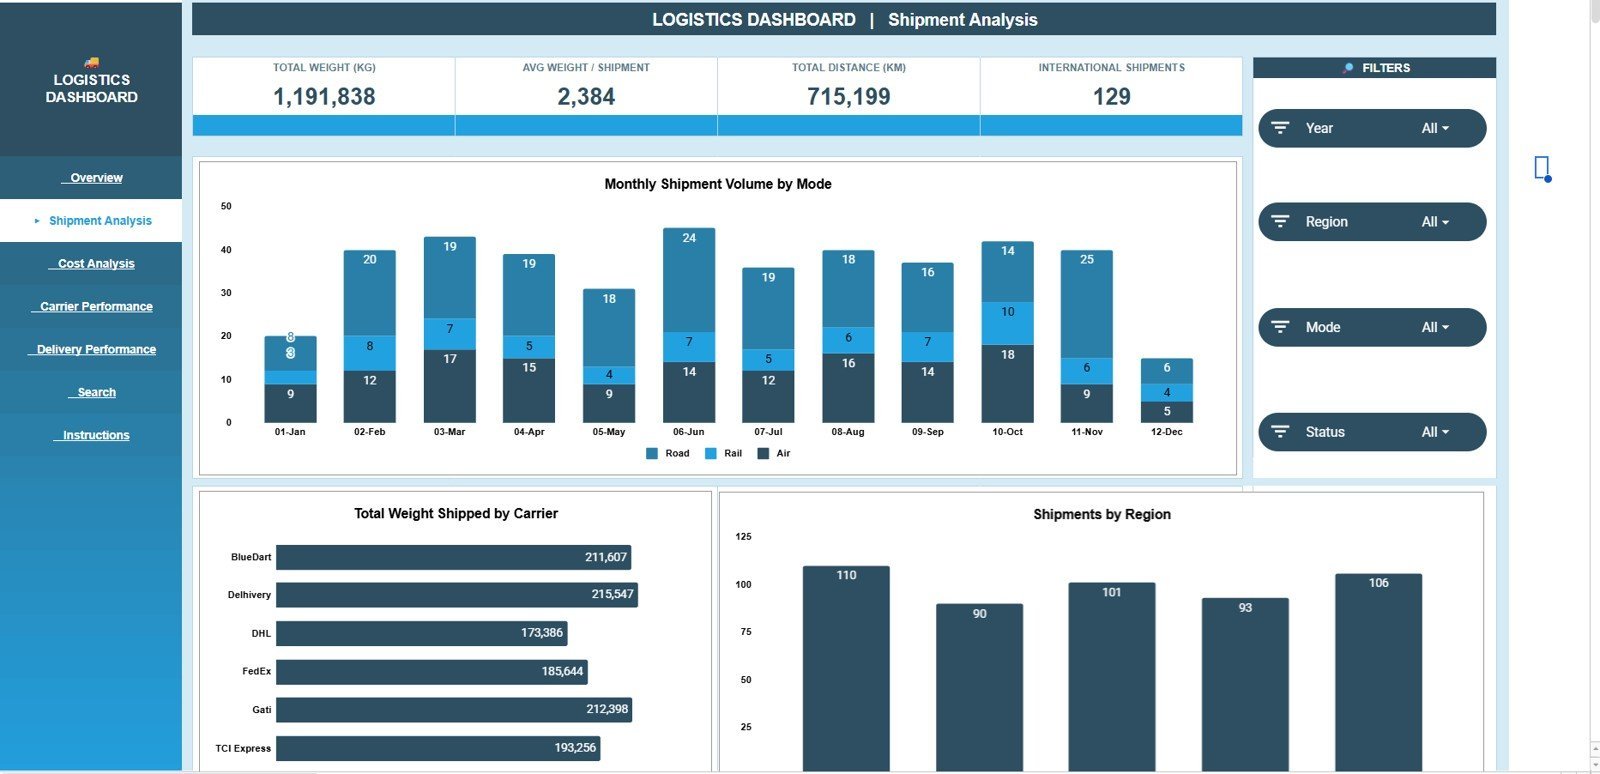
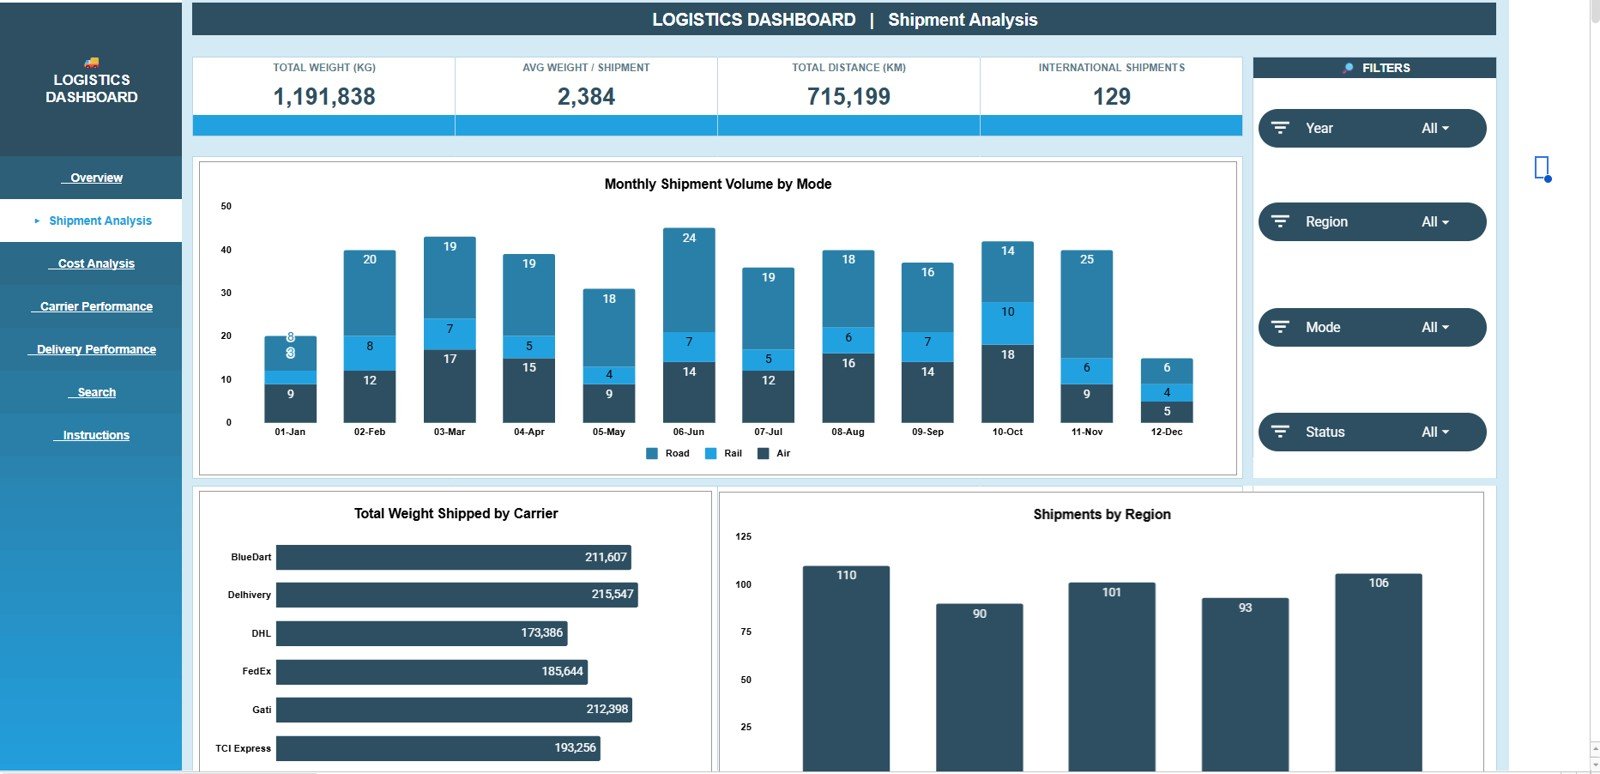
The Shipment Analysis tab focuses on shipment movement and volume. It helps operations teams compare monthly volume, transport mode, carrier workload, total shipped weight, and regional shipment contribution.
Shipment Volume by Month and Mode: This chart shows shipment counts over time by transport mode. It helps you spot mode shifts, seasonal volume changes, and capacity pressure.
Total Weight Shipped by Carrier: This chart compares how much weight each carrier handled. It helps review workload distribution and identify carriers carrying the heaviest freight.
Shipments by Region: This chart summarizes shipment volume by region. It helps managers see which markets, branches, or zones drive the most logistics activity.
Freight Cost Analysis
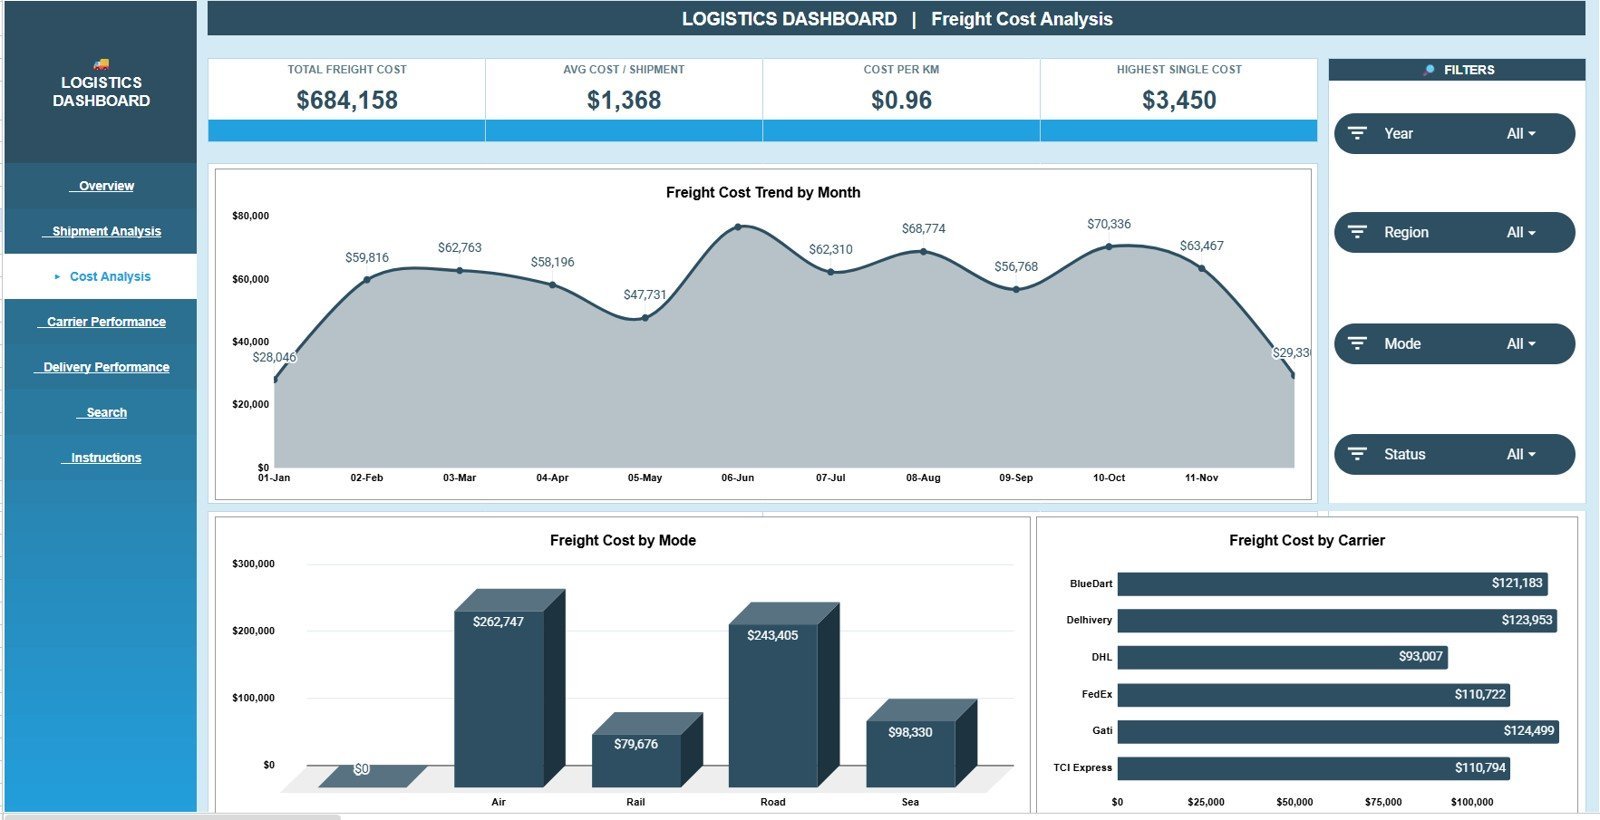
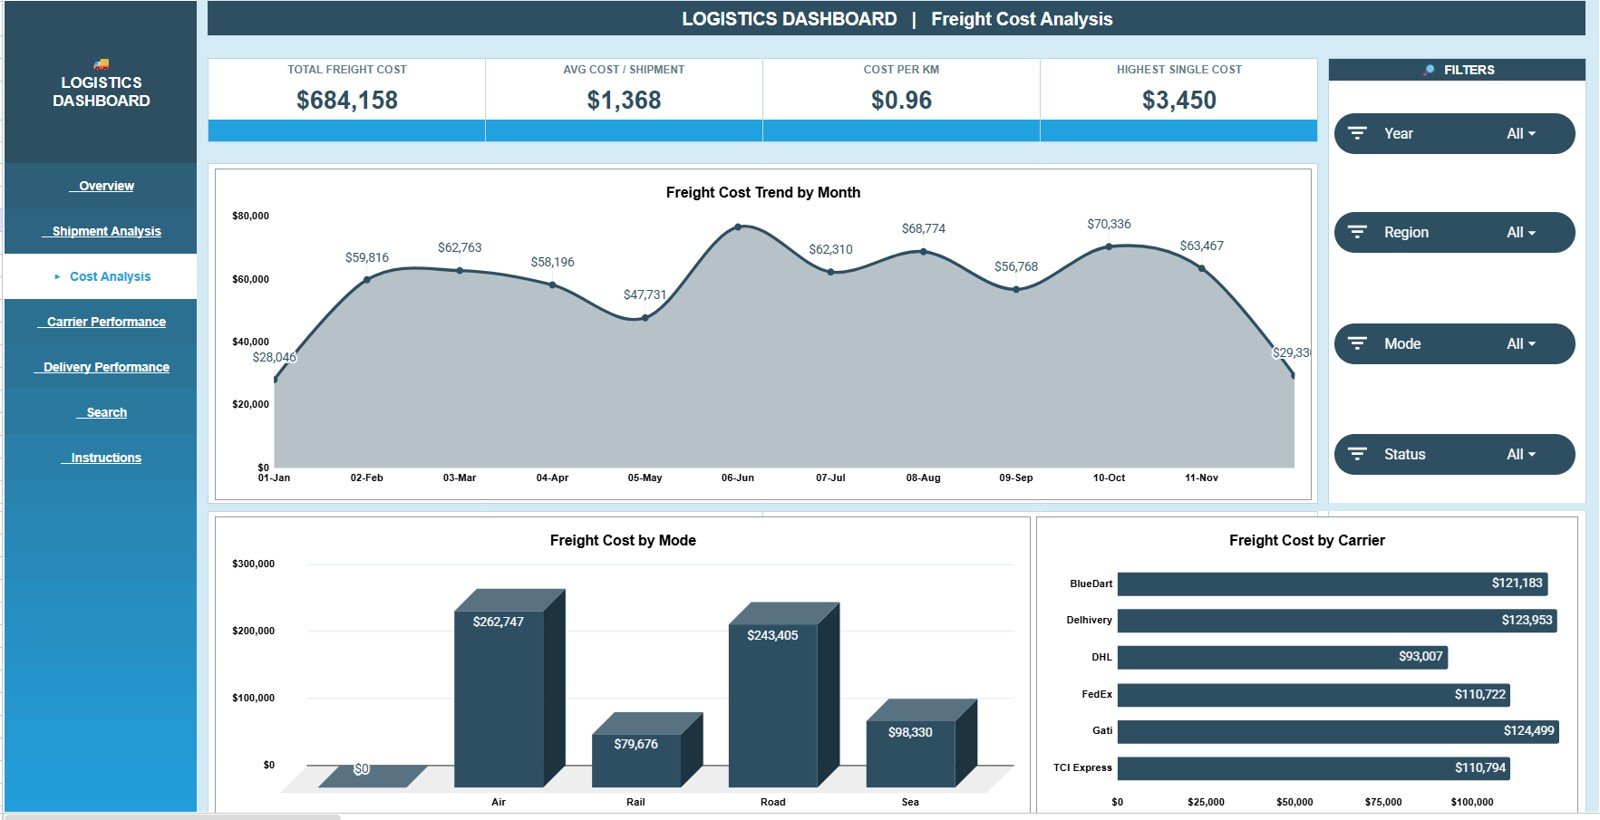
The Freight Cost Analysis tab is built for cost control. It separates freight spend by month, transport mode, and carrier so finance and logistics teams can review cost drivers clearly.
Freight Cost by Month: This chart shows monthly freight spend. It helps identify cost spikes, seasonal peaks, or months that need deeper audit.
Freight Cost by Mode: This chart compares spend across transport modes. It helps reveal whether air, road, rail, sea, or mixed modes are driving cost.
Freight Cost by Carrier: This chart ranks carrier-level freight cost. It helps teams compare partners and prepare data-backed contract discussions.
Carrier Performance
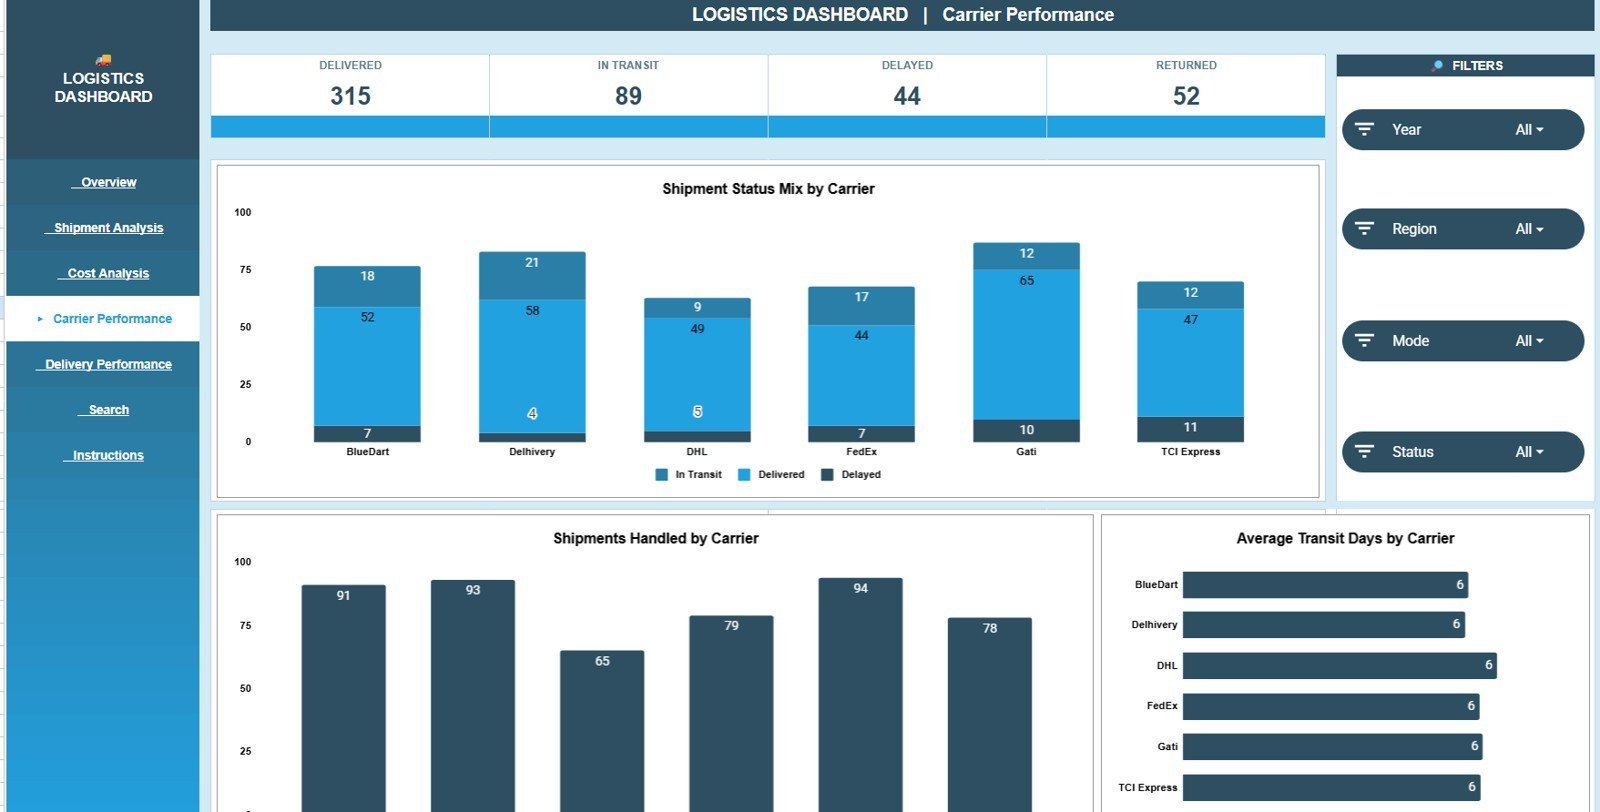
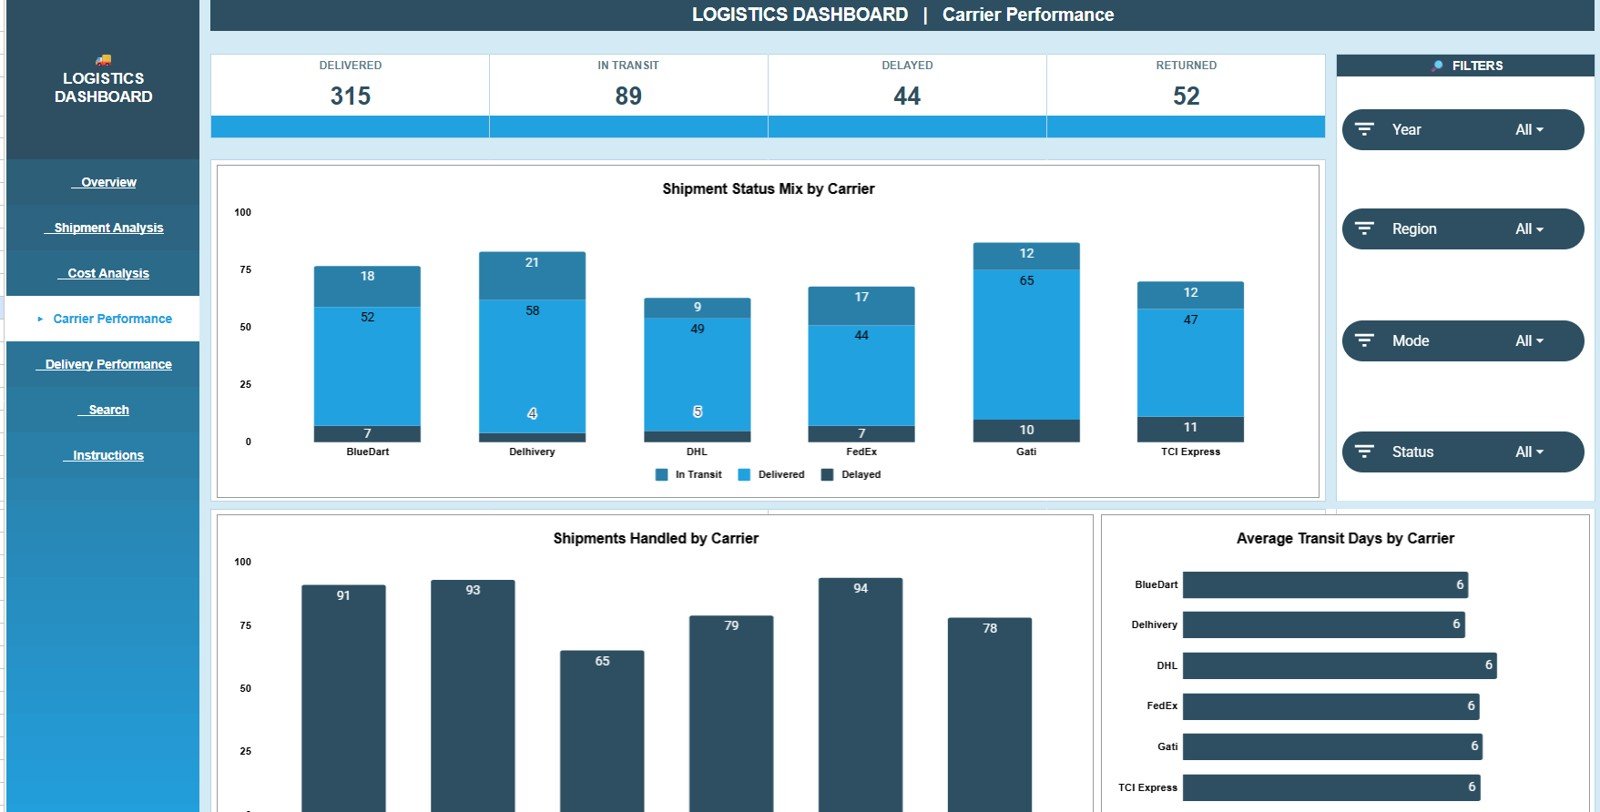
The Carrier Performance tab helps you evaluate how carriers handle workload, shipment status, and average transit time. It is useful for monthly carrier scorecards and vendor review meetings.
Shipment Status Mix by Carrier: This chart compares delivery, in-transit, delayed, or other status outcomes by carrier. It helps identify carriers with reliability or follow-up issues.
Shipments Handled by Carrier: This chart compares shipment volume by carrier. It helps show dependency on specific carriers and workload balance.
Average Transit Days by Carrier: This chart compares average transit time across carriers. It helps choose partners based on speed as well as cost.
Delivery Performance
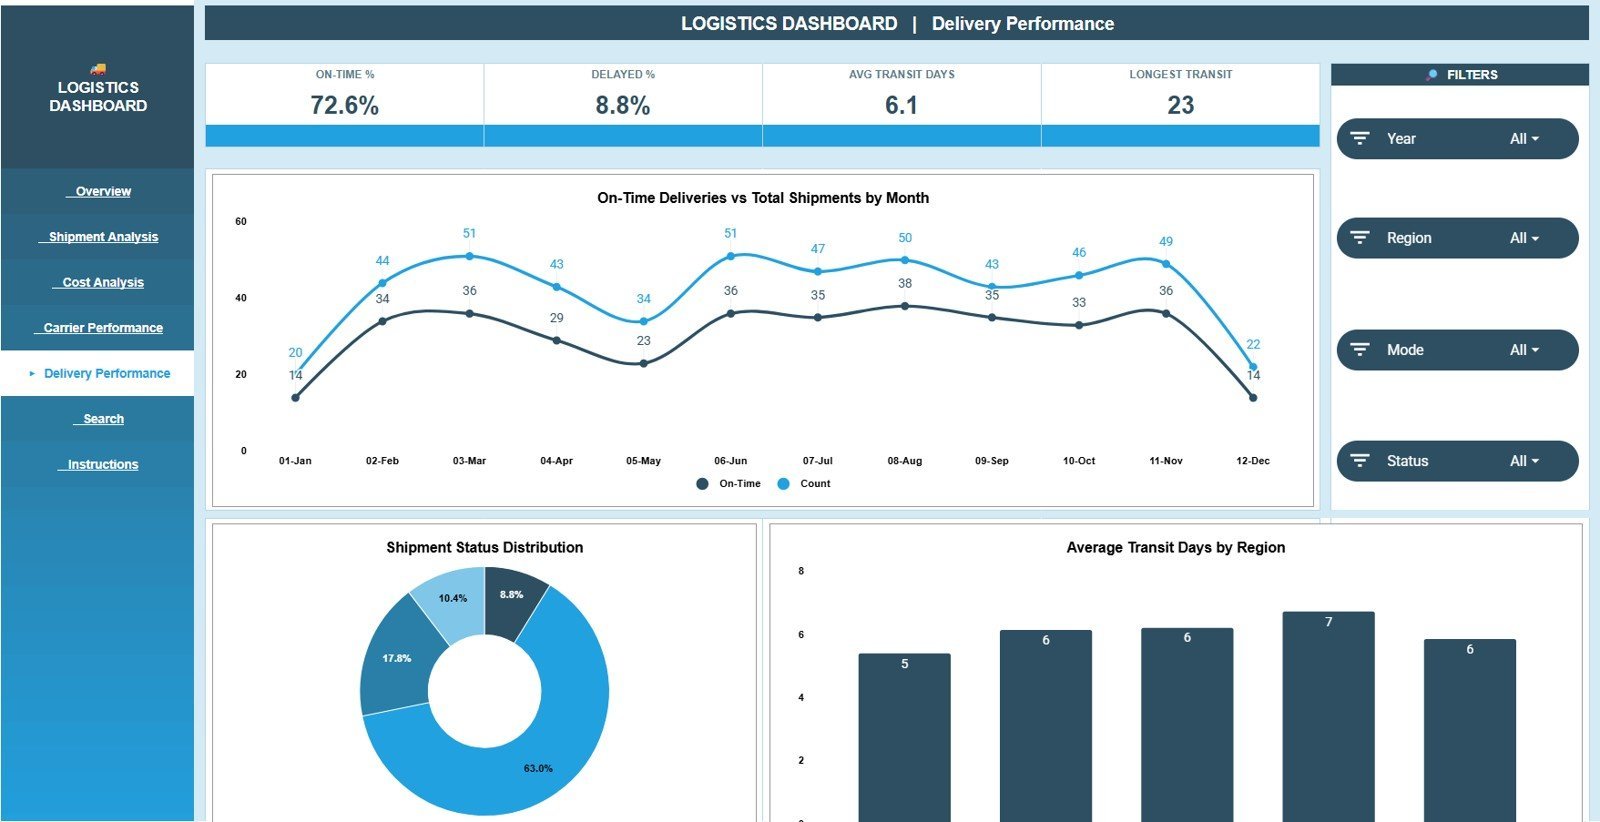
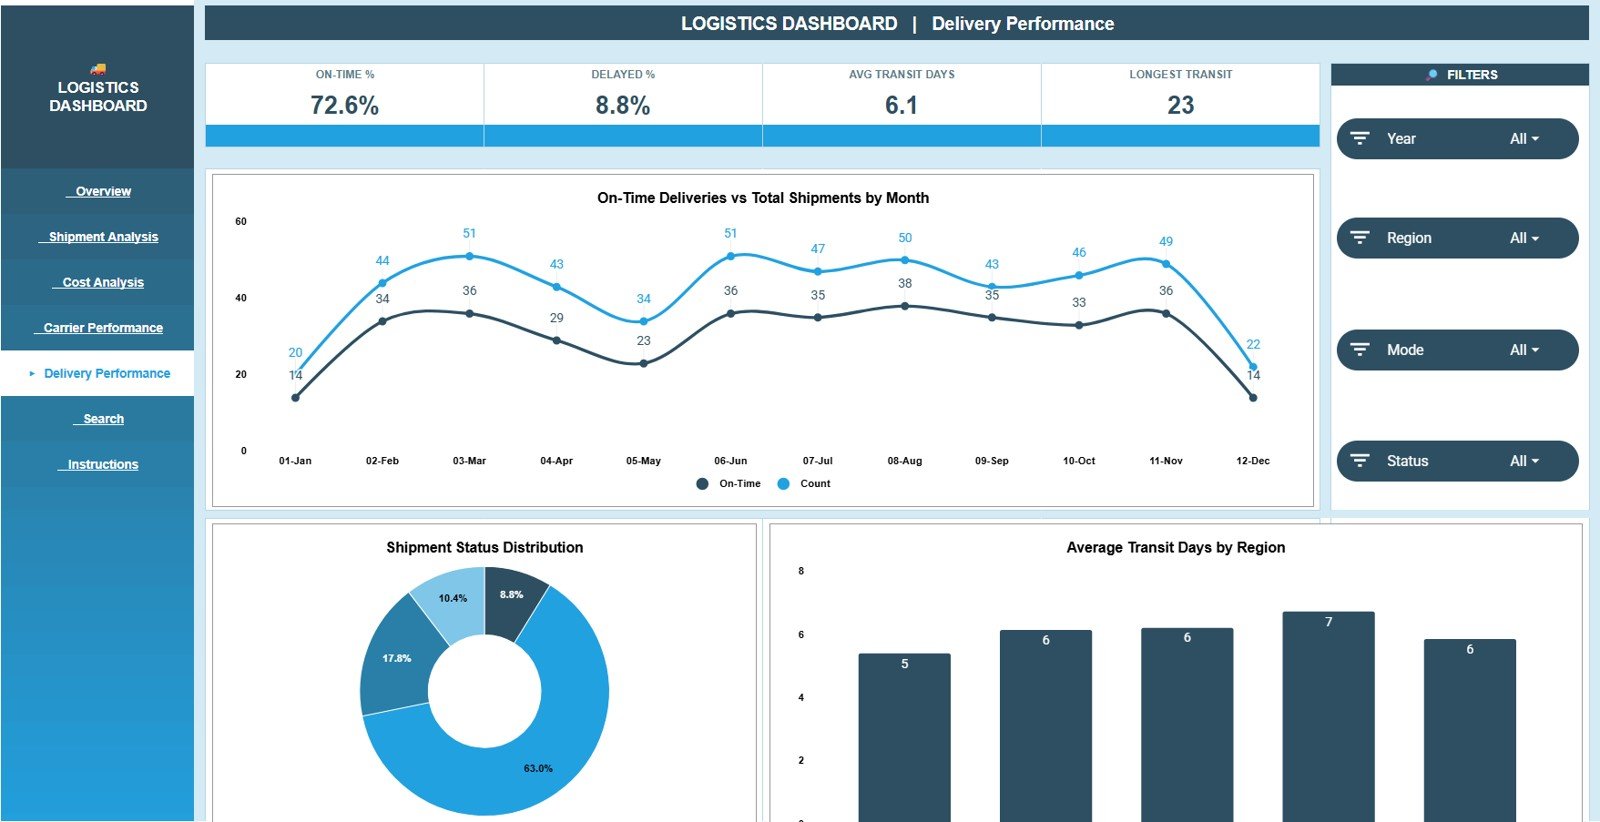
The Delivery Performance tab tracks whether shipments are arriving on time and how transit days vary by month, status, and region. It helps teams turn delivery issues into visible metrics.
On-Time Deliveries and Total Shipments by Month: This chart compares total shipment volume with on-time deliveries. It helps measure whether delivery quality is keeping pace with volume.
Shipments by Status: This chart breaks shipments by status. It helps managers see open, delayed, completed, or exception records quickly.
Average Transit Days by Region: This chart compares transit speed by region. It helps identify lanes or zones where shipments take longer than expected.
Search Sheet Tab
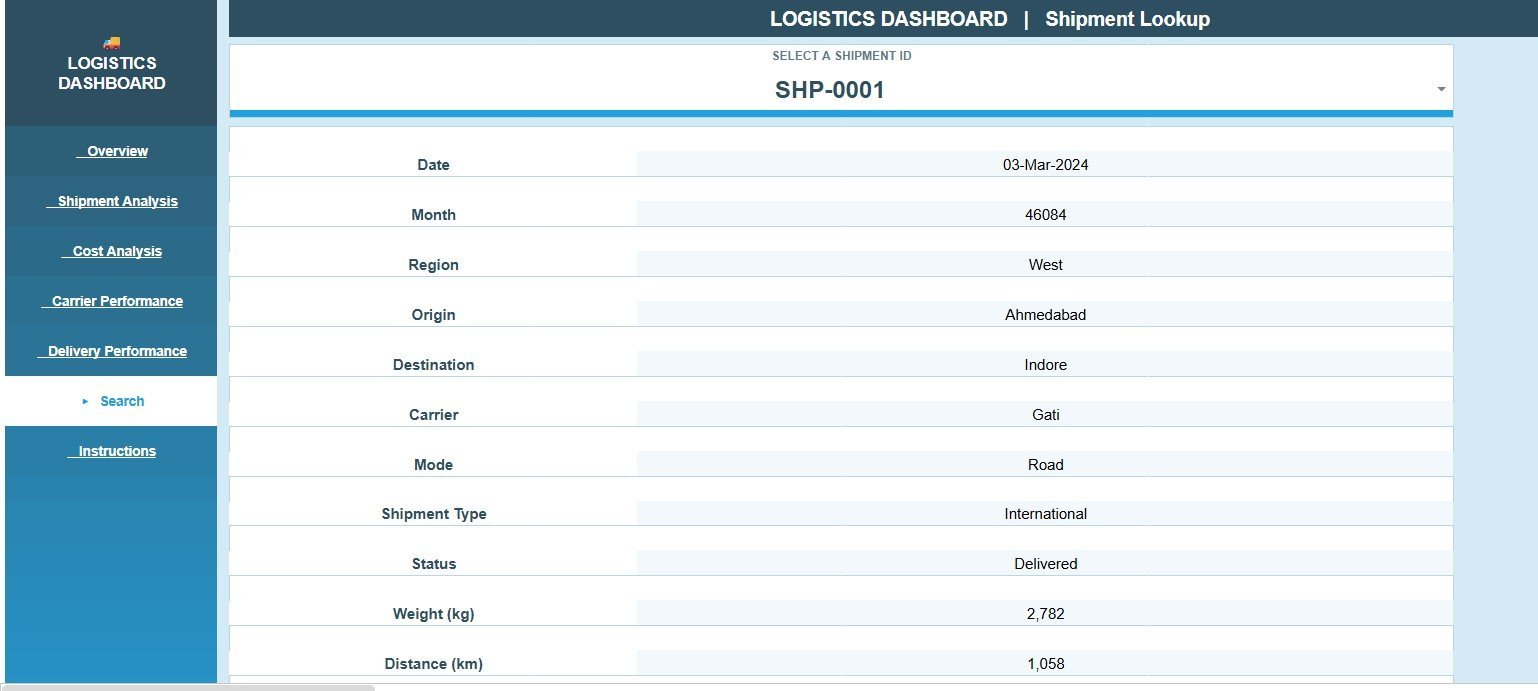
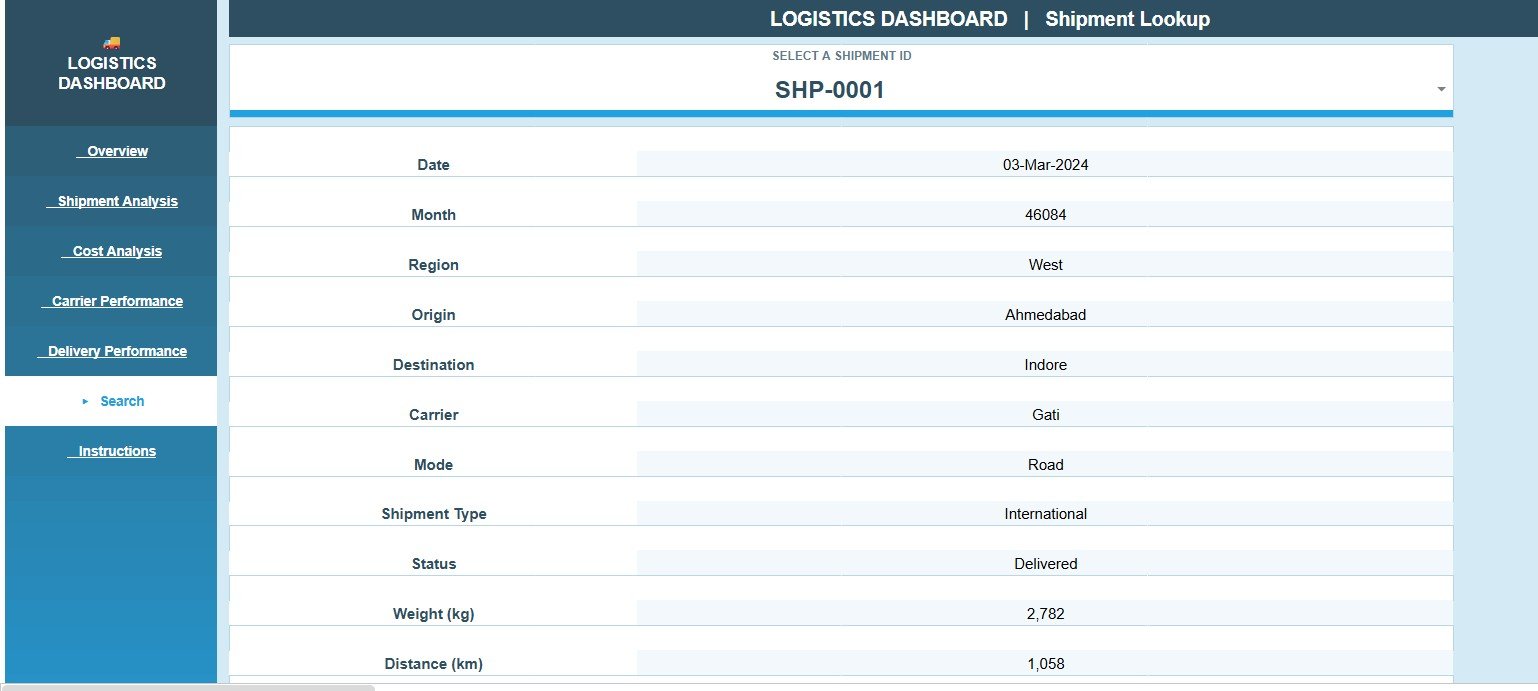
The Search Sheet is the Shipment Lookup tab. Select a Shipment ID and the sheet returns matching shipment details such as date, region, origin, destination, carrier, mode, shipment type, status, weight, and distance.
Data Sheet Tab
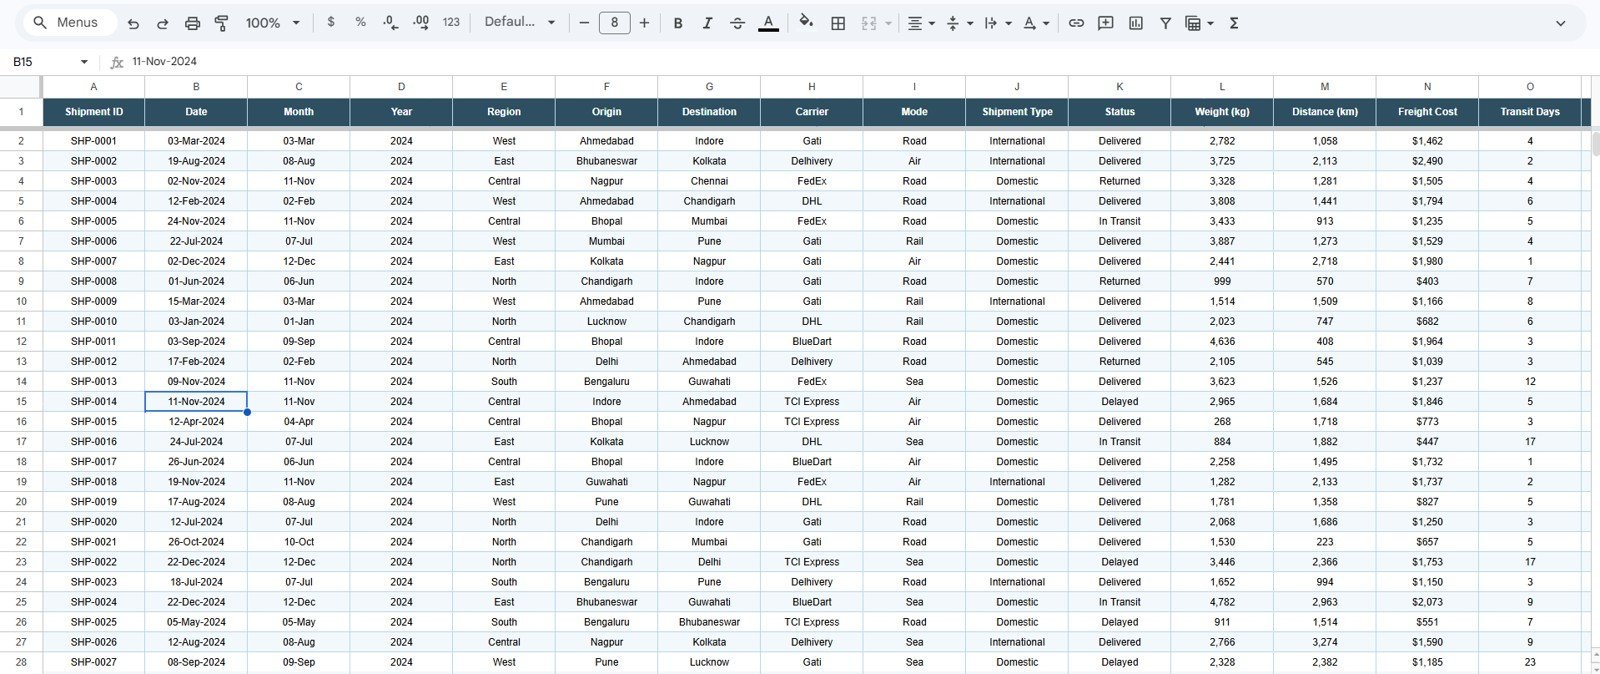
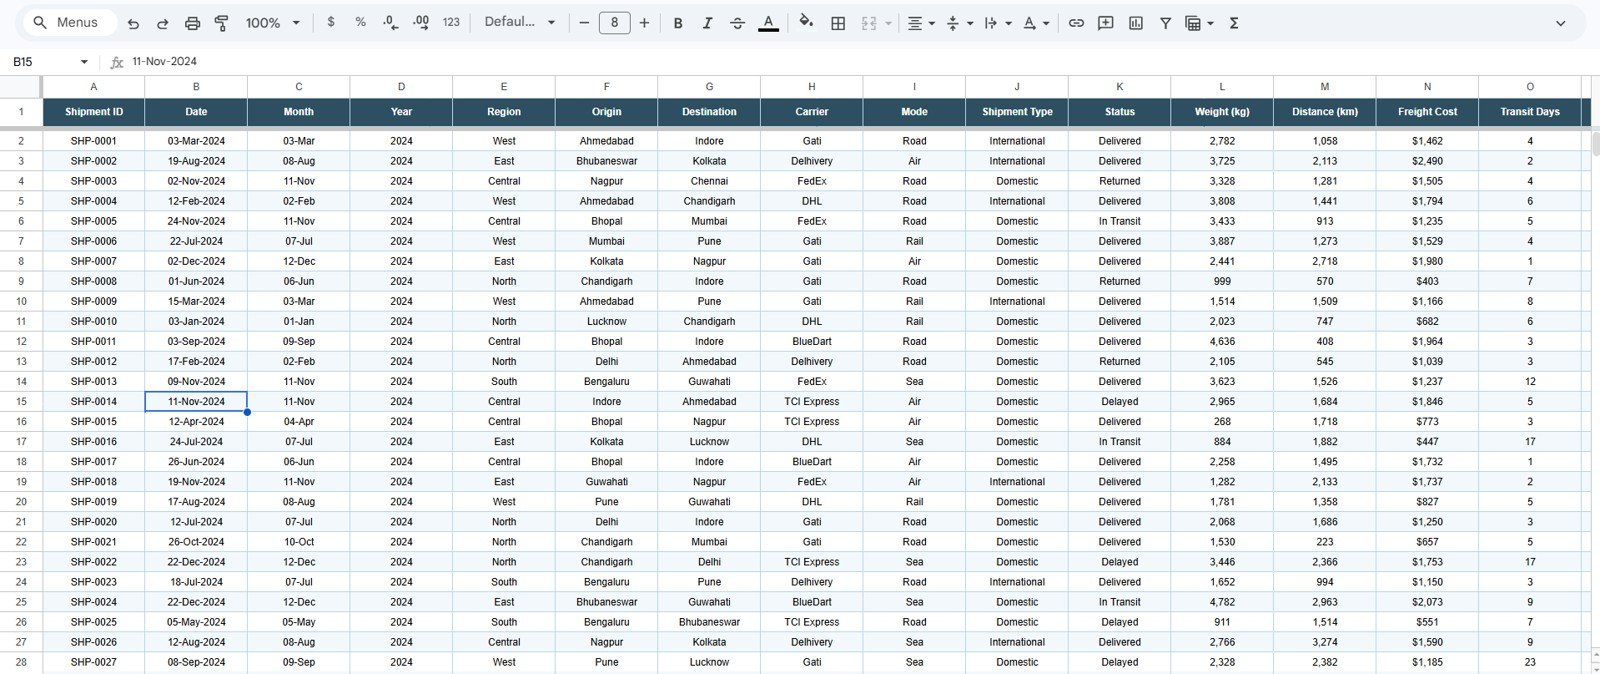
The Data Sheet is the input table for the dashboard. Add or paste your shipment records in the same format so KPI cards, charts, slicers, and the Shipment Lookup tab continue to work correctly.
Logistics Dashboard in Google Sheets vs. Microsoft Excel Dashboard vs. Paid TMS SaaS – Where This Fits
| Feature | This Google Sheets dashboard | Microsoft Excel dashboard | Paid TMS SaaS |
|---|---|---|---|
| Cost | $9.99 one-time sale price | Template cost plus possible Microsoft 365 license | Monthly or annual subscription |
| Platform | Google Sheets in browser | Excel desktop or web | Vendor-hosted logistics platform |
| Setup time | Copy sheet, paste shipment records, review charts | Open workbook, update data, refresh if needed | Implementation, user setup, and onboarding |
| Real-time team collaboration | Native Google Drive sharing | Best with OneDrive or SharePoint | Usually included by plan |
| Mobile access | Google Sheets app or browser | Excel mobile or browser | Vendor app or browser portal |
| Customizable fields | Edit source table, formulas, slicers, and charts | Edit workbook structure | Limited by vendor permissions |
| Share with link | Yes, through Google permissions | Yes, with Microsoft cloud storage | Often requires paid user seats |
| Year-1 cost at 5 users | $9.99 plus any Google Workspace cost | Template plus software licensing if needed | Often hundreds or thousands per year |
| Shipment lookup | Built-in Shipment ID Search Sheet | Possible with formulas | Usually included in shipment records |
| Carrier scorecard | Carrier cost, status mix, volume, and transit days | Depends on workbook design | Plan and data setup dependent |
Who This Template Is For – and Who It’s Not For
This template is for logistics managers, supply chain analysts, freight coordinators, warehouse teams, 3PL operators, transportation planners, and finance teams that need a quick reporting layer for shipment cost, volume, carrier performance, delivery status, and regional transit time.
It is not a live GPS tracker, carrier API connector, route optimizer, warehouse management system, or enterprise TMS. If you need automated carrier booking, driver mobile workflows, EDI, proof-of-delivery capture, or live tracking feeds, use this dashboard as an analysis layer after exporting approved shipment data.
How to Use the Logistics Dashboard in Google Sheets
- Open the PDF guide included with your purchase and use the Google Sheets copy link.
- Create your own editable copy in Google Drive.
- Go to the Data Sheet and replace the sample rows with your shipment records.
- Keep the same column structure for date, region, origin, destination, carrier, mode, shipment type, status, weight, distance, freight cost, and transit days.
- Use slicers on the dashboard pages to filter by available logistics fields.
- Open the Search Sheet, select a Shipment ID, and review the full matching record instantly.
Real-World Use Cases
Meera, logistics manager: reviews Total Freight Cost and On-Time Delivery every Monday, then opens Carrier Performance to see which carriers need follow-up.
Daniel, supply chain analyst: compares Freight Cost by Month with shipment volume so he can explain whether cost movement is caused by volume, mode mix, or carrier pricing.
Sana, warehouse operations lead: uses the Shipment ID lookup before customer calls to confirm region, origin, destination, carrier, mode, status, weight, and distance without scrolling through the Data Sheet.
Frequently Asked Questions
Is this Logistics Dashboard built in Google Sheets?
Yes. It is a Google Sheets dashboard template that you copy into your own Google Drive and edit from there.
What KPI cards are included?
The Overview page includes Total Shipments, Total Freight Cost, On-Time Delivery, and Avg Transit Days.
How many sheet tabs are included?
The template includes 7 tabs: Overview, Shipment Analysis, Freight Cost Analysis, Carrier Performance, Delivery Performance, Search Sheet, and Data Sheet.
Can I search for a specific shipment?
Yes. The Search Sheet tab lets you select a Shipment ID and view the matching shipment details instantly.
Can my team collaborate on the dashboard?
Yes. Because it runs in Google Sheets, you can share view or edit access through Google Drive permissions.
Does it connect live to carrier systems?
No. Add or paste shipment data into the Data Sheet in the same format. Live carrier API integration is not included.
About the Author
Built by PK – Microsoft Certified Professional with 15+ years of Excel, Google Sheets, and Power BI experience. Founder of NextGenTemplates, reaching 300K+ subscribers across YouTube channels. Every template is hand-built and tested before release.
Explore Related Templates
- EV Fleet Dashboard in Google Sheets
- Inventory Management Dashboard in Google Sheets
- Logistics Management System Web App
- Transportation and Logistics Dashboard in HTML
- Transportation and Logistics Dashboard in Excel
- Browse Google Sheets templates
- Browse Google Sheets dashboard templates
Download the Logistics Dashboard in Google Sheets to track shipment volume, freight cost, carrier performance, on-time delivery, transit days, regions, modes, and shipment lookup records from one editable workbook.
Watch the step-by-step video Demo:
Last updated: July 11, 2026.










Reviews
There are no reviews yet.