

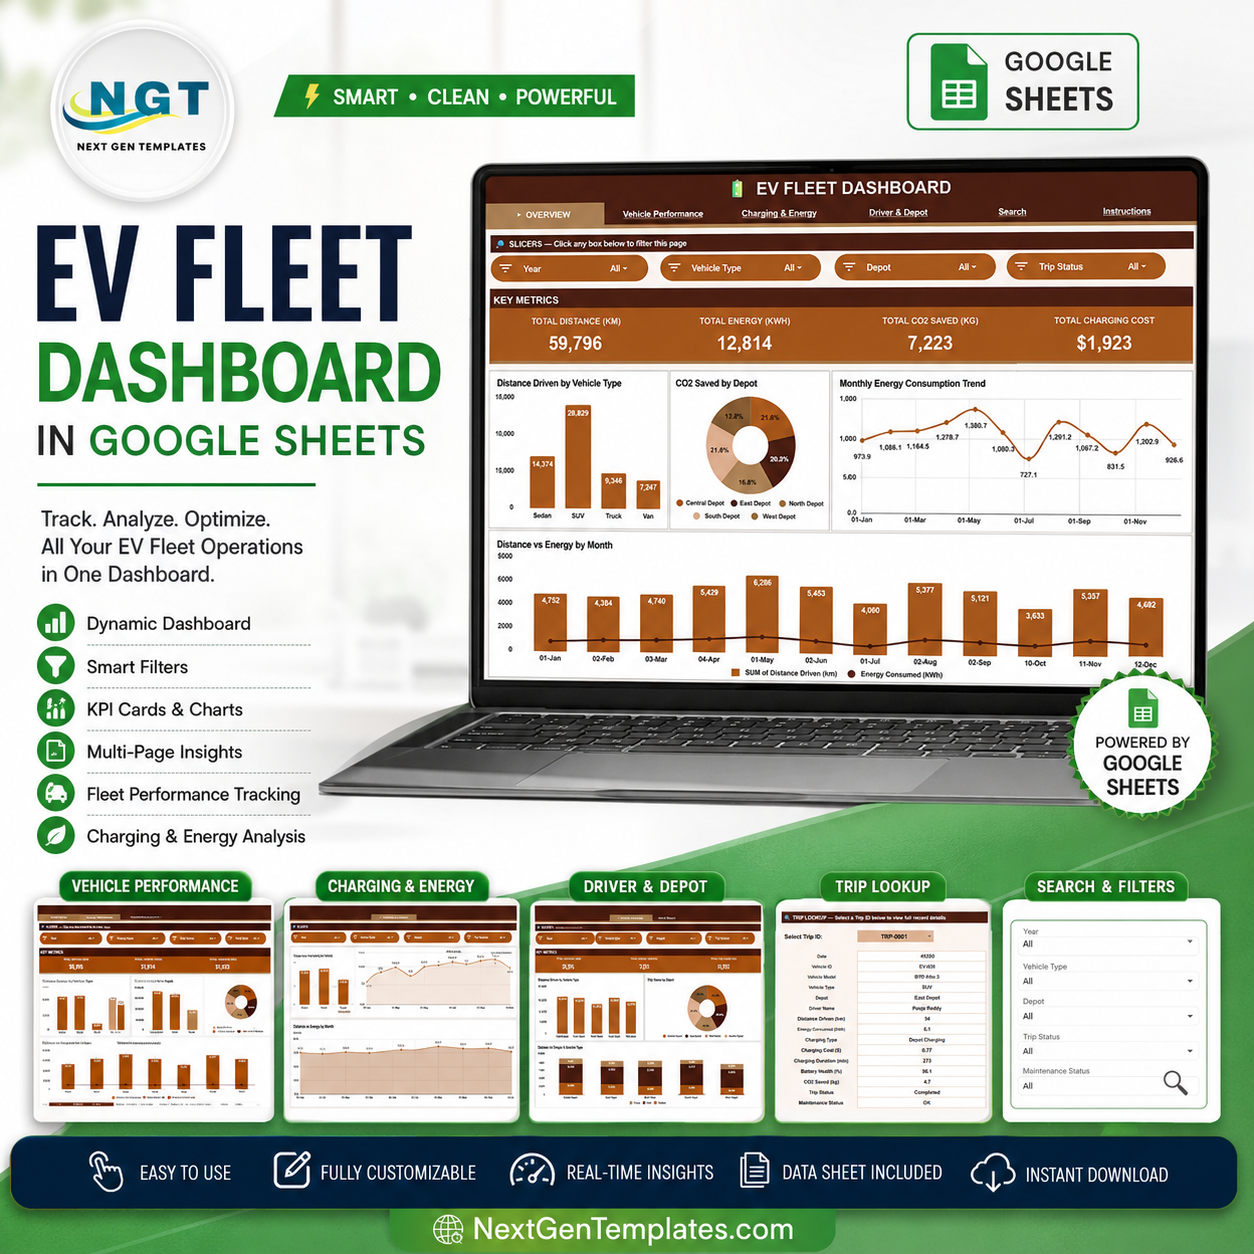

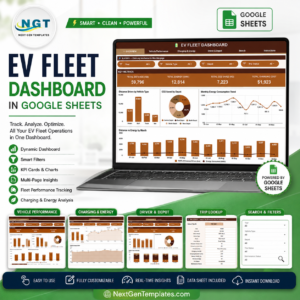
EV Fleet Dashboard in Google Sheets gives fleet managers 6 connected sheet tabs, 4 headline KPI cards, 16 chart views, a Trip ID search sheet, and a structured data sheet for recurring electric fleet reporting. Track total distance, total energy, CO2 saved, and charging cost from one browser-based dashboard. More than 8,400 teams in 40+ countries use NextGenTemplates to replace manual reporting with editable templates. Your purchase is backed by a 7-day file-match review if the delivered file does not match this page.
Key Features of EV Fleet Dashboard in Google Sheets
- 6 Google Sheets tabs for Overview, Vehicle Performance, Charging & Energy, Driver & Depot, Search Sheet, and Data Sheet.
- 4 executive cards for Total Distance (KM), Total Energy (KWH), Total CO2 Saved (KG), and Total Charging Cost.
- 16 analysis charts covering vehicle type, depot, month, model, battery health, trip status, charging type, driver, and maintenance views.
- Interactive slicers to filter the dashboard quickly by the available fleet fields.
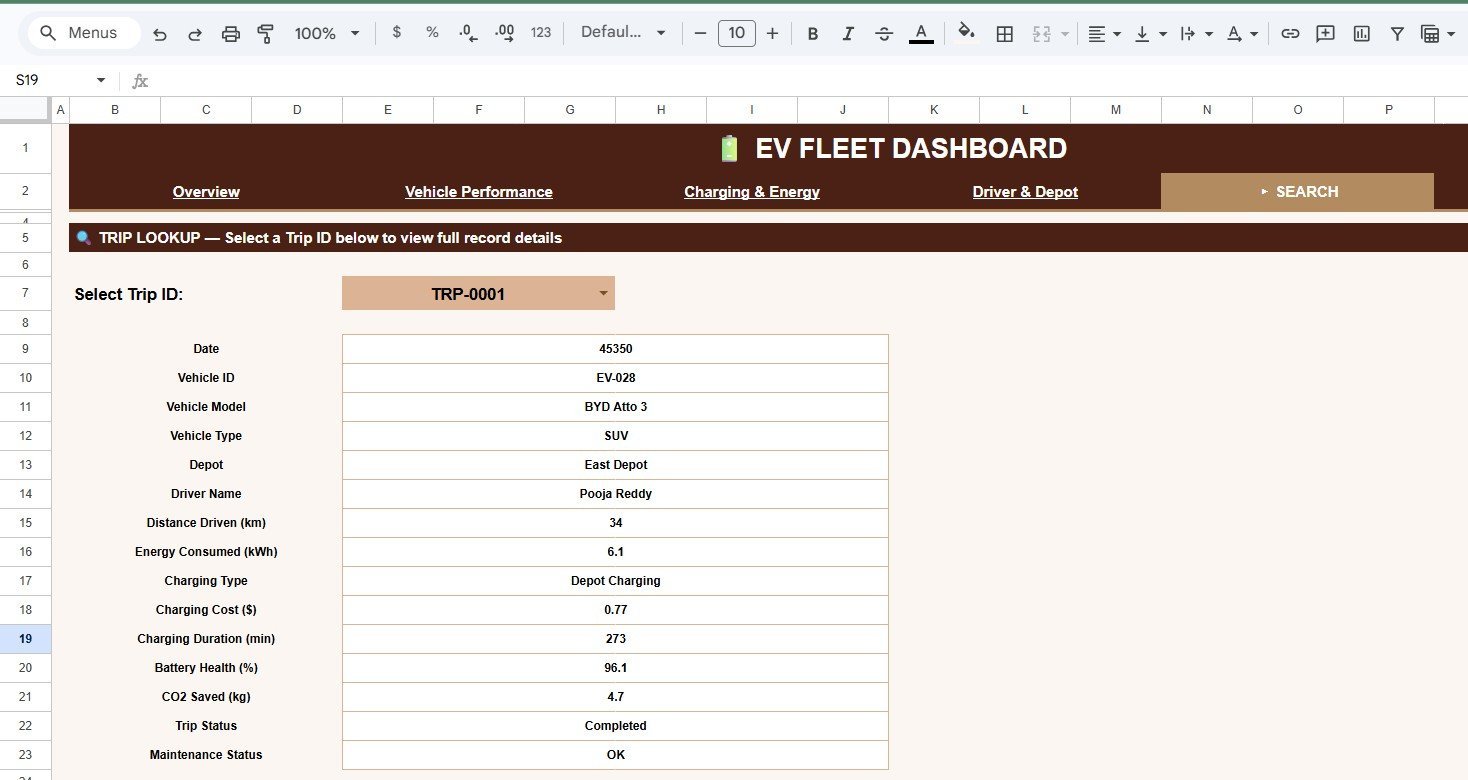
- Trip ID search sheet to view the full trip record without scrolling the data table.
- Editable data sheet so you can replace the sample rows while keeping the same column format.
- Google Sheets collaboration for teams that need shared access through Google Drive.
What’s Inside the EV Fleet Dashboard in Google Sheets
Overview Page
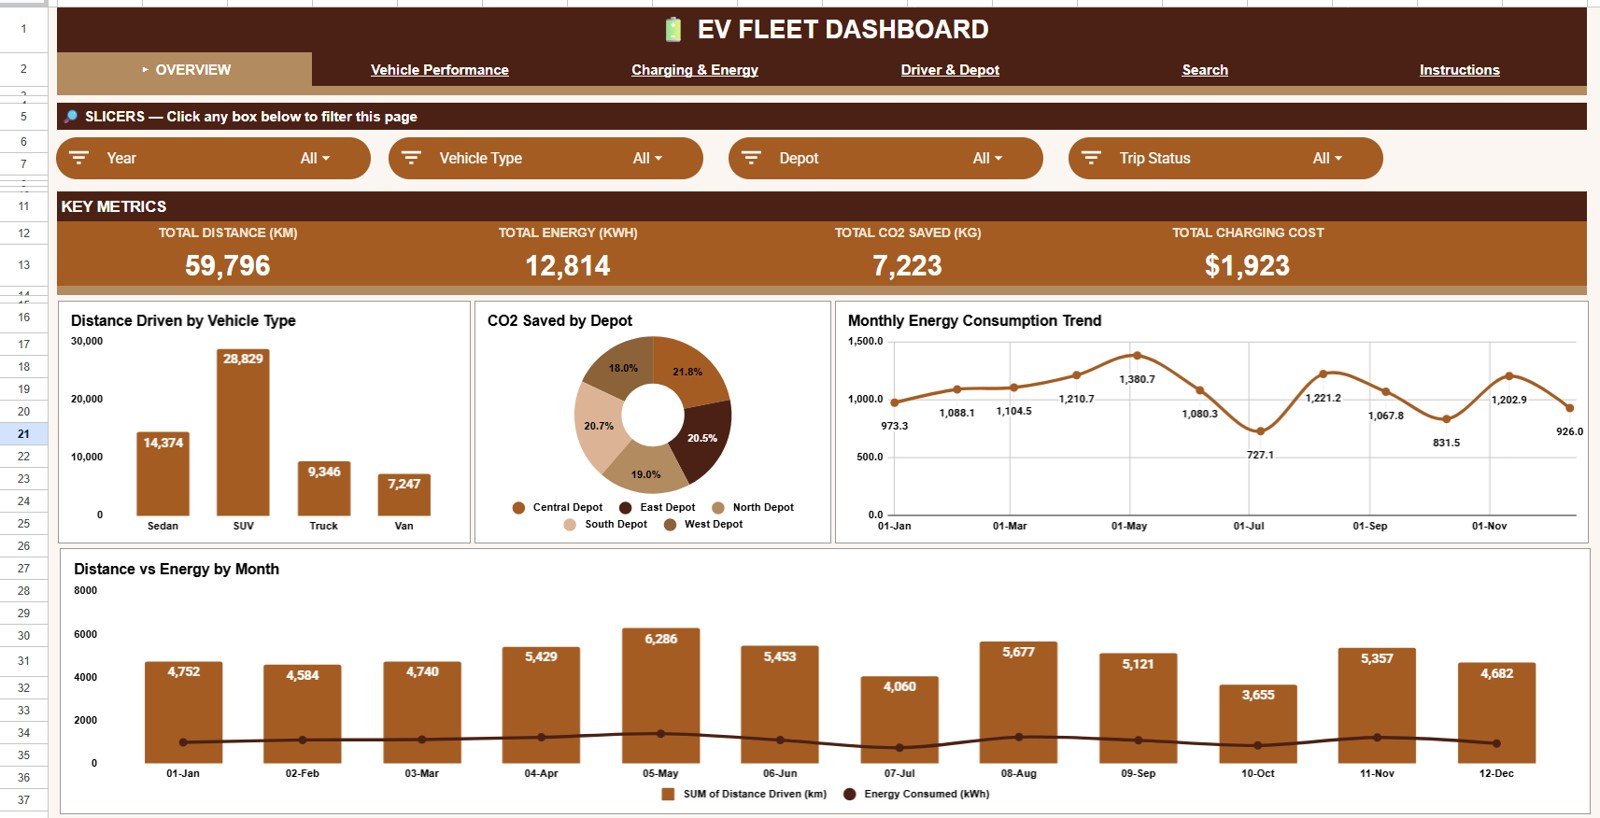
The Overview page gives leadership a quick read on fleet scale, energy use, sustainability impact, and charging spend. The top cards show Total Distance (KM), Total Energy (KWH), Total CO2 Saved (KG), and Total Charging Cost.
Distance Driven by Vehicle Type: This chart compares total distance across EV categories such as car, van, truck, bus, or other vehicle types. It helps managers see which vehicle classes carry the most operating load.
CO2 Saved by Depot: This chart compares avoided emissions by depot. It helps teams identify which depot locations are delivering the strongest environmental benefit.
Energy Consumption by Month: This monthly chart tracks total kWh usage over time. It helps spot seasonal demand, charging pressure, and energy planning needs.
Distance Driven and Energy Consumed by Month: This combo view compares output and energy use in the same time frame. It helps teams see whether rising kWh consumption is matched by useful distance.
EV Fleet Dashboard in Google Sheets
Vehicle Performance
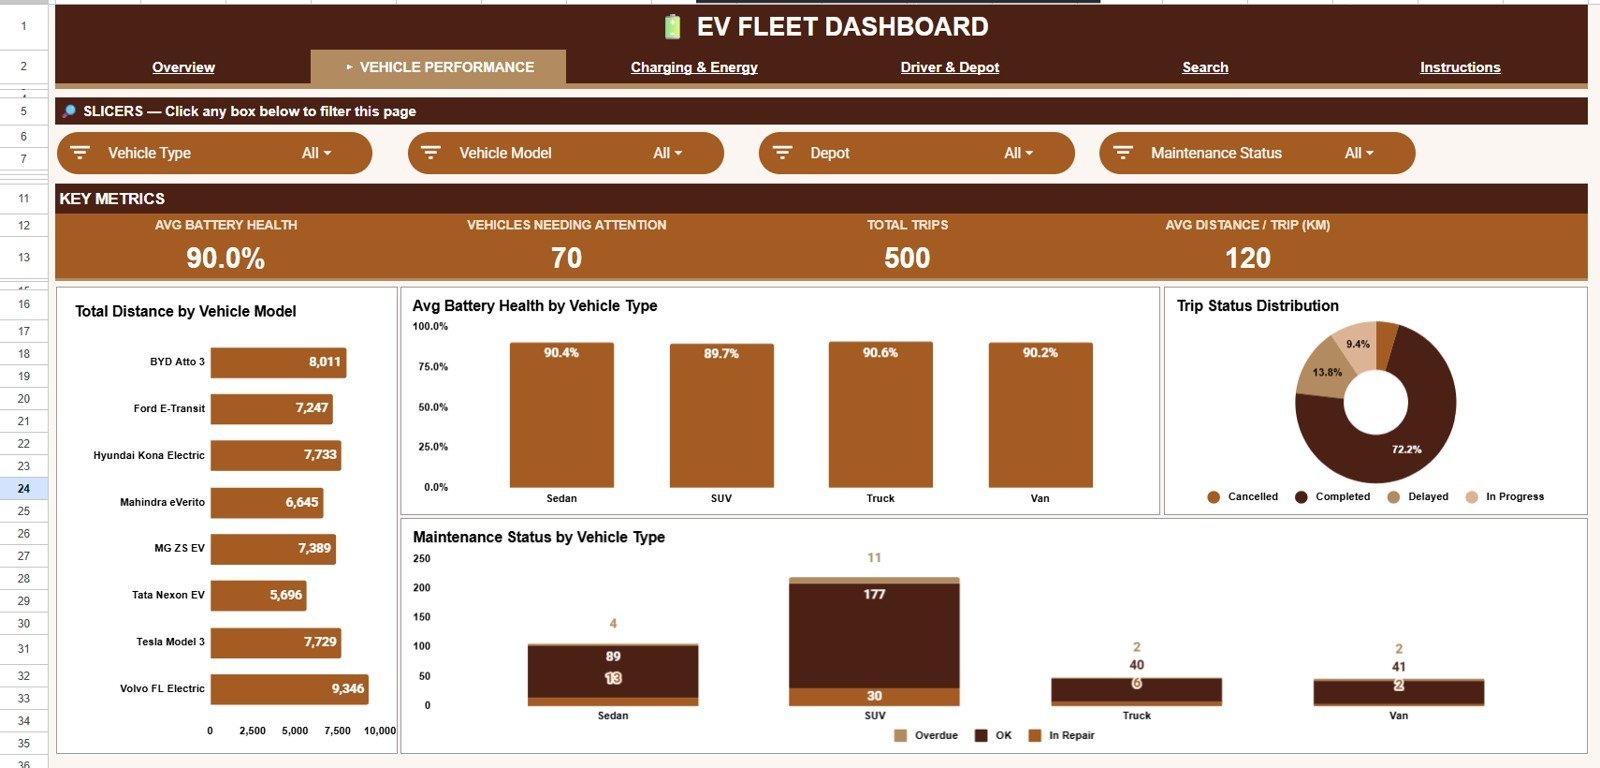
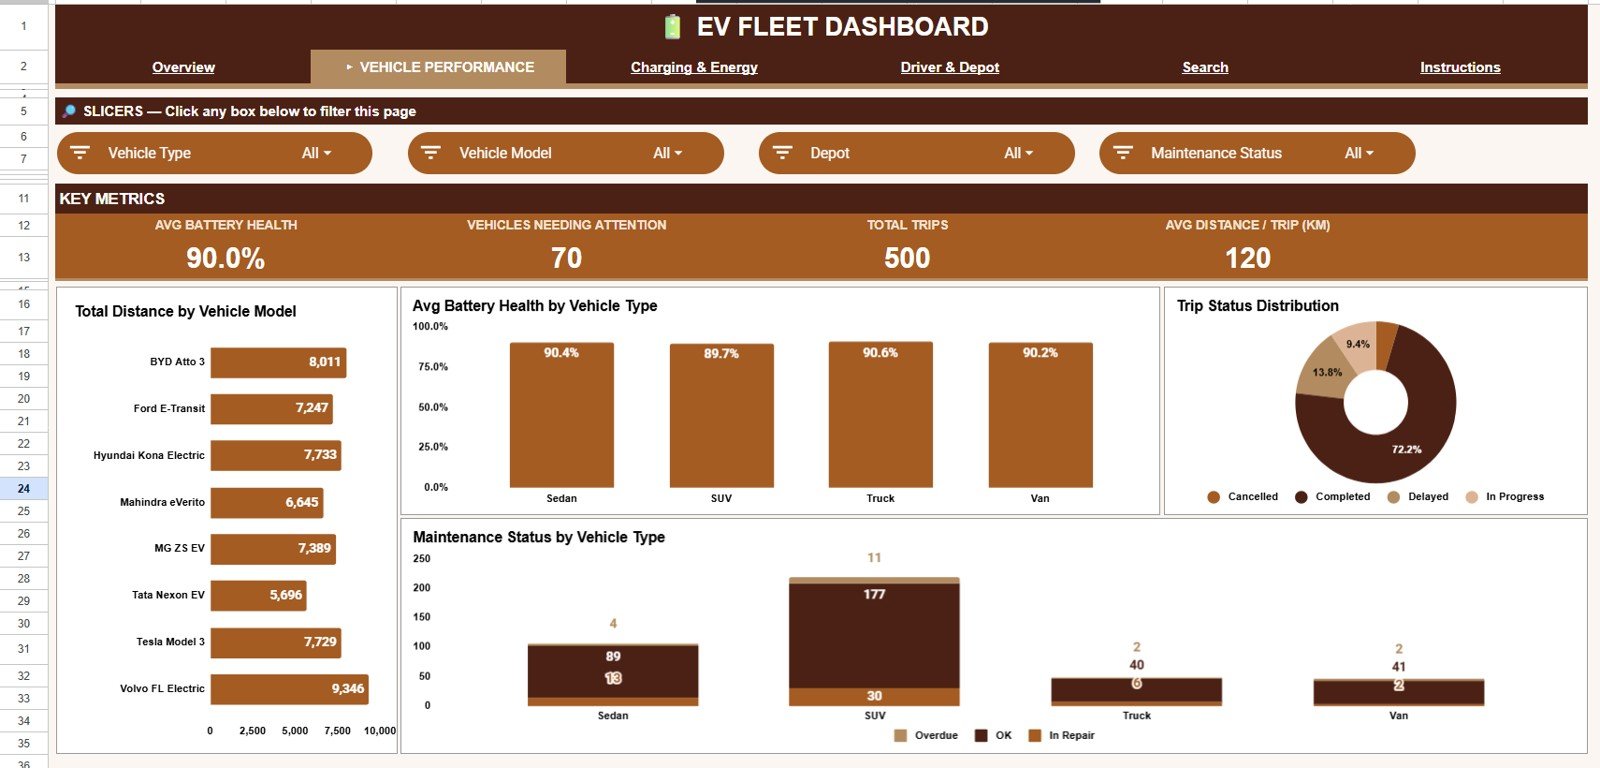
The Vehicle Performance tab is built for fleet supervisors who need to compare usage, reliability, battery health, and operating status by model and type.
Total Distance by Vehicle Model: This chart ranks vehicle models by total distance. It helps identify the models handling the most workload and supports rotation planning.
Avg Battery Health by Vehicle Type: This chart compares average battery health across vehicle categories. It helps teams find the vehicle types that may need battery review or charging habit changes.
Trip Count by Trip Status: This chart separates trips by status such as completed, pending, cancelled, or in progress. It helps operations teams check delivery flow and open-trip volume.
Maintenance Status by Vehicle Type: This chart shows maintenance state by vehicle type. It helps managers see which categories are available, due, or under maintenance.
Vehicle Performance
Charging & Energy
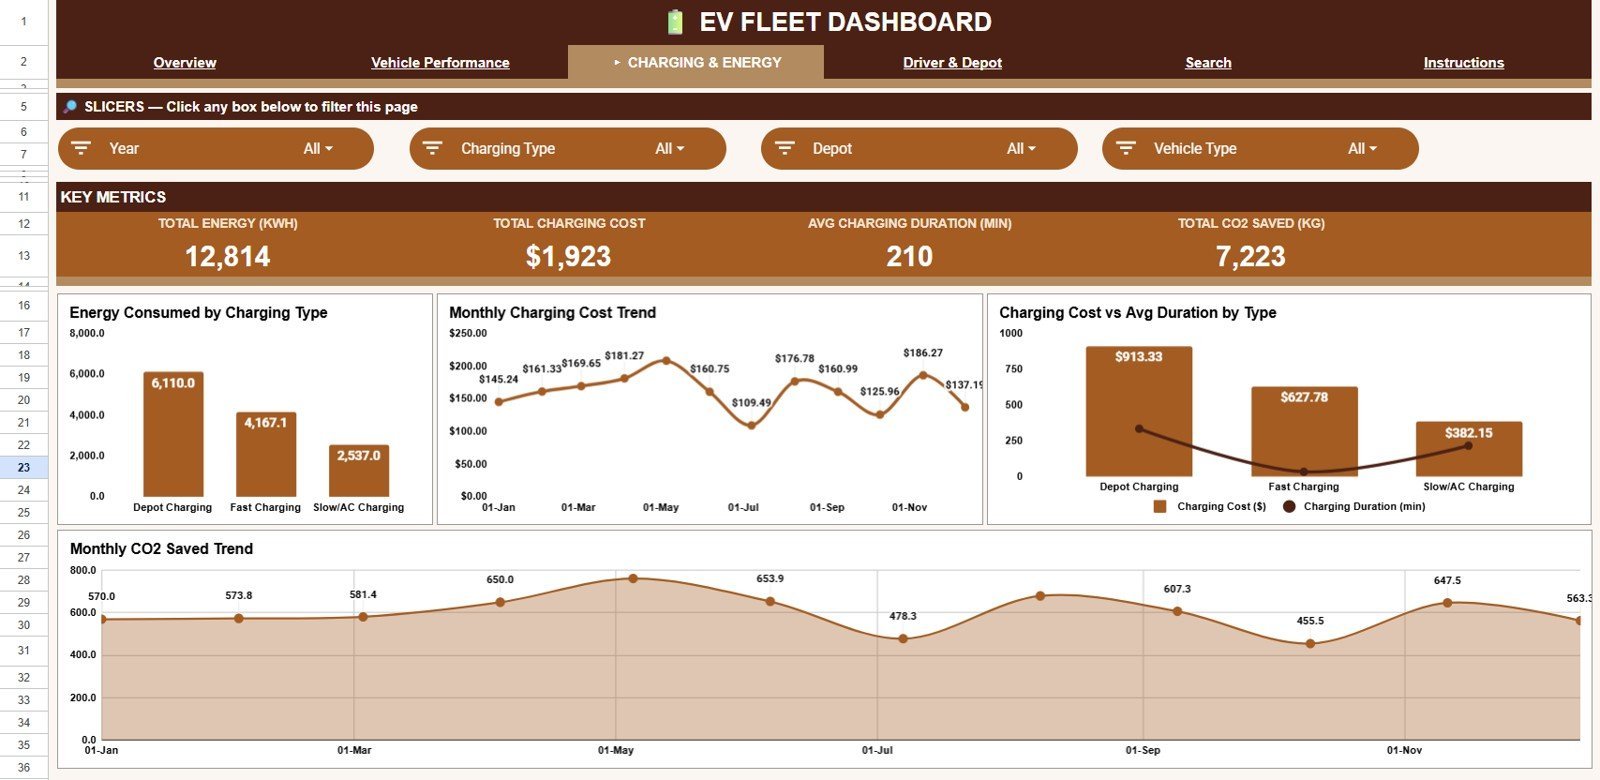
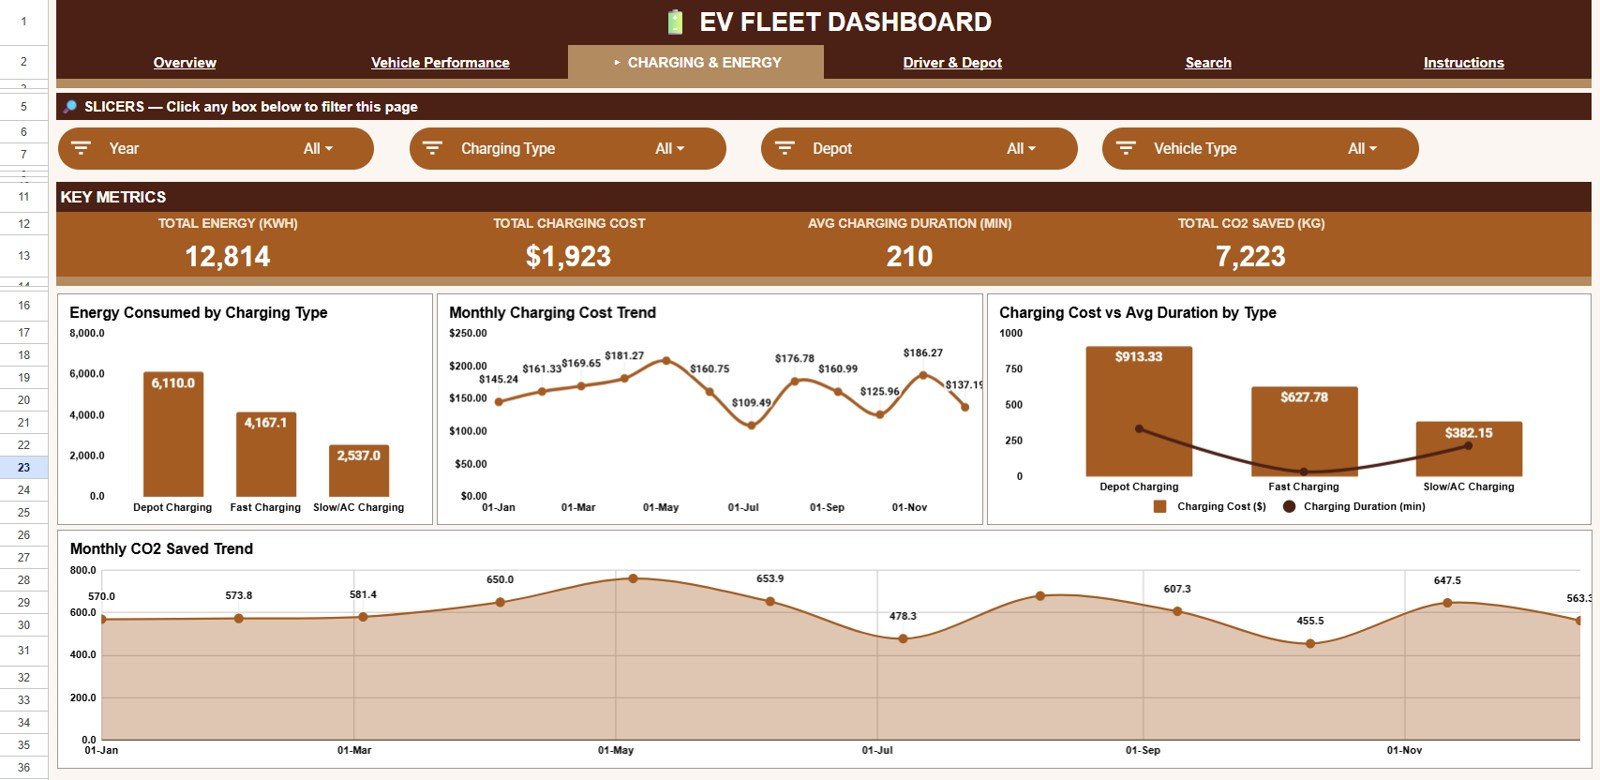
The Charging & Energy tab focuses on how the fleet consumes energy, which charging types drive cost, and how CO2 savings move across months.
Energy Consumed by Charging Type: This chart compares kWh consumption by charging method. It helps teams understand whether depot, fast, public, or other charging sources dominate energy use.
Charging Cost by Month: This chart tracks monthly charging cost. It helps finance and operations teams identify cost spikes and plan charging budgets.
Charging Cost and Charging Duration by Charging Type: This view compares cost and minutes by charging type. It helps reveal charging options that are expensive, slow, or operationally efficient.
CO2 Saved by Month: This chart shows the monthly sustainability impact from EV trips. It supports ESG reporting and internal progress reviews.
Charging & Energy
Driver & Depot
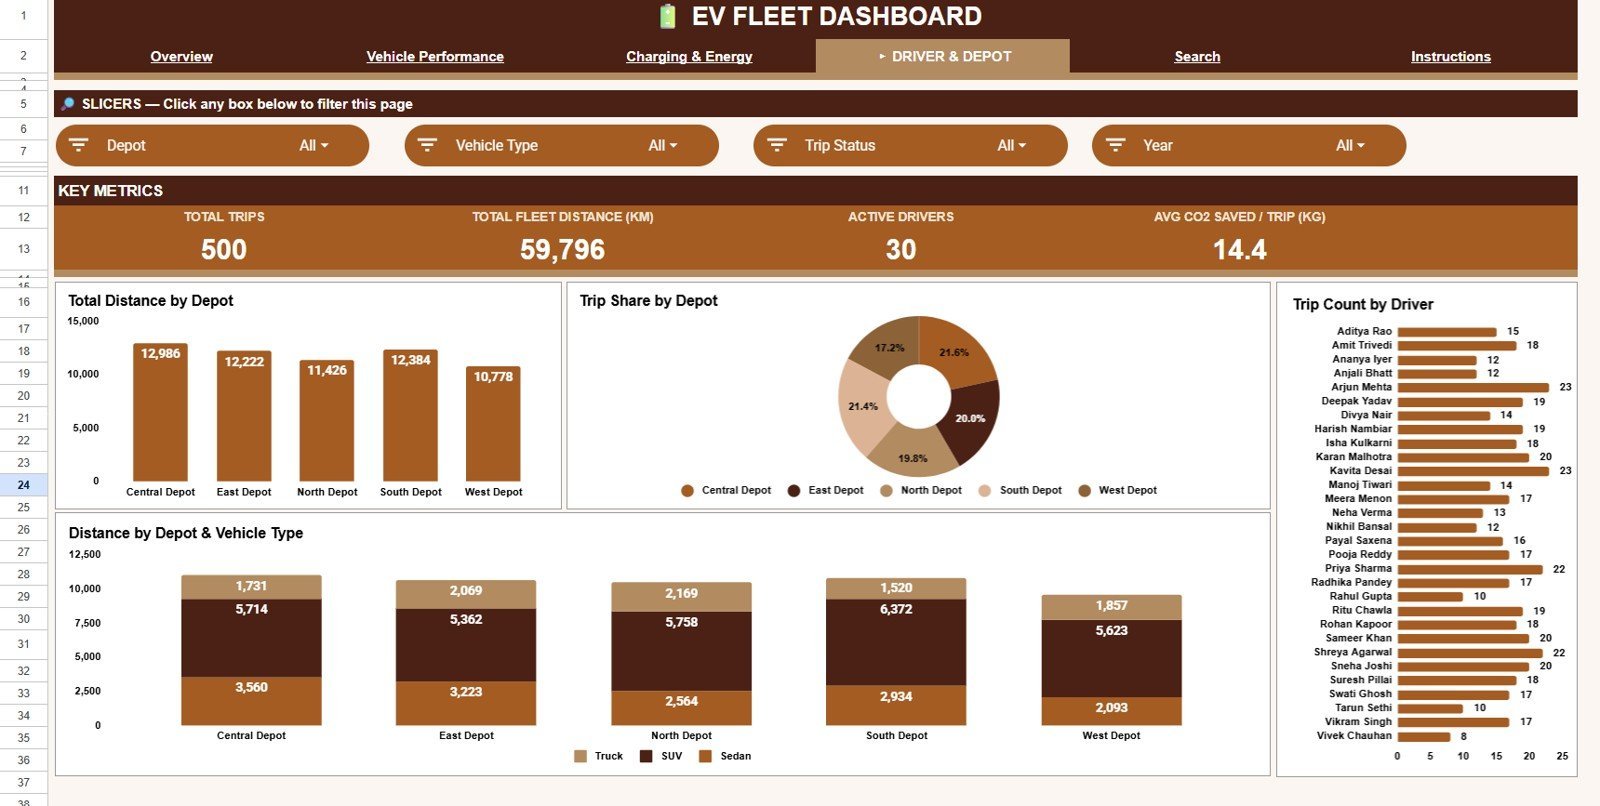
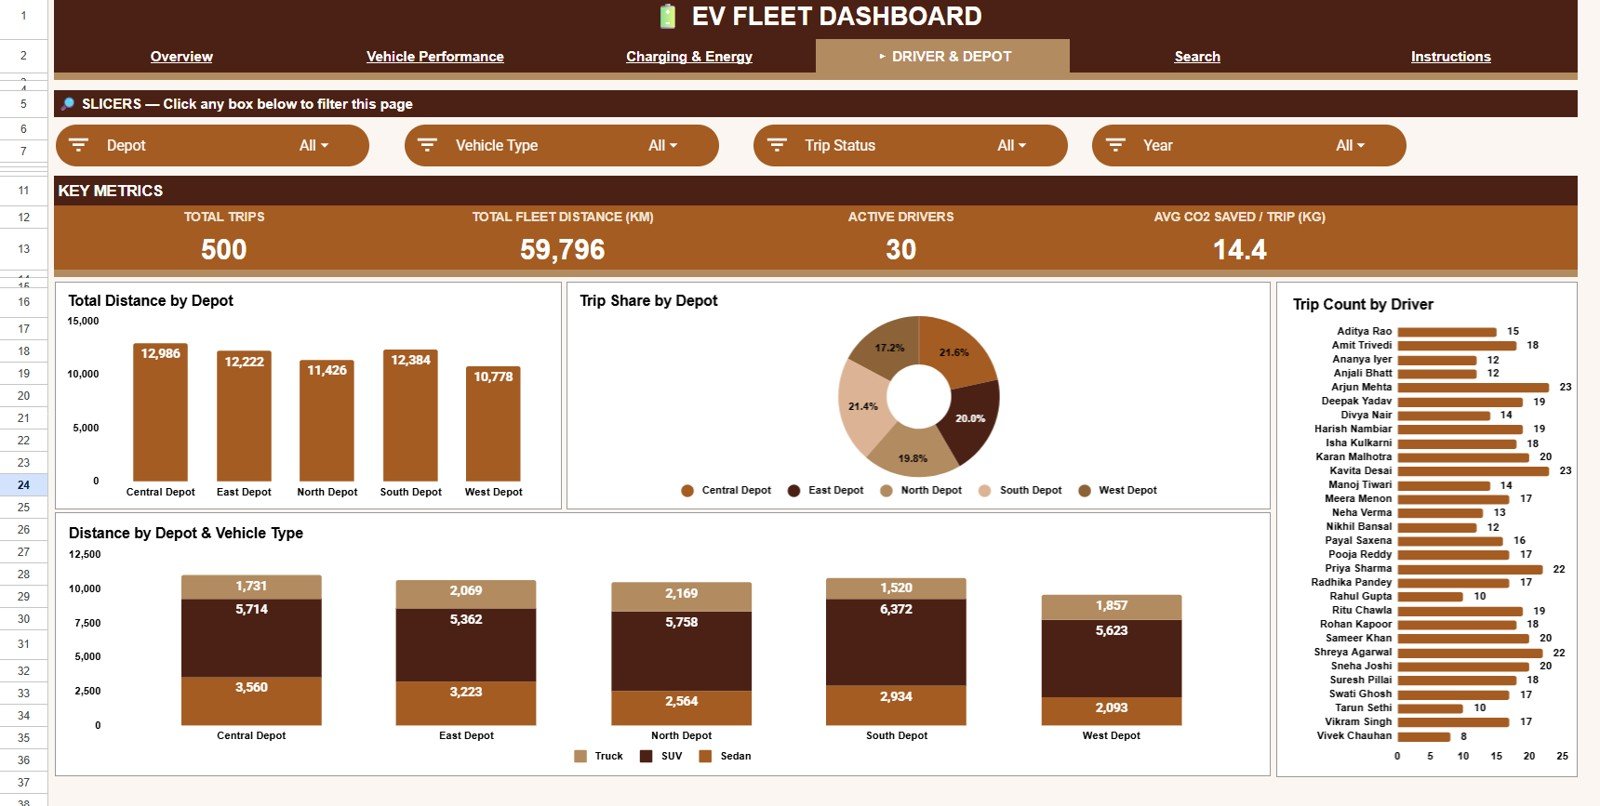
The Driver & Depot tab helps managers compare depot contribution, trip distribution, driver activity, and vehicle mix by location.
Total Distance by Depot: This chart compares distance handled by each depot. It helps identify high-volume locations and depots that may need charging capacity or vehicle support.
Trip Share by Depot: This chart shows how trips are distributed by depot. It helps teams understand workload split across operating locations.
Trip Count by Driver: This chart ranks drivers by number of trips. It helps supervisors review activity levels and balance assignments.
Distance by Depot and Vehicle Type: This chart connects depot workload with vehicle category. It helps managers decide where specific EV types are being used most.
Driver & Depot
Search Sheet Tab
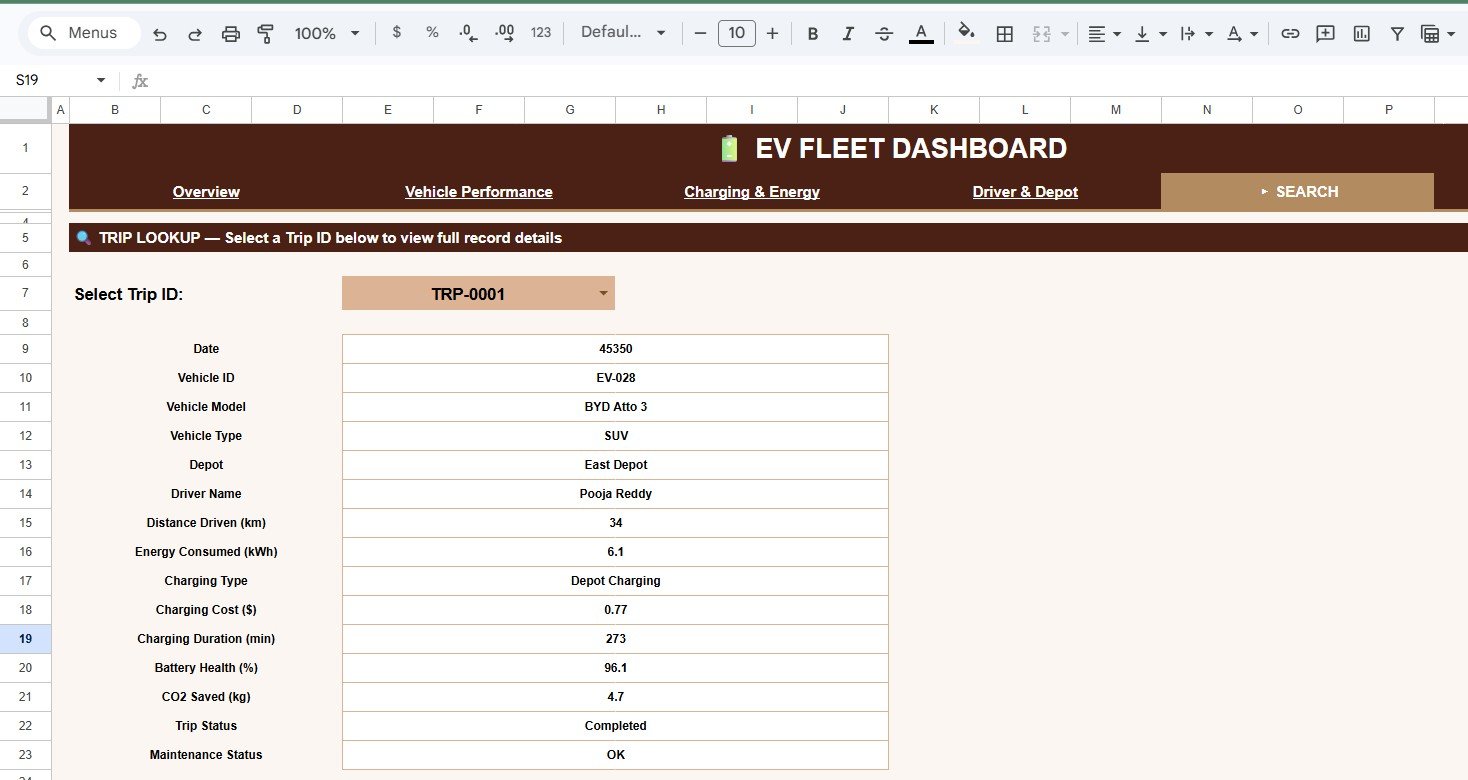
The Search Sheet tab lets users select a Trip ID and view the full matching record. The lookup area returns Date, Vehicle ID, Vehicle Model, Vehicle Type, Depot, Driver Name, Distance Driven (km), Energy Consumed (kWh), Charging Type, Charging Cost ($), Charging Duration (min), Battery Health (%), CO2 Saved (kg), Trip Status, and Maintenance Status.
Search Sheet tab
Data Sheet Tab
The Data Sheet tab is where users add EV fleet records in the same format as the sample data. Keep the column order intact so cards, charts, slicers, and the Trip ID lookup continue to update correctly.

Data Sheet tab
EV Fleet Dashboard in Google Sheets vs. Microsoft Excel Dashboard vs. Paid Fleet SaaS – Where This Fits
| Feature | This Google Sheets dashboard | Microsoft Excel dashboard | Paid fleet SaaS |
|---|---|---|---|
| Cost | $9.99 sale price, one-time | Template or workbook cost | Monthly or annual subscription |
| Platform | Google Sheets in browser | Excel desktop or web | Vendor-hosted system |
| Setup time | Copy sheet, add records, review charts | Open file, update data, refresh | Implementation and configuration |
| Real-time team collaboration | Built into Google Drive sharing | Best with Microsoft 365 | Usually included by plan |
| Mobile access | Google Sheets app or browser | Excel mobile with workbook limits | Vendor app or browser |
| Customizable fields | Editable sheets, charts, formulas, and fields | Editable workbook | Limited by vendor permissions |
| Share with link | Yes, using Google permissions | Possible through Microsoft cloud | Login controlled |
| Year-1 cost at 5 users | $9.99 plus any Google Workspace cost | Template cost plus Microsoft licensing if needed | Often hundreds or thousands |
| EV fleet pages | Overview, vehicle, charging, depot, search, and data | Depends on workbook design | Depends on module purchased |
Who This Template Is For – and Who It’s Not For
This template is for fleet managers, depot supervisors, EV operations teams, sustainability analysts, transport coordinators, charging-cost analysts, and consultants who need an editable Google Sheets reporting layer for EV trips, vehicles, charging, depot workload, and emissions savings.
It is not a telematics platform, route optimizer, charging-station control system, GPS tracker, driver app, or maintenance work-order system. Teams that need live GPS, automated charger integration, driver dispatch, or enterprise fleet controls should use this as an analysis layer after exporting approved trip data.
How to Use the EV Fleet Dashboard in Google Sheets
- Open the PDF guide included with your purchase and use the Google Sheets copy link.
- Create your own editable copy in Google Drive.
- Go to the Data Sheet and replace the sample records with your EV fleet trip data.
- Keep the same columns for trip, vehicle, depot, driver, distance, energy, charging, battery health, CO2 saved, status, and maintenance fields.
- Use slicers on the dashboard pages to filter the fleet view by the available dimensions.
- Use the Search Sheet to select a Trip ID and review the full trip record instantly.
Real-World Use Cases
Neha, depot operations manager: reviews Total Distance by Depot and Trip Share by Depot every Monday to balance vehicles and charging capacity across locations.
Marcus, sustainability analyst: uses CO2 Saved by Depot and CO2 Saved by Month to prepare internal ESG updates without rebuilding reports from raw trip logs.
Elena, fleet finance lead: checks Charging Cost by Month and Charging Cost by Charging Type before budget reviews so she can explain cost movement clearly.
Frequently Asked Questions
What does the EV Fleet Dashboard in Google Sheets track?
It tracks distance, energy consumption, CO2 saved, charging cost, charging duration, battery health, trip status, maintenance status, vehicle model, vehicle type, depot, driver, and Trip ID details.
How many tabs are included?
The template includes 6 tabs: Overview, Vehicle Performance, Charging & Energy, Driver & Depot, Search Sheet, and Data Sheet.
Can I customize the dashboard?
Yes. You can edit sheet names, labels, formulas, slicers, charts, colors, and source fields directly in Google Sheets.
Does it connect live to chargers or telematics systems?
No live connector is included. Add exported or approved data to the Data Sheet in the same column format.
Can multiple users work on the file?
Yes. Because it runs in Google Sheets, you can share the dashboard using Google Drive permissions.
Is this a subscription?
No. It is a one-time template purchase from NextGenTemplates. Google Workspace costs, if any, are separate.
About the Author
Built by PK – Microsoft Certified Professional with 15+ years of Excel, Google Sheets, and Power BI experience. Founder of NextGenTemplates, reaching 300K+ subscribers across YouTube channels. Every template is hand-built and tested before release.
Explore Related Templates
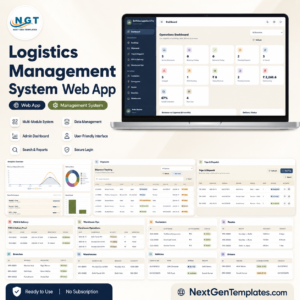
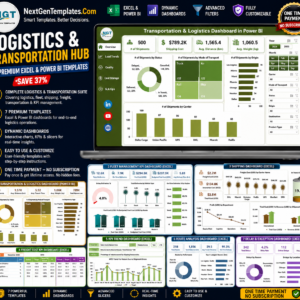
Browse more Google Sheets templates and Google Sheets dashboard templates. Related options include EV Charging Stations Dashboard in Excel, EV Charging Stations Dashboard in Power BI, Logistics Management System Web App, Last-mile Delivery Dashboard in Excel, and Logistics and Transportation Hub.
Watch the step-by-step video Demo:
Download the EV Fleet Dashboard in Google Sheets to review distance, energy, CO2 saved, charging cost, vehicle performance, driver activity, depot workload, trip status, and maintenance status in one editable dashboard.
Last updated: July 6, 2026.
























Reviews
There are no reviews yet.