

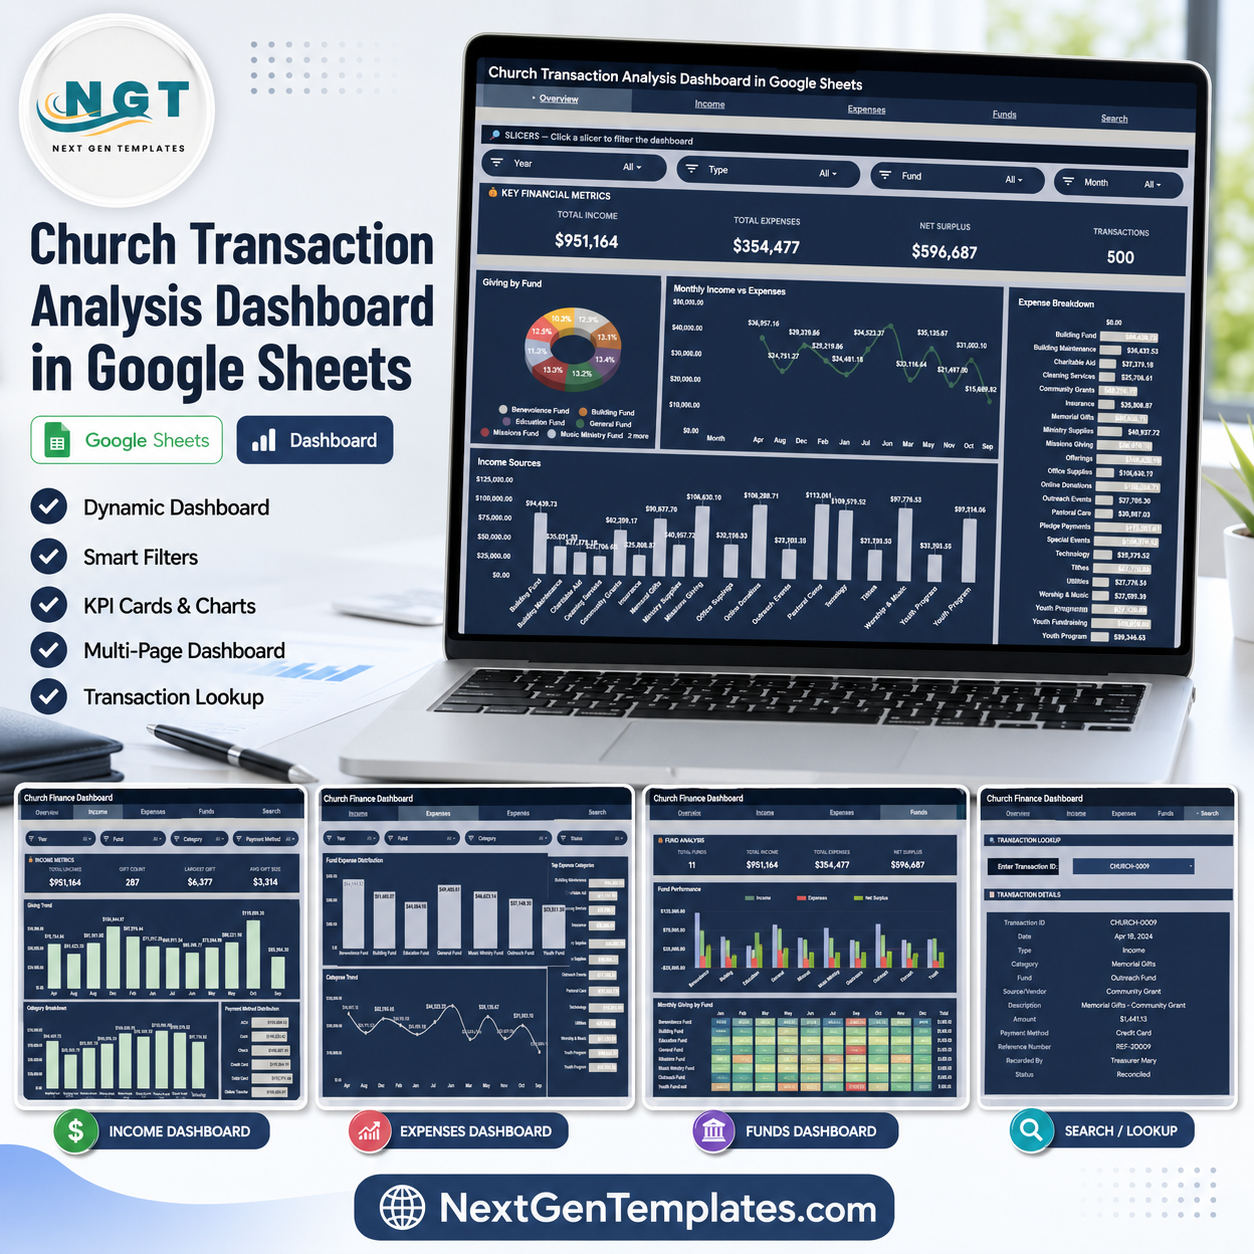

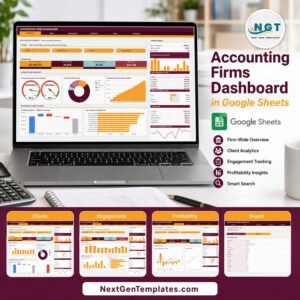
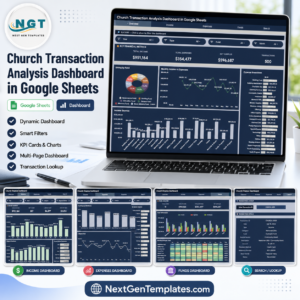
The Church Transaction Analysis Dashboard in Google Sheets tracks 4 headline finance cards, 10+ chart views, multiple slicers, a transaction lookup page, a user guide, and a structured data sheet for church income and expense reporting. Built for treasurers, pastors, finance committees, and faith-based nonprofit teams, it helps review Total Income, Total Expenses, Net Surplus, and Transactions without rebuilding formulas from scratch. Join 10,000+ customers in 180+ countries using NextGenTemplates to replace monthly reporting software with one-time spreadsheet templates. You pay once, keep lifetime access, and avoid per-user subscription fees.
Key Features of Church Transaction Analysis Dashboard in Google Sheets
- Google Sheets dashboard format that opens in the browser and can be shared with finance team members through Google Drive.
- 4 executive overview cards for Total Income, Total Expenses, Net Surplus, and Transactions.
- Multiple slicers to filter the dashboard quickly by fields such as transaction type, category, fund, payment method, status, and time period.
- Income and expense analysis pages that separate giving patterns from spending patterns for clearer monthly review.
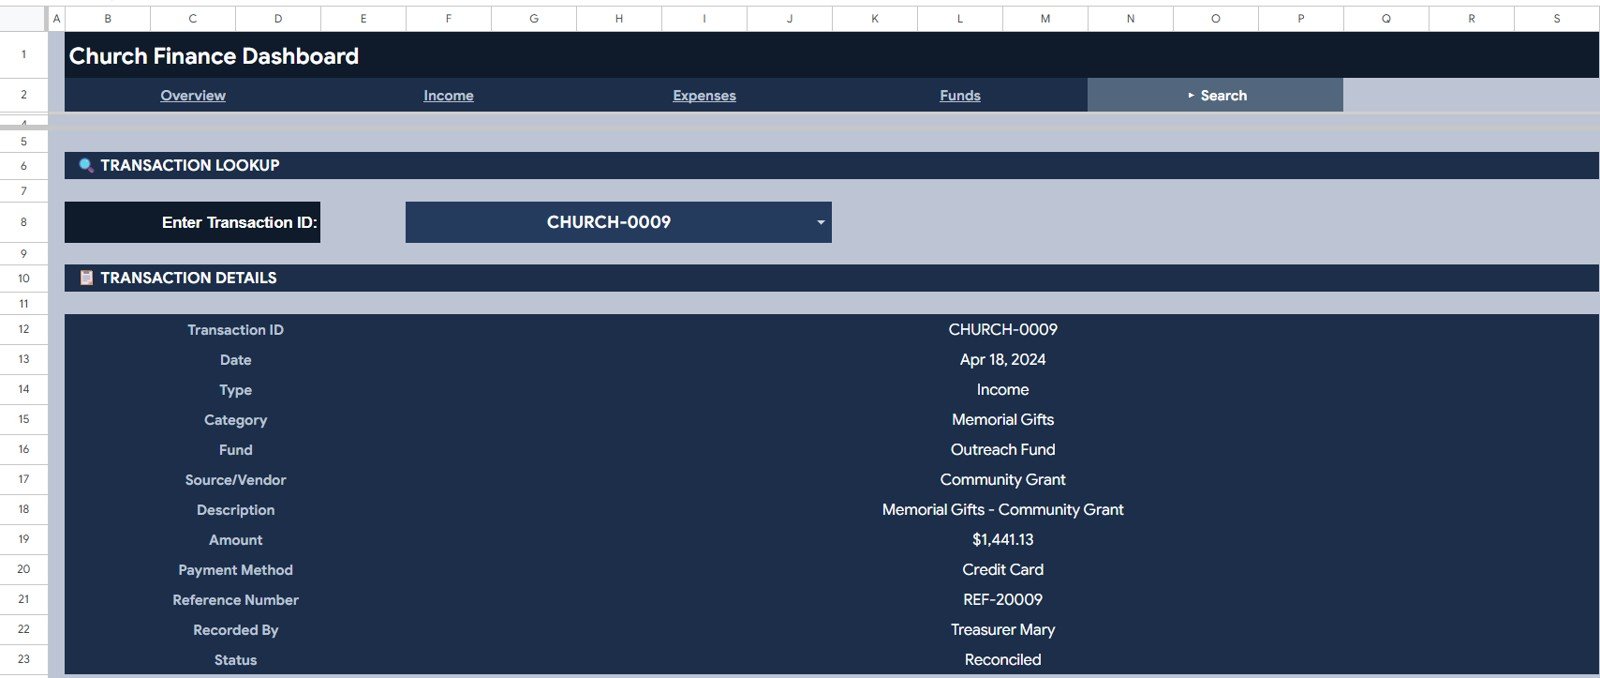
- Search tab that lets users select a Transaction ID and view the full transaction details instantly.
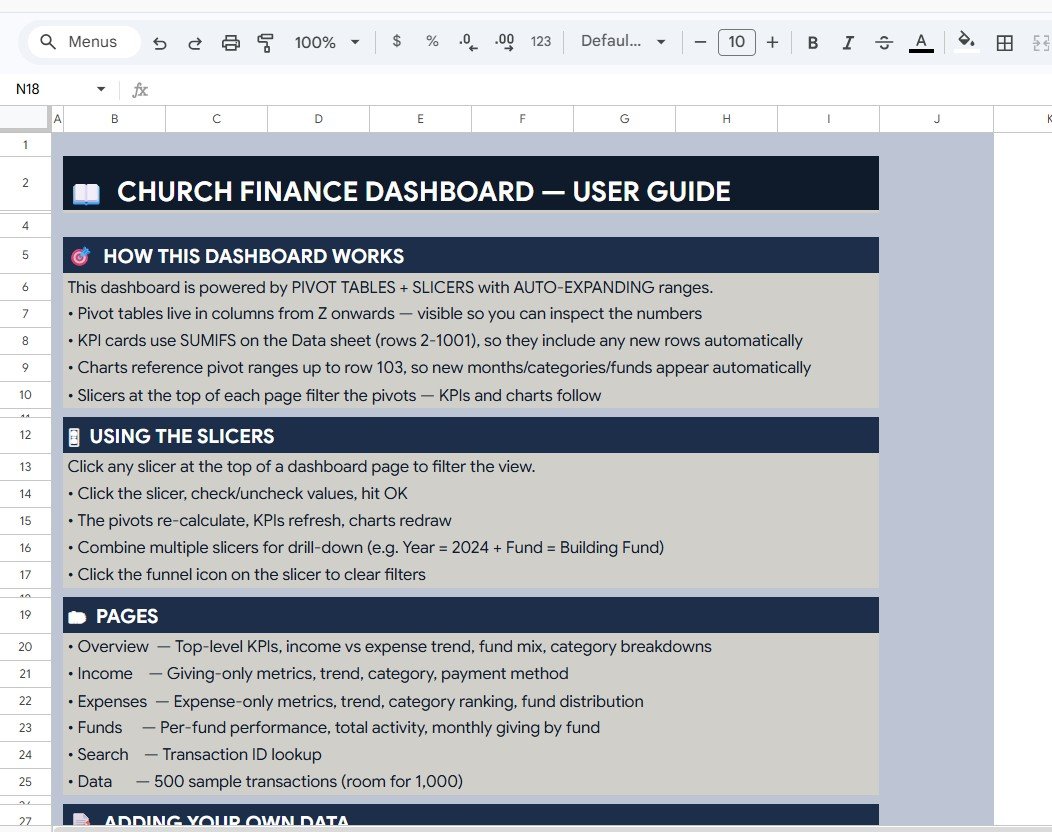
- User Guide page explaining the dashboard pages, slicers, filters, and data-entry flow.
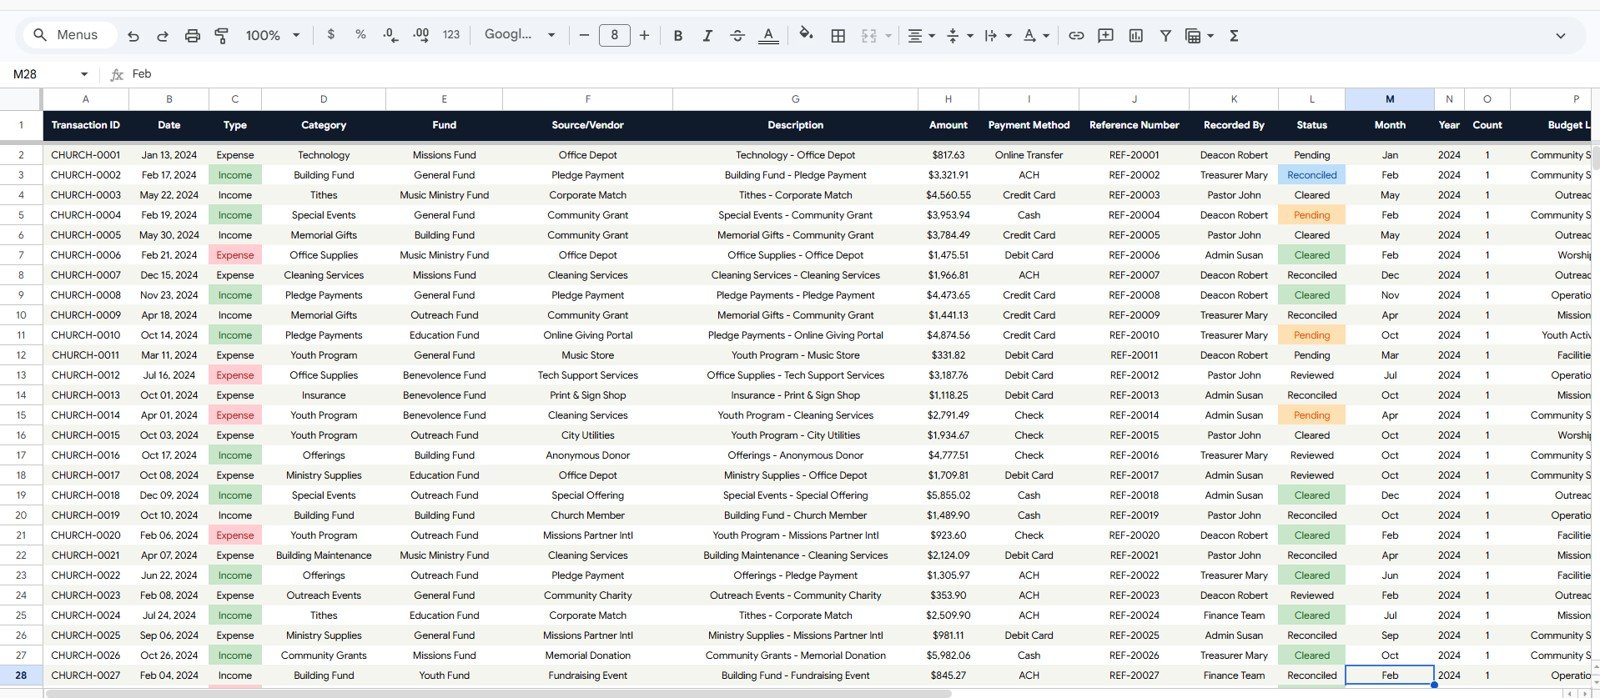
- Editable Data Sheet where users replace the sample church transaction records while keeping the same column structure.
What’s Inside the Church Transaction Analysis Dashboard in Google Sheets
1. Overview Page
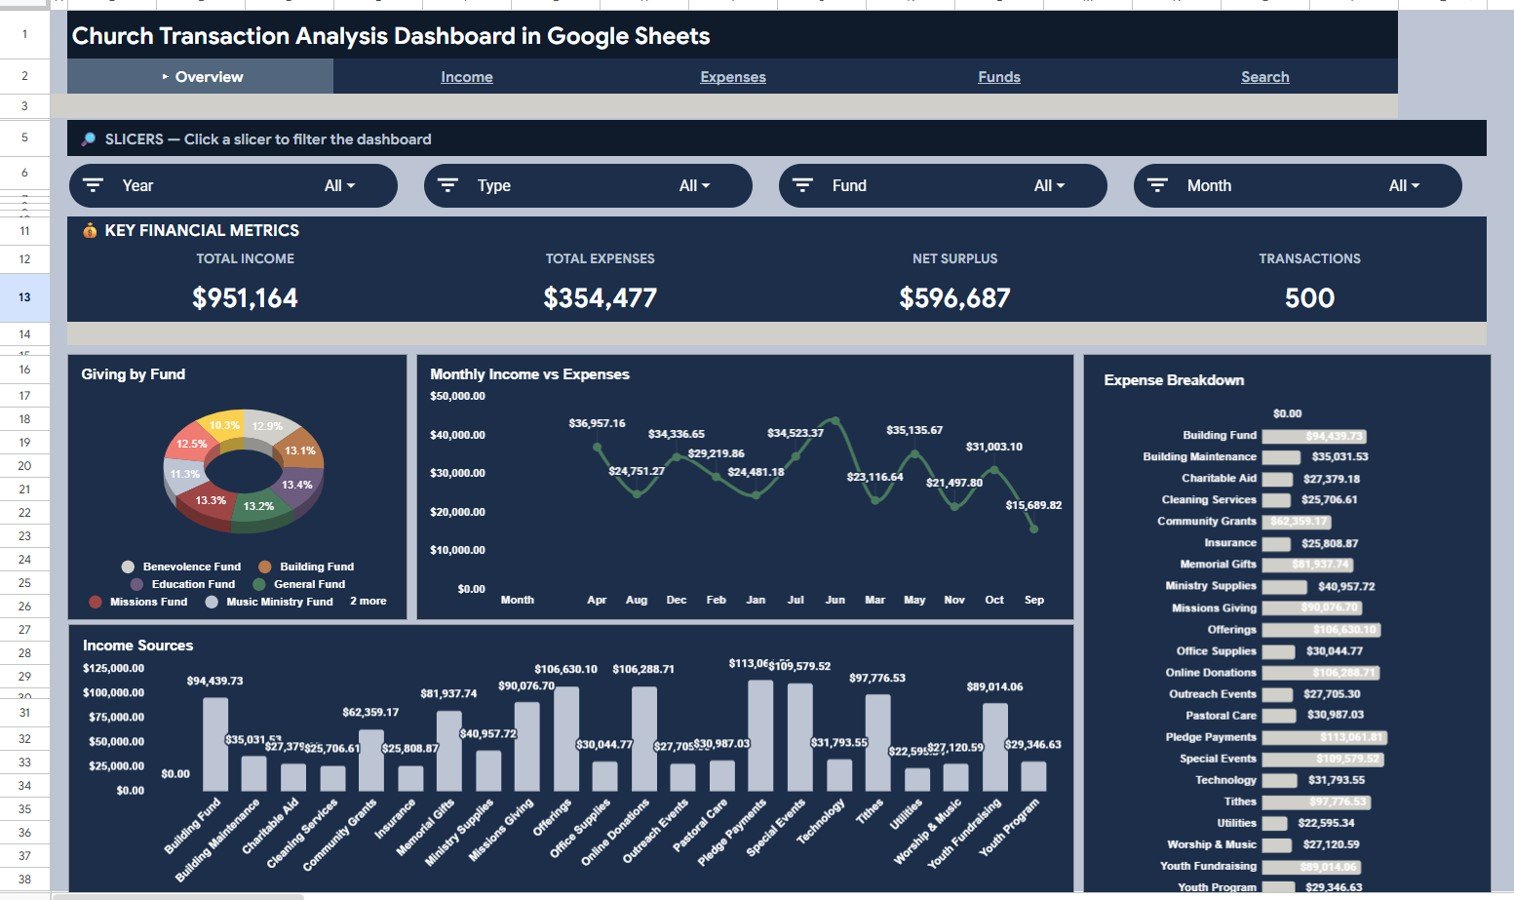
The Overview page gives leaders a fast financial snapshot with Total Income, Total Expenses, Net Surplus, and Transactions displayed as high-level cards. Slicers let users filter the page and immediately see the impact on every card and chart.
Giving by Fund: This chart shows how giving is distributed across church funds such as general, missions, building, youth, or special funds. It helps finance committees understand which funds are receiving the most support.
Monthly Income vs Expenses by Month: This chart compares income and expenses month by month. It helps identify months with surplus, shortfall, seasonal giving changes, and spending spikes.
Income Sources by Category: This chart breaks income into categories so users can compare tithes, offerings, events, grants, and other sources. It is useful for seeing which income streams are supporting church operations.
Expense Breakdown by Category: This chart shows where money is being spent across categories such as utilities, ministry programs, salaries, outreach, maintenance, and administration. It supports clearer budget conversations.
2. Income Page
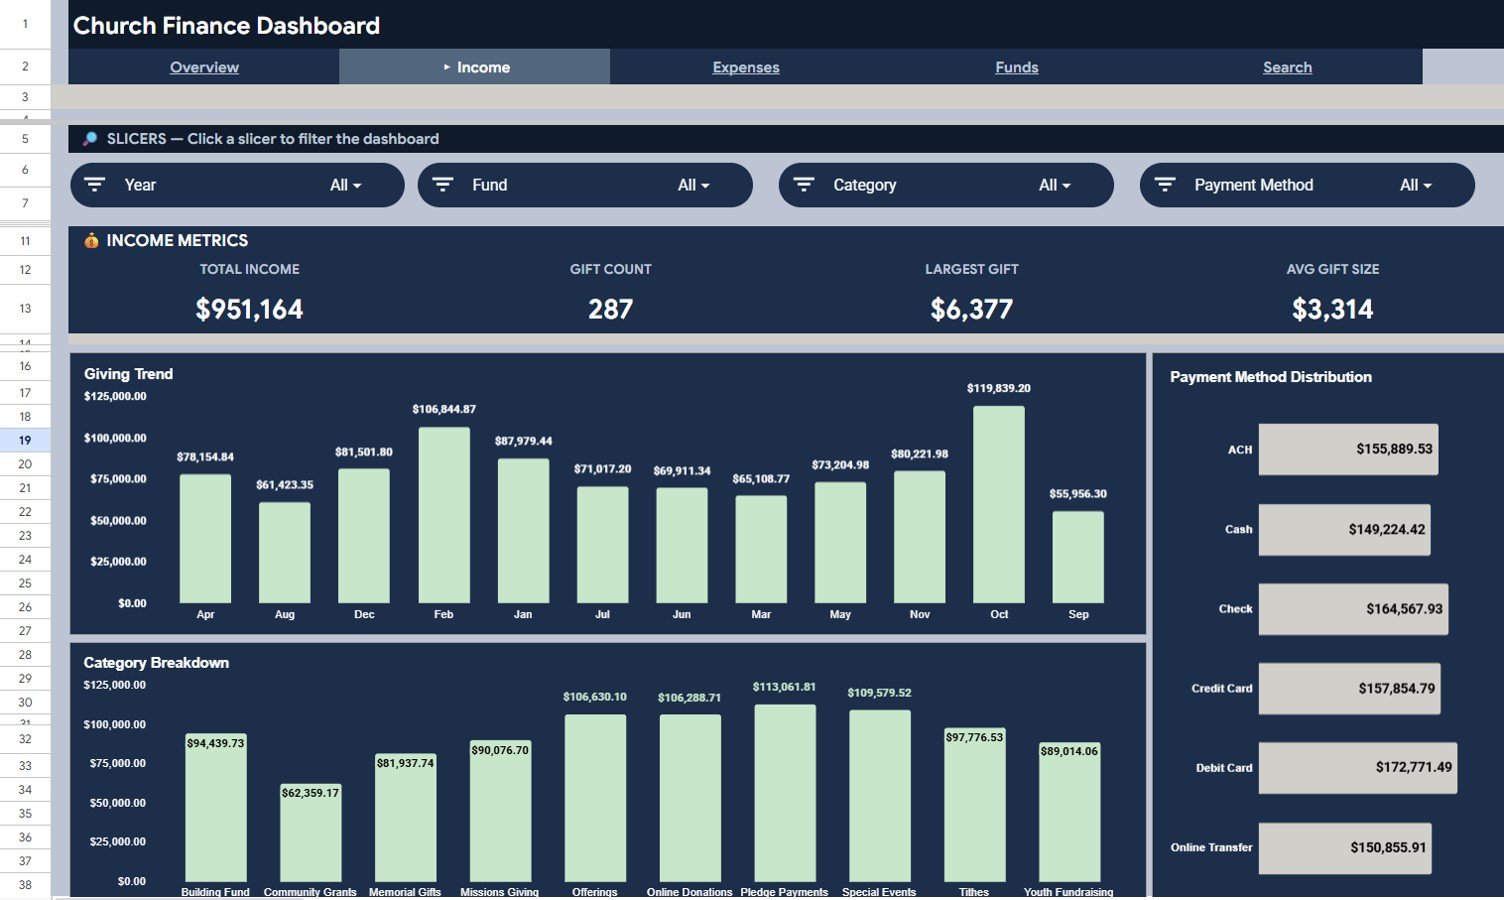
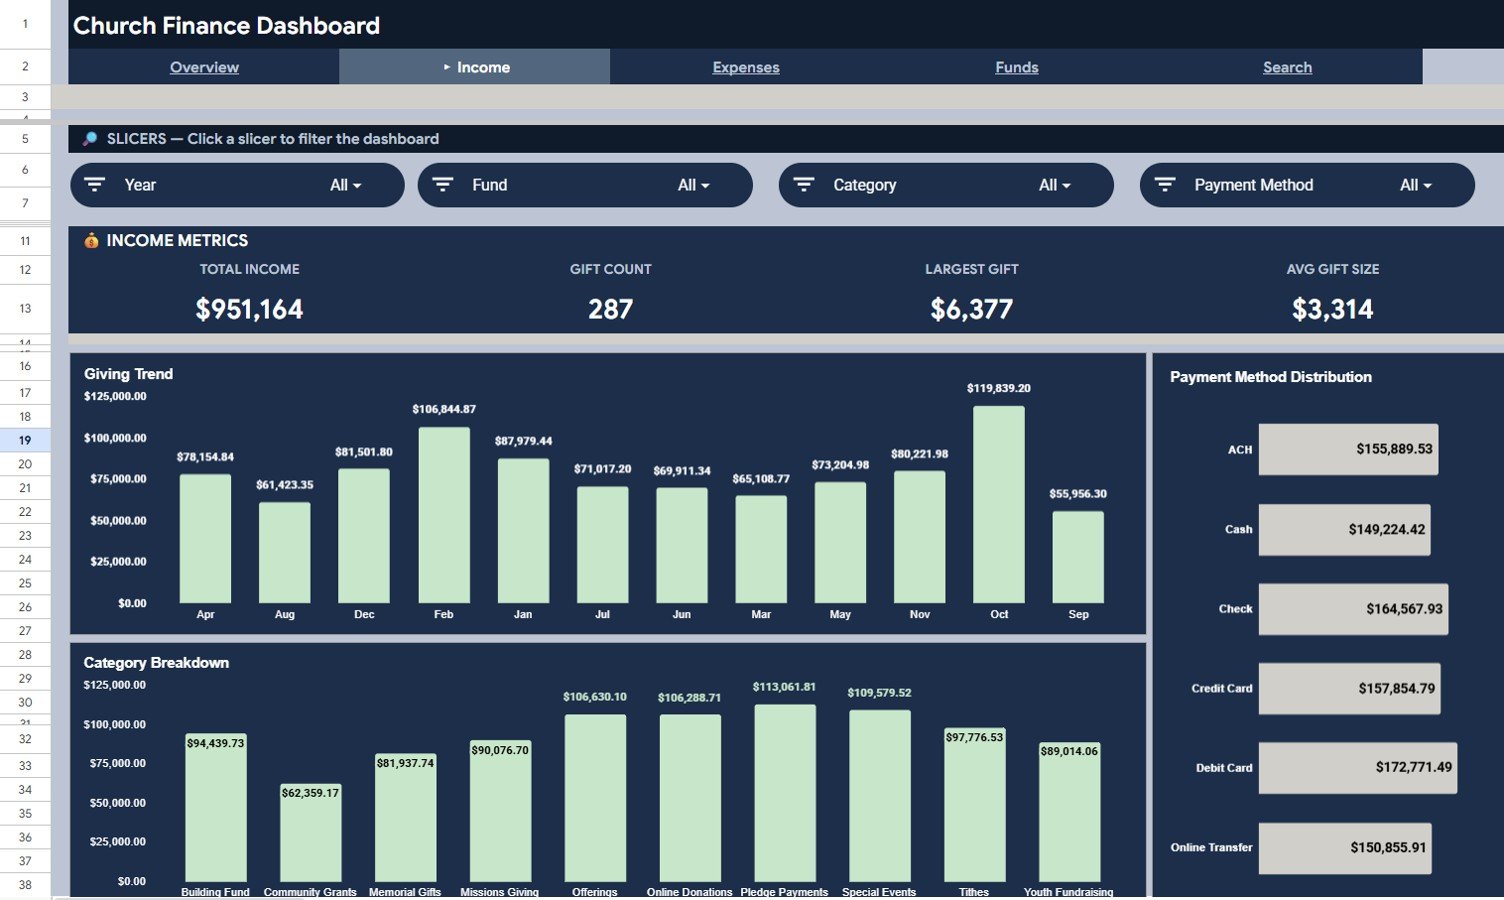
The Income page focuses on giving activity and donor-side transaction analysis. It includes Total Income, Gift Count, Largest Gift, Avg Gift Size, Giving Trend by Month, Payment Method Distribution by Payment Method, and Category Breakdown by Category.
Use this page to spot giving trends, compare payment methods, and understand which income categories contribute most to church cash flow.
3. Expenses Page
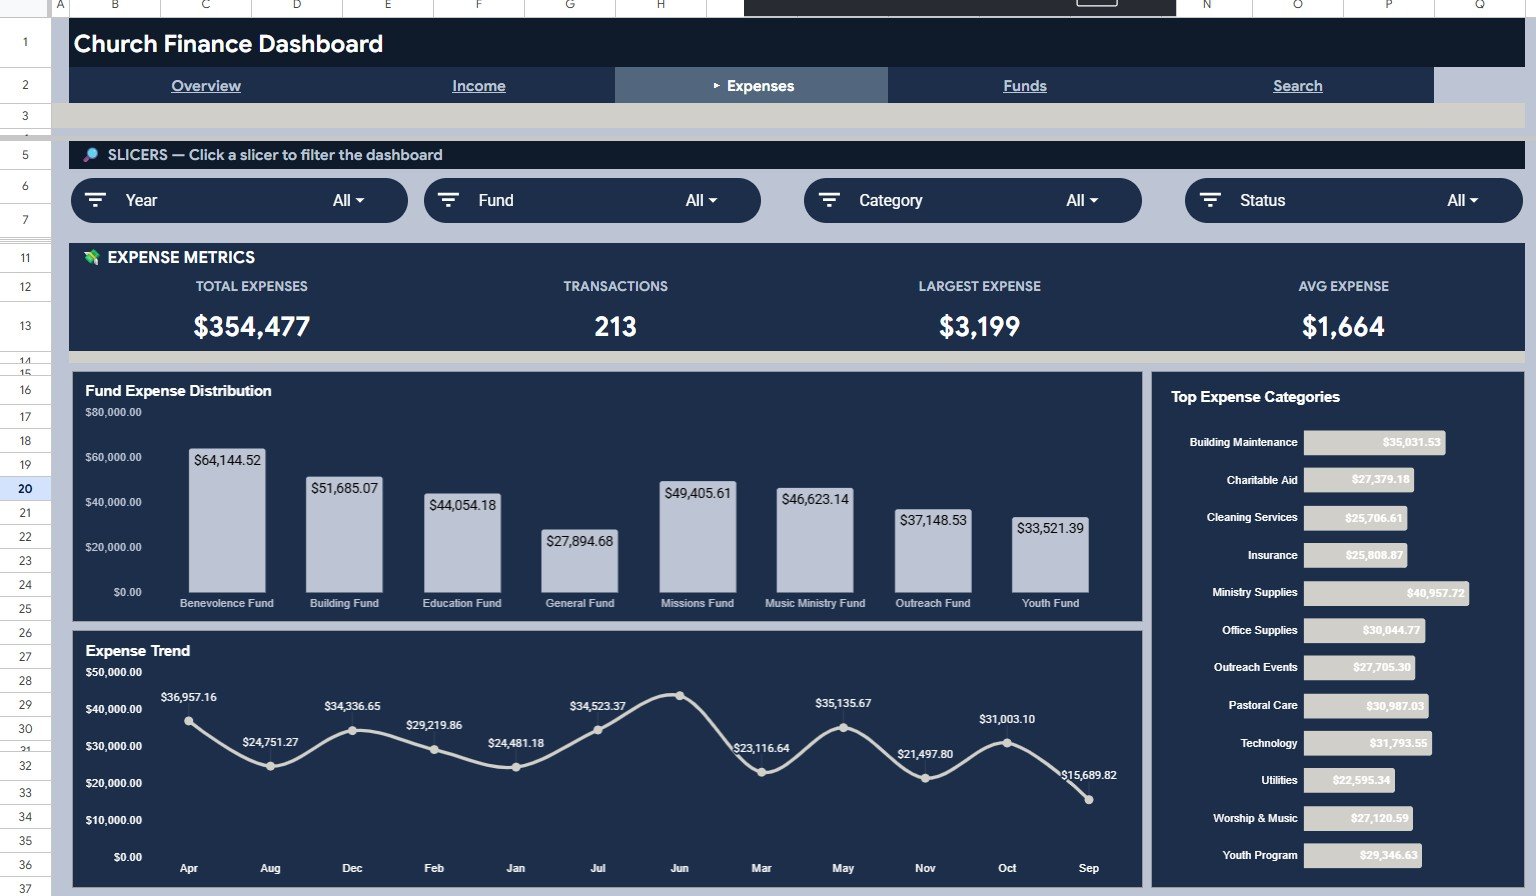
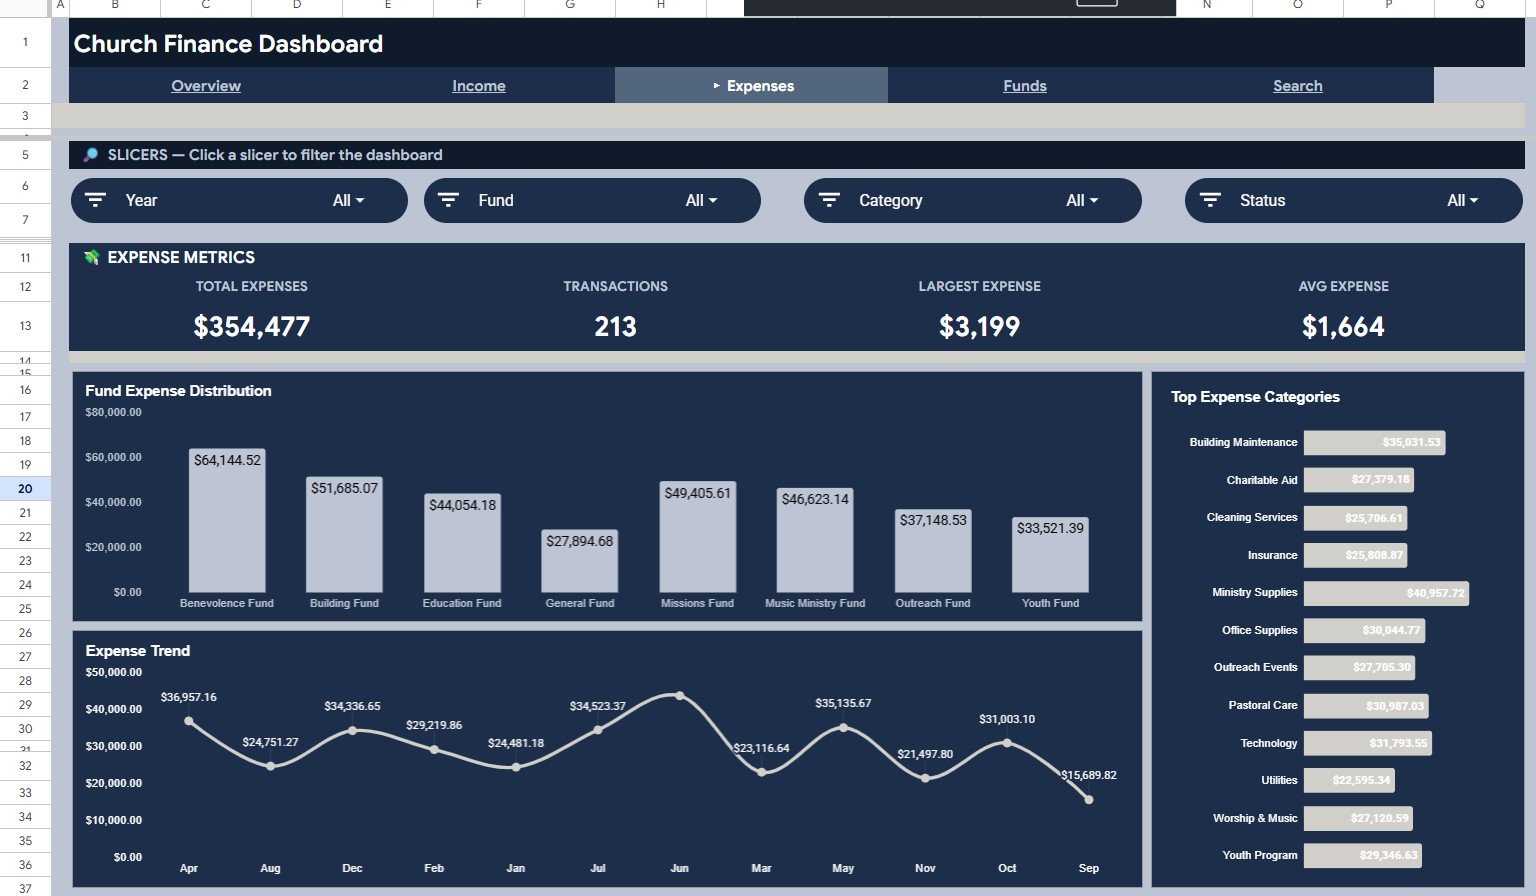
The Expenses page shows Total Expenses, Transactions, Largest Expense, Avg Expense, Fund Expense Distribution by Fund, Top Expense Categories by Category, and Expense Trend by Month. It helps leaders see where funds are being used and which cost areas need attention.
This page is useful for monthly review meetings, budget checks, ministry expense tracking, and spotting unusual spending trends.
4. Search Page
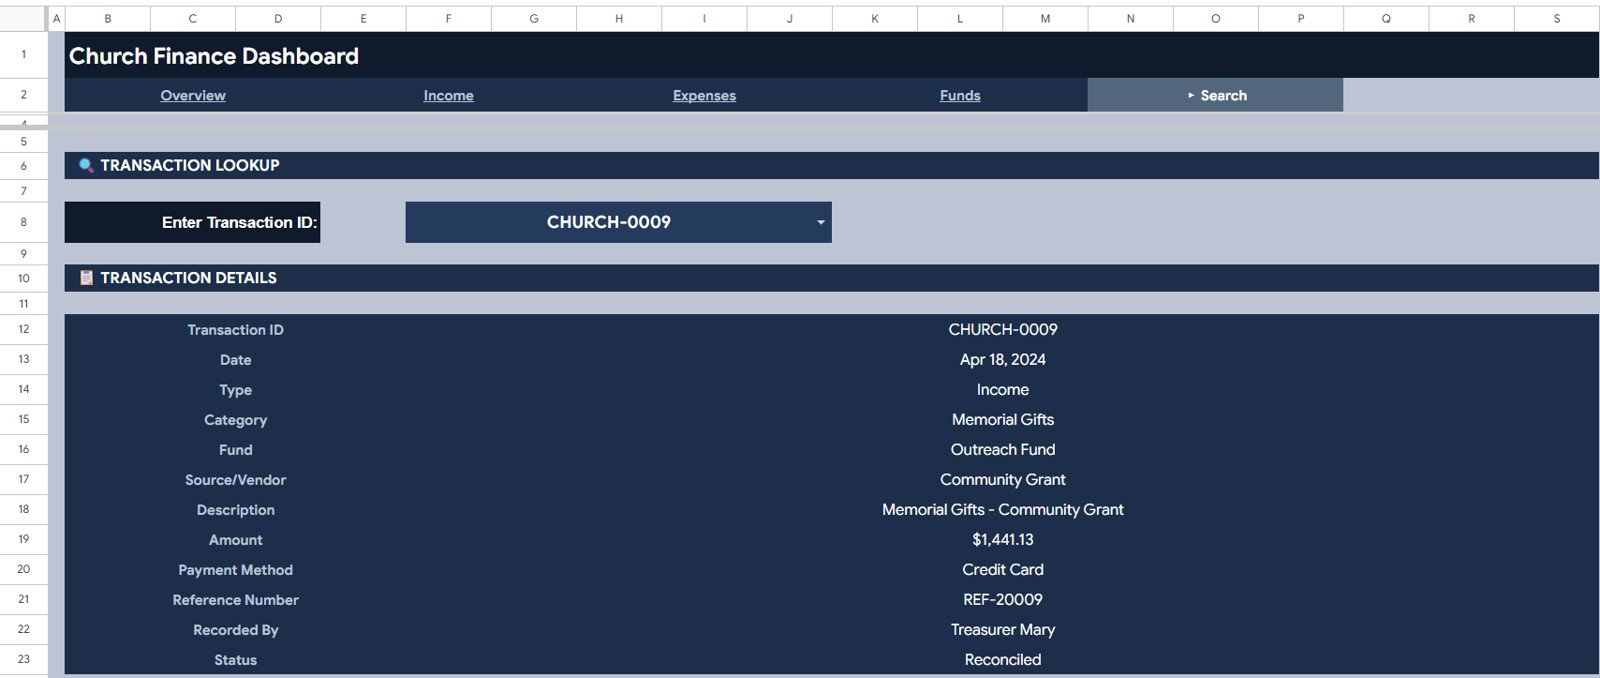
The Search page is a transaction lookup tool. Select a Transaction ID from the dropdown and the sheet displays Transaction ID, Date, Type, Category, Fund, Source/Vendor, Description, Amount, Payment Method, Reference Number, Recorded By, and Status.
5. User Guide Page
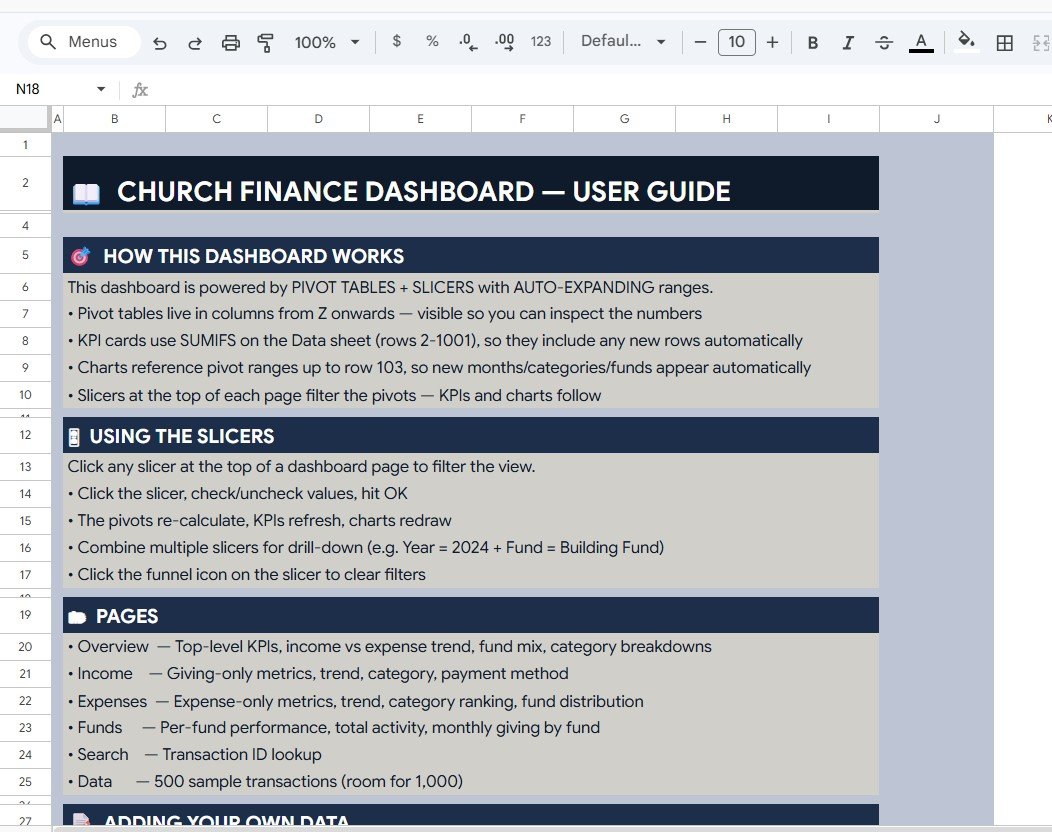
The User Guide page explains how the dashboard works, how to use slicers, what each page shows, and how to add your own data. It is helpful for volunteers or new finance committee members who need to understand the file quickly.
6. Data Sheet Tab
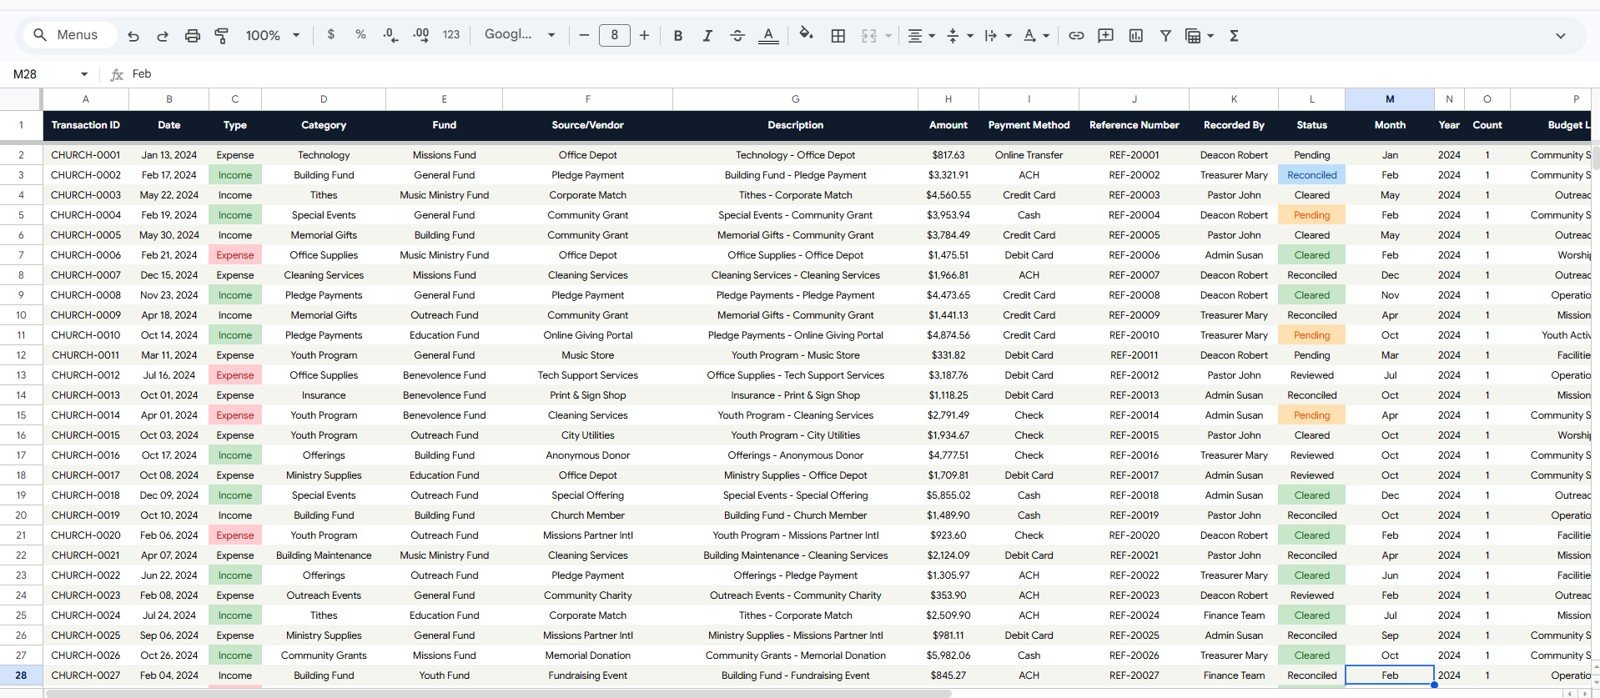
The Data Sheet is where users add church transaction records in the same format as the sample data. Keeping the column order consistent allows the cards, slicers, charts, and Search tab to keep updating correctly.
Church Transaction Analysis Dashboard in Google Sheets vs. Microsoft Excel vs. Paid Church Management Software – Where This Fits
| Feature | This Google Sheets Dashboard | Microsoft Excel Dashboard | Tithe.ly / Planning Center / ChurchTrac |
|---|---|---|---|
| Cost | $9.99 one-time | Usually one-time, file based | Monthly or annual subscription |
| Platform | Google Sheets in browser | Desktop Excel or OneDrive | Vendor cloud platform |
| Setup time | Copy the file and replace data | Open workbook and refresh data | Account setup, imports, and onboarding |
| Real-time team collaboration | Native Google Drive sharing | Possible through OneDrive | Usually seat or role based |
| Mobile access | Google Sheets mobile app | Excel mobile app | Vendor app |
| Customizable fields | Editable spreadsheet columns | Editable workbook structure | Limited by vendor settings |
| Share with link | Built into Google Drive | Possible through Microsoft 365 | Login controlled |
| Year-1 cost at 5 users | $9.99 total | Template cost plus Microsoft access | Often hundreds to thousands |
| Transaction lookup | Built-in Transaction ID search page | Depends on workbook design | Usually available in the system |
Who This Template Is For – and Who It’s Not For
This template is for church treasurers, finance committees, pastors, ministry administrators, bookkeepers, faith-based nonprofits, and volunteer teams that want a clear way to analyze income, expenses, funds, sources, vendors, and payment methods in Google Sheets.
It is not a full accounting system, donation portal, payroll tool, bank-feed connector, donor receipt generator, or member-management platform. It works best when your transaction data is already available in rows and columns and you want fast visual analysis.
How to Use the Church Transaction Analysis Dashboard in Google Sheets
- Open the PDF guide from your download and use the Google Sheets copy link.
- Create your own editable copy in Google Drive.
- Go to the Data Sheet tab and replace the sample records with your own transactions.
- Keep the same column order: Transaction ID, Date, Type, Category, Fund, Source/Vendor, Description, Amount, Payment Method, Reference Number, Recorded By, and Status.
- Use the slicers on the dashboard pages to filter by fund, category, method, status, or date.
- Use the Search tab to pull complete details for a single Transaction ID.
Real-World Use Cases
Maria, Church Treasurer: Maria uses the Overview and Expenses pages before monthly finance meetings to compare income, expenses, and surplus without rebuilding charts.
David, Senior Pastor: David checks the Giving by Fund and Income Sources charts before board updates so he can explain how tithes, offerings, missions, and special funds are moving.
James, Volunteer Bookkeeper: James uses the Search tab when someone asks about a specific transaction, vendor payment, reference number, or recorded status.
Frequently Asked Questions
Is this dashboard built in Google Sheets?
Yes. It is designed for Google Sheets and can be copied into your own Google Drive account for editing and sharing.
What KPIs does it show?
The Overview page shows Total Income, Total Expenses, Net Surplus, and Transactions. Income and expense pages add deeper cards such as Gift Count, Largest Gift, Avg Gift Size, Largest Expense, and Avg Expense.
Can I use my own church funds and categories?
Yes. Replace the sample values in the Data Sheet while keeping the same column format, and the dashboard will reflect your own funds, categories, vendors, and payment methods.
Does it include transaction search?
Yes. The Search tab lets you select a Transaction ID and view the full transaction record instantly.
Does this replace accounting software?
No. It is a reporting dashboard, not a full accounting platform. Use it to analyze prepared transaction data and support finance discussions.
Do I need add-ons or scripts?
No. The template is designed to work inside Google Sheets without requiring paid add-ons or Apps Script setup.
About the Author
Built by PK – Microsoft Certified Professional with 15+ years of Excel, Google Sheets, and Power BI experience. Founder of NextGenTemplates, reaching 300K+ subscribers across YouTube channels. Every template is hand-built and tested before release.
Explore Related Templates
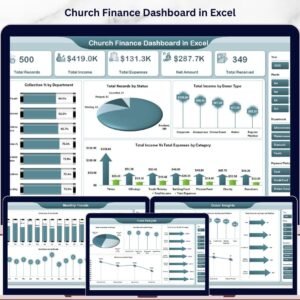
- Church Finance Dashboard in Excel
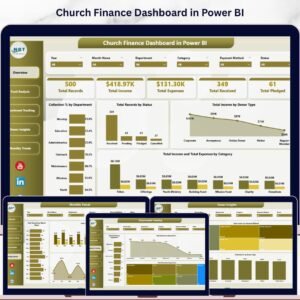
- Church Finance Dashboard in Power BI
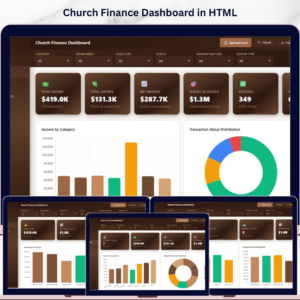
- Church Finance Dashboard in HTML
- Nonprofit Grant Dashboard in Google Sheets
Browse more Google Sheets templates and Google Sheets dashboard templates.
Watch the step-by-step video Demo:
Watch the step-by-step video Demo:
Download the Church Transaction Analysis Dashboard in Google Sheets and turn church transaction records into clear income, expense, fund, source, vendor, and lookup reporting.
Last updated: June 15, 2026.
Compatibility and Requirements
- Works in Google Sheets with a free Google account and a web browser. No software to install. No add-ons or Apps Script are needed.
- The charts are standard Google Sheets charts. Google explains how to edit them in Add & edit a chart or graph.










Reviews
There are no reviews yet.