

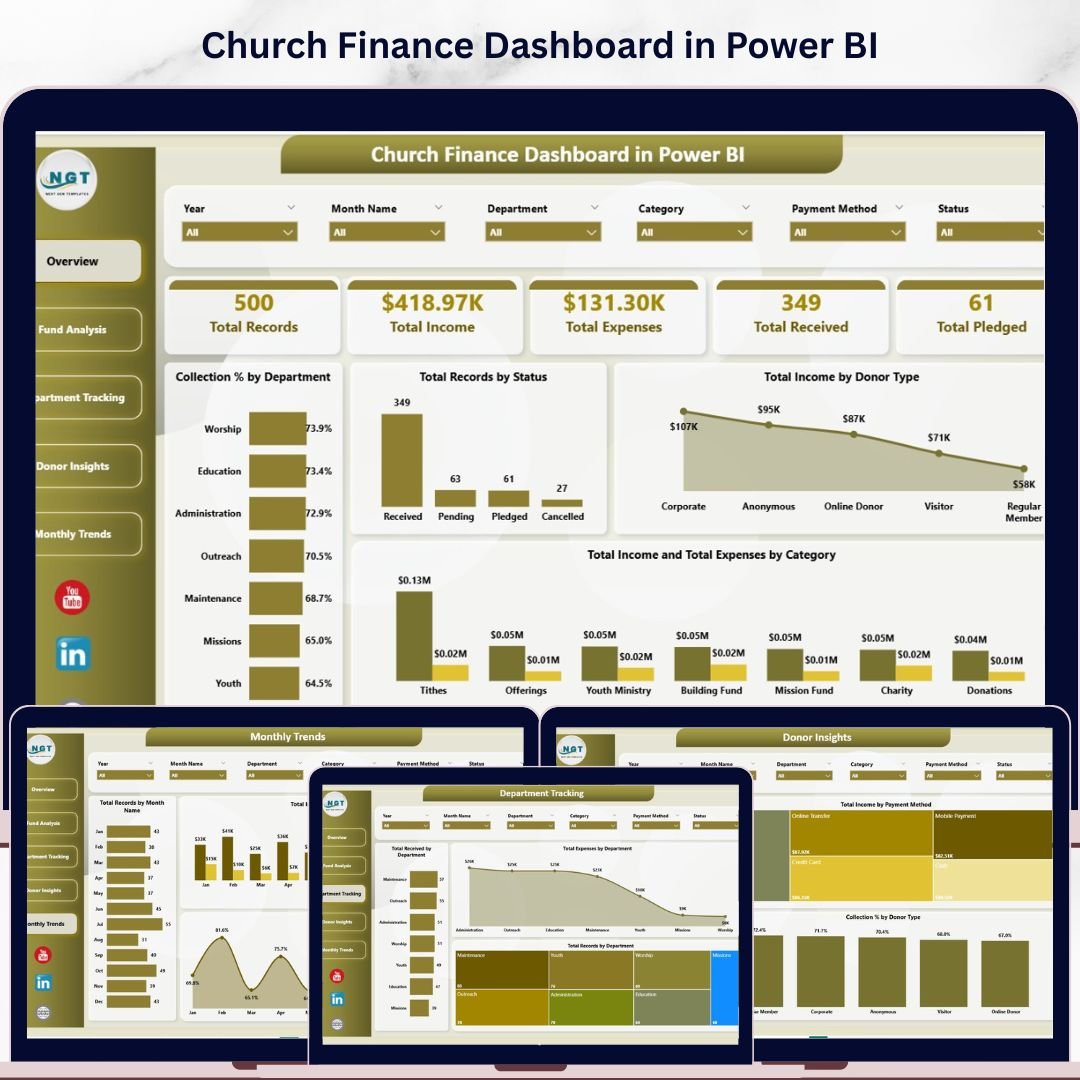

Church Finance Dashboard in Power BI is a professionally designed, ready-to-use Power BI template that helps churches, ministries, and faith-based organizations manage their finances with clarity and precision. Whether you need to track tithes, offerings, departmental expenses, donor contributions, or monthly income patterns, this dashboard consolidates everything into one clean, interactive, and visually compelling Power BI file. This Power BI Dashboard Template includes 5 interactive dashboard pages with dynamic slicers and detailed analytical charts that update automatically. It is built for church administrators, pastors, finance committees, and nonprofit treasurers who want a complete financial overview without complex setup.
🔑 Key Features of Church Finance Dashboard in Power BI
📌 5 Interactive Dashboard Pages – Overview, Fund Analysis, Department Tracking, Donor Insights, and Monthly Trends provide a complete 360-degree view of your church’s financial health.
📌 Dynamic KPI Cards – High-level summary cards display Total Records, Total Income, Total Expenses, Total Received, and Total Pledged at a glance on the Overview page.
📌 Multiple Analytical Charts – Each page presents focused analysis through visually engaging charts including Collection % by Department, Total Records by Status, Total Income by Donor Type, and Total Income and Total Expenses by Category.
📌 Slicer-Based Filtering – Apply quick filters across the dashboard to slice data by category, status, fund type, department, or donor type for instant, targeted insights.
📌 Professional Design – Clean layout with intuitive navigation for seamless switching between all 5 dashboard pages.
📌 No Coding Required – Simply open in Power BI Desktop, replace the sample data with your own, and the entire dashboard updates automatically.
Also explore our Church Finance Dashboard in Excel if you prefer working in Microsoft Excel, and browse all our Finance Dashboard Templates for more options.
📦 What’s Inside the Church Finance Dashboard in Power BI
This template includes 5 interactive dashboard pages organized for complete church financial management:
✨ Overview Page – Displays 5 KPI cards (Total Records, Total Income, Total Expenses, Total Received, Total Pledged) along with 4 analytical charts: Collection % by Department, Total Records by Status, Total Income by Donor Type, and Total Income and Total Expenses by Category. Multiple slicers let you filter and explore the data instantly.
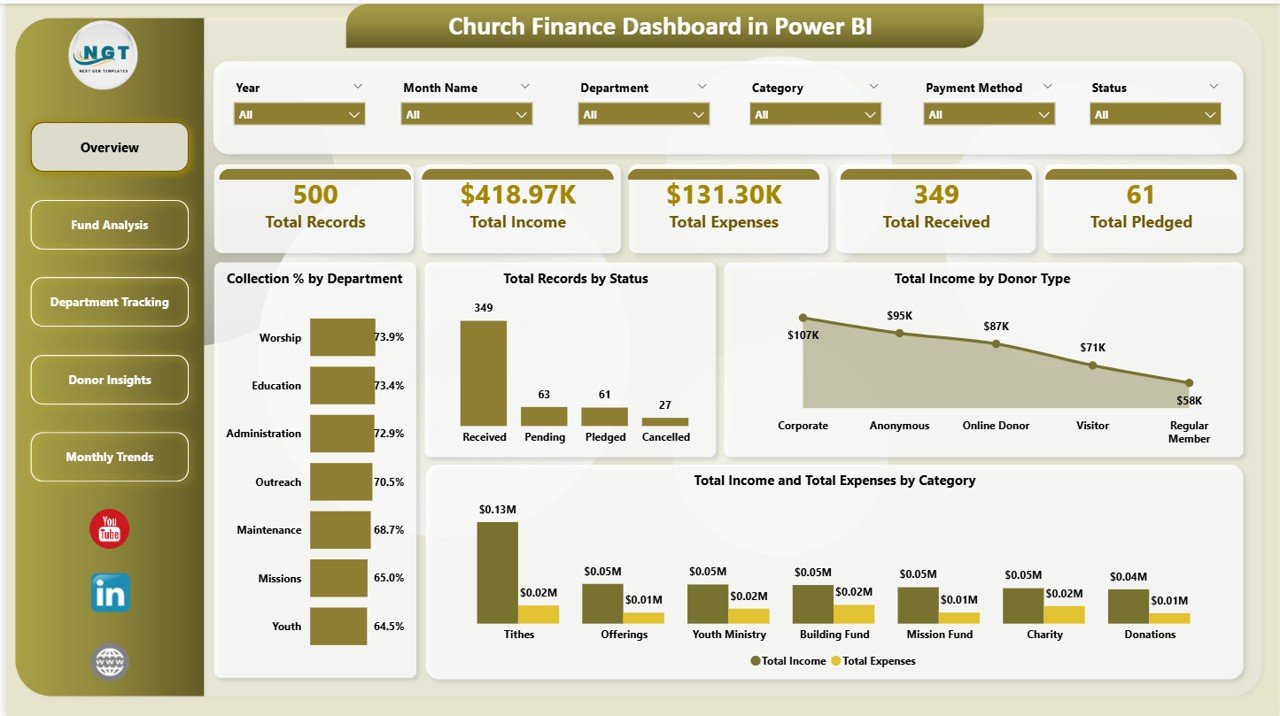
Church Finance Dashboard in Power BI
✨ Fund Analysis Page – Breaks down financial data by fund type with 3 charts: Total Income by Sub Category, Total Income by Fund Type, and Total Records by Fund Type. This page helps church treasurers understand where funds are coming from and how they are distributed across different fund categories.
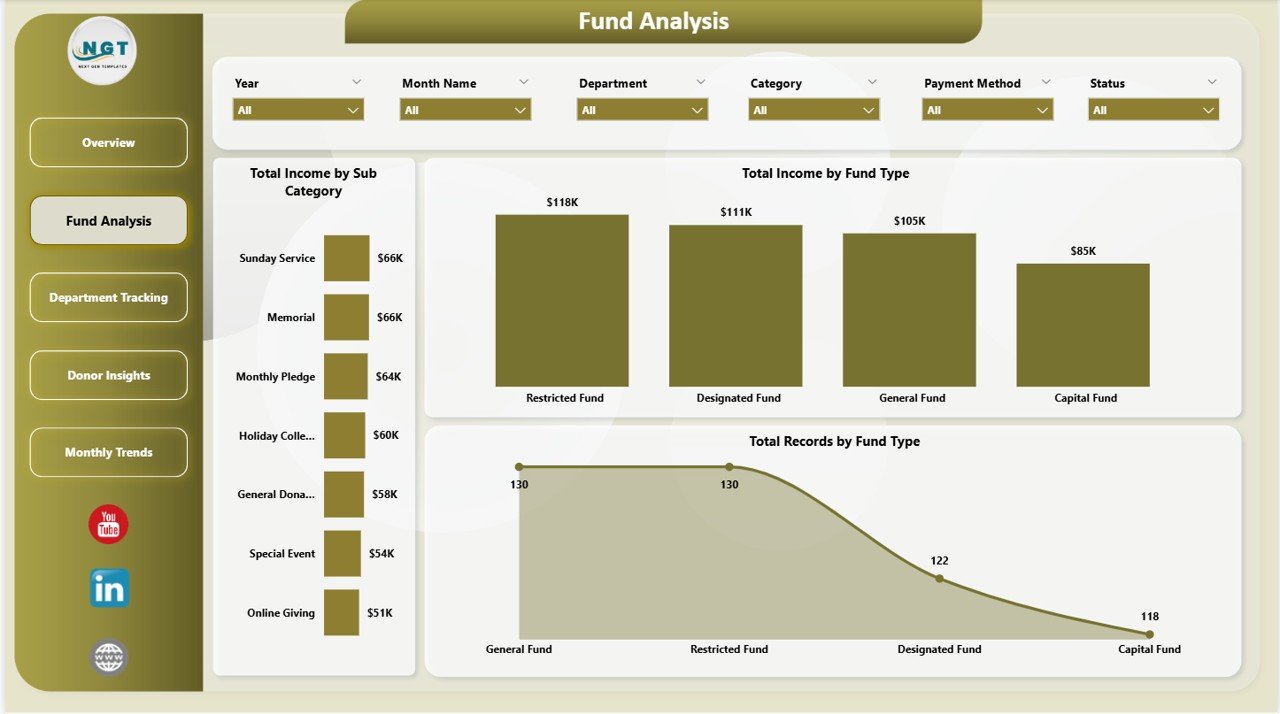
Fund Analysis Page
✨ Department Tracking Page – Provides departmental financial visibility through 3 charts: Total Received by Department, Total Expenses by Department, and Total Records by Department. Identify which departments are spending the most and which are generating the highest collections.
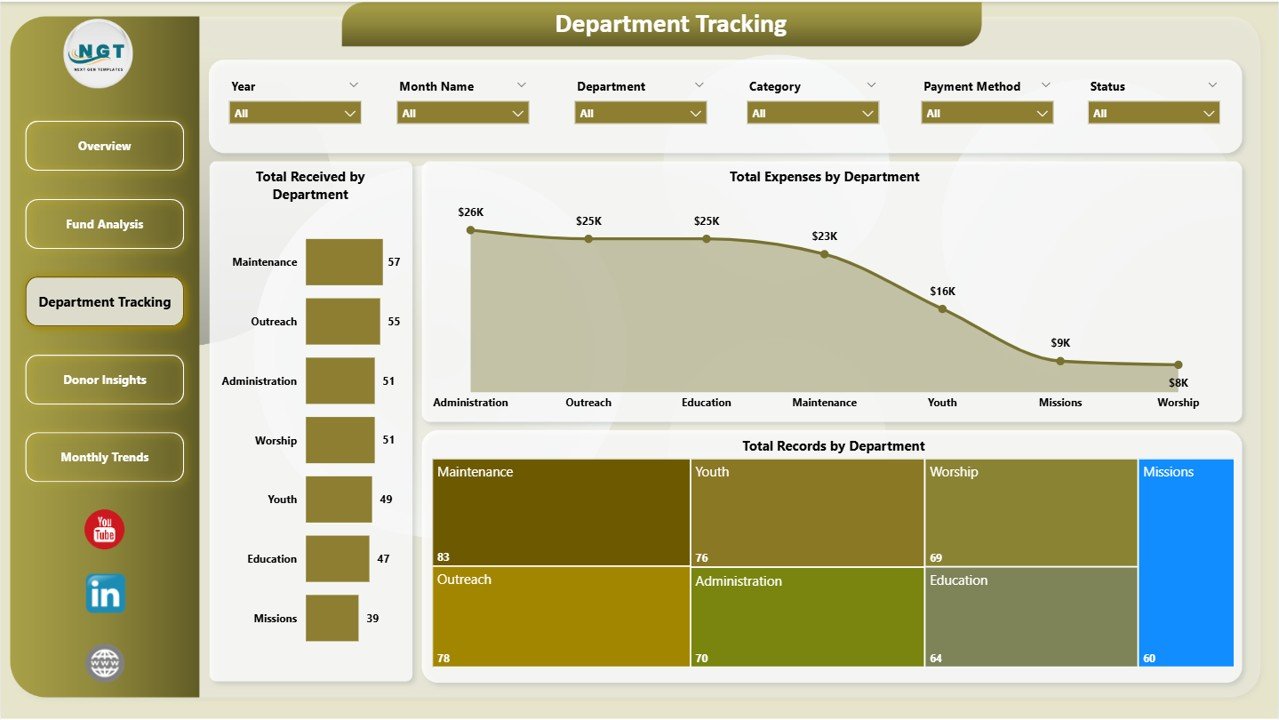
Department Tracking Page
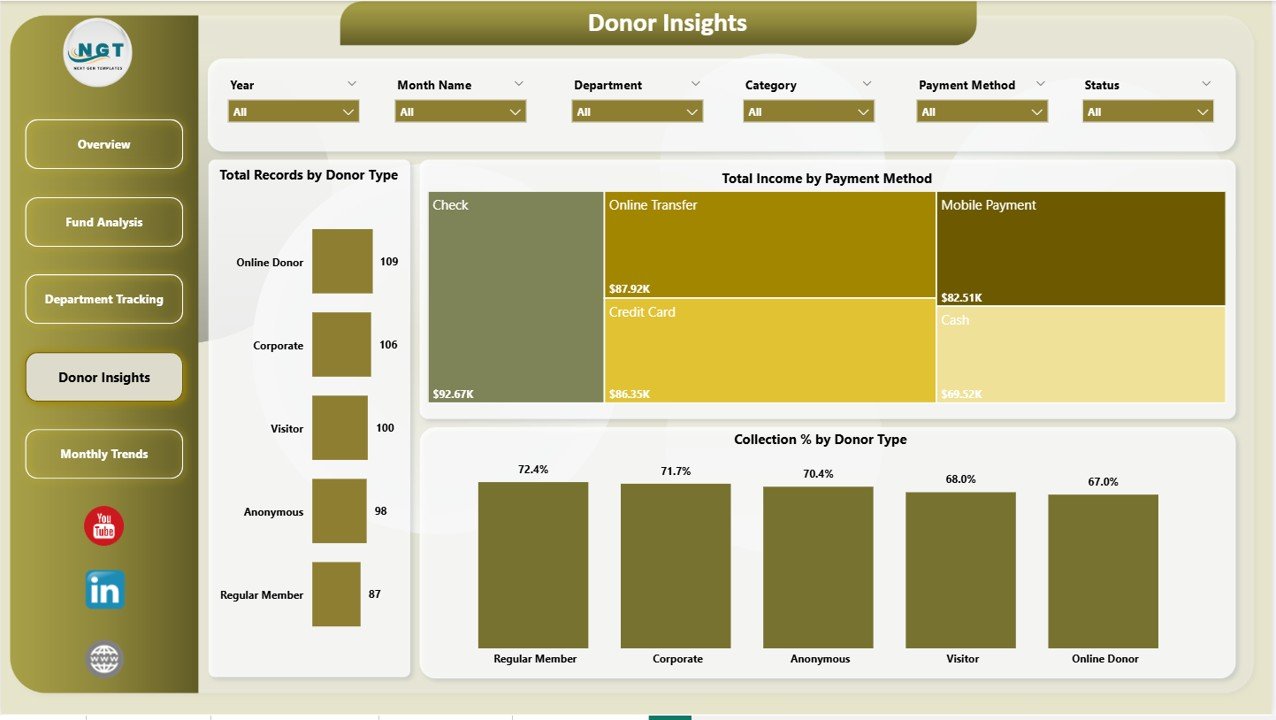
✨ Donor Insights Page – Analyzes donor behavior and payment methods with 3 charts: Total Records by Donor Type, Total Income by Payment Method, and Collection % by Donor Type. Understand who your top donors are and which payment channels they prefer.
Donor Insights Page
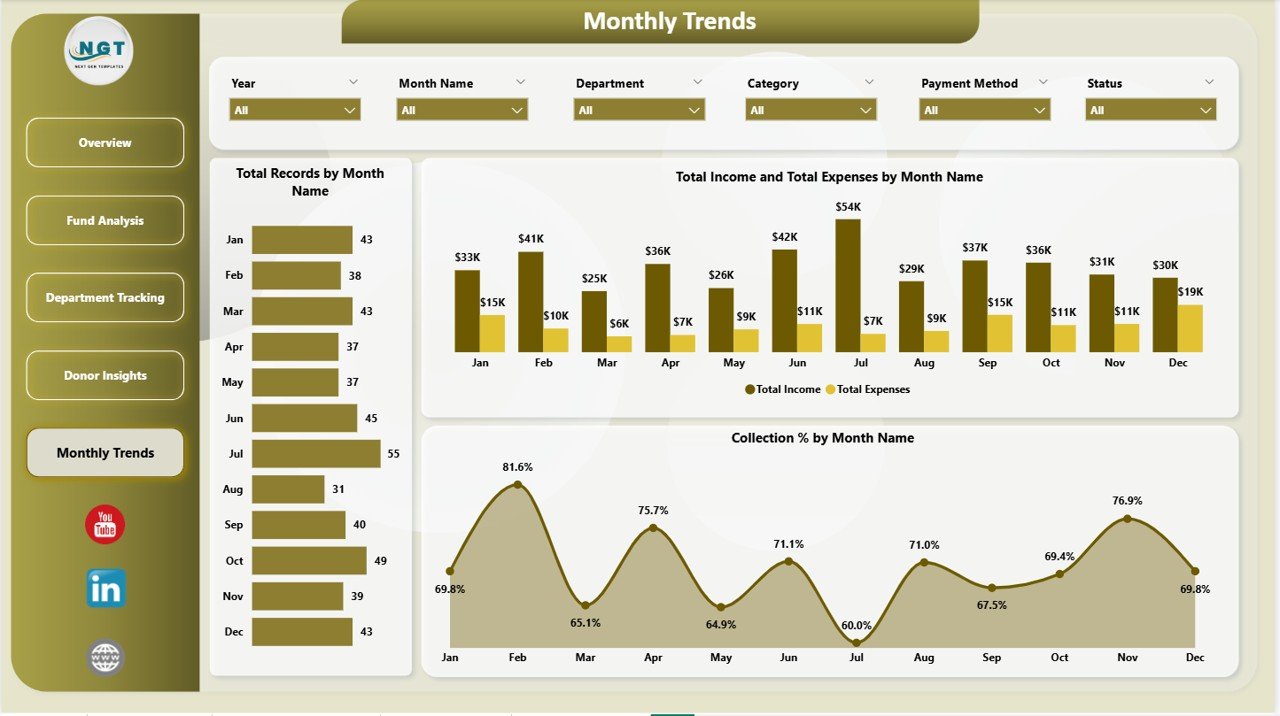
✨ Monthly Trends Page – Tracks time-based financial patterns through 3 charts: Total Records by Month Name, Total Income and Total Expenses by Month Name, and Collection % by Month Name. Spot seasonal giving trends and plan church budgets accordingly.
Monthly Trends Page
⚙️ How to Use the Church Finance Dashboard in Power BI
1️⃣ Download and Open – Download the .pbix file and open it in Power BI Desktop (free from Microsoft).
2️⃣ Replace the Sample Data – Connect your own Excel file or database source containing church financial records including income, expenses, donor details, departments, and fund types.
3️⃣ Refresh the Dashboard – Click Refresh in Power BI to update all charts, KPI cards, and visuals automatically.
4️⃣ Use Slicers to Filter – On each page, use slicers to filter by department, status, category, donor type, or fund type for targeted insights.
5️⃣ Navigate Between Pages – Switch between Overview, Fund Analysis, Department Tracking, Donor Insights, and Monthly Trends to explore different aspects of your church finances.
👥 Who Can Benefit from This Church Finance Dashboard in Power BI
⛪ Church Pastors and Leaders – Get a clear financial picture of your ministry’s income and expenses without any technical expertise.
💰 Church Finance Committees – Present transparent, data-backed financial reports to your congregation and board members.
📋 Church Treasurers and Bookkeepers – Track every tithe, offering, and expense in a structured, organized dashboard with interactive charts.
🏛️ Nonprofit Faith-Based Organizations – Monitor donations, grants, and program expenses across multiple departments and fund types.
📊 Ministry Department Heads – Understand your department’s financial performance and make data-driven budget requests using powerful Power BI analytics.
Also check out the Religious & Faith-Based Organizations KPI Dashboard in Power BI for KPI-focused tracking, and the Religious & Faith-Based Organizations Dashboard in Power BI for broader organizational analytics.
❓ Frequently Asked Questions
What does the Church Finance Dashboard in Power BI track?
The Church Finance Dashboard in Power BI tracks 5 key metrics — Total Records, Total Income, Total Expenses, Total Received, and Total Pledged. It includes 5 interactive dashboard pages covering fund analysis, department tracking, donor insights, and monthly trends with 16 analytical charts total.
Do I need advanced Power BI skills to use this template?
No. Simply open the .pbix file in Power BI Desktop, replace the sample data with your own data source, and click Refresh. All charts, KPI cards, and visuals update automatically. No DAX formulas or complex setup required.
Can I customize this dashboard for my church’s specific departments?
Yes. You can modify department names, fund types, donor categories, and other data fields in your source file. The Power BI visuals will adapt automatically when you refresh the data.
What is the best Power BI template for tracking church donations and expenses?
The Church Finance Dashboard in Power BI from Nextgen Templates is one of the best options. It provides a complete view of income, expenses, donors, departments, and monthly trends in a single interactive Power BI file with 5 dashboard pages and dynamic analytical charts.
Is this template suitable for small churches?
Absolutely. Whether you run a small community church or a large multi-department ministry, this dashboard scales to fit your needs. The slicer-based filtering makes it easy to focus on the specific data that matters to your organization.
Can I share this dashboard with my church board?
Yes. You can publish the dashboard to Power BI Service for online sharing, export pages as PDF reports, or present directly from Power BI Desktop during board meetings.
🔗 Explore Related Templates
📌 Church Finance Dashboard in Excel – The Excel version with pivot-powered charts and slicer-based filtering.
📌 Religious & Faith-Based Organizations KPI Dashboard in Power BI – KPI-focused tracking for attendance, donations, volunteers, and community engagement.
📌 Religious & Faith-Based Organizations Dashboard in Power BI – Broader organizational analytics with department, category, and location analysis.
📖 Click here to read the Detailed Blog Post
🎥 Visit our YouTube channel to learn step-by-step video tutorials
👉 YouTube.com/@NextGenTemplates
Watch the step-by-step video tutorial:
YouTube






























Reviews
There are no reviews yet.