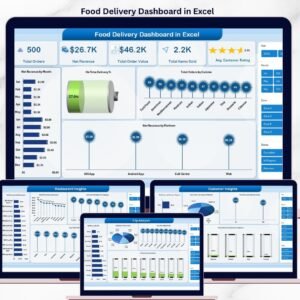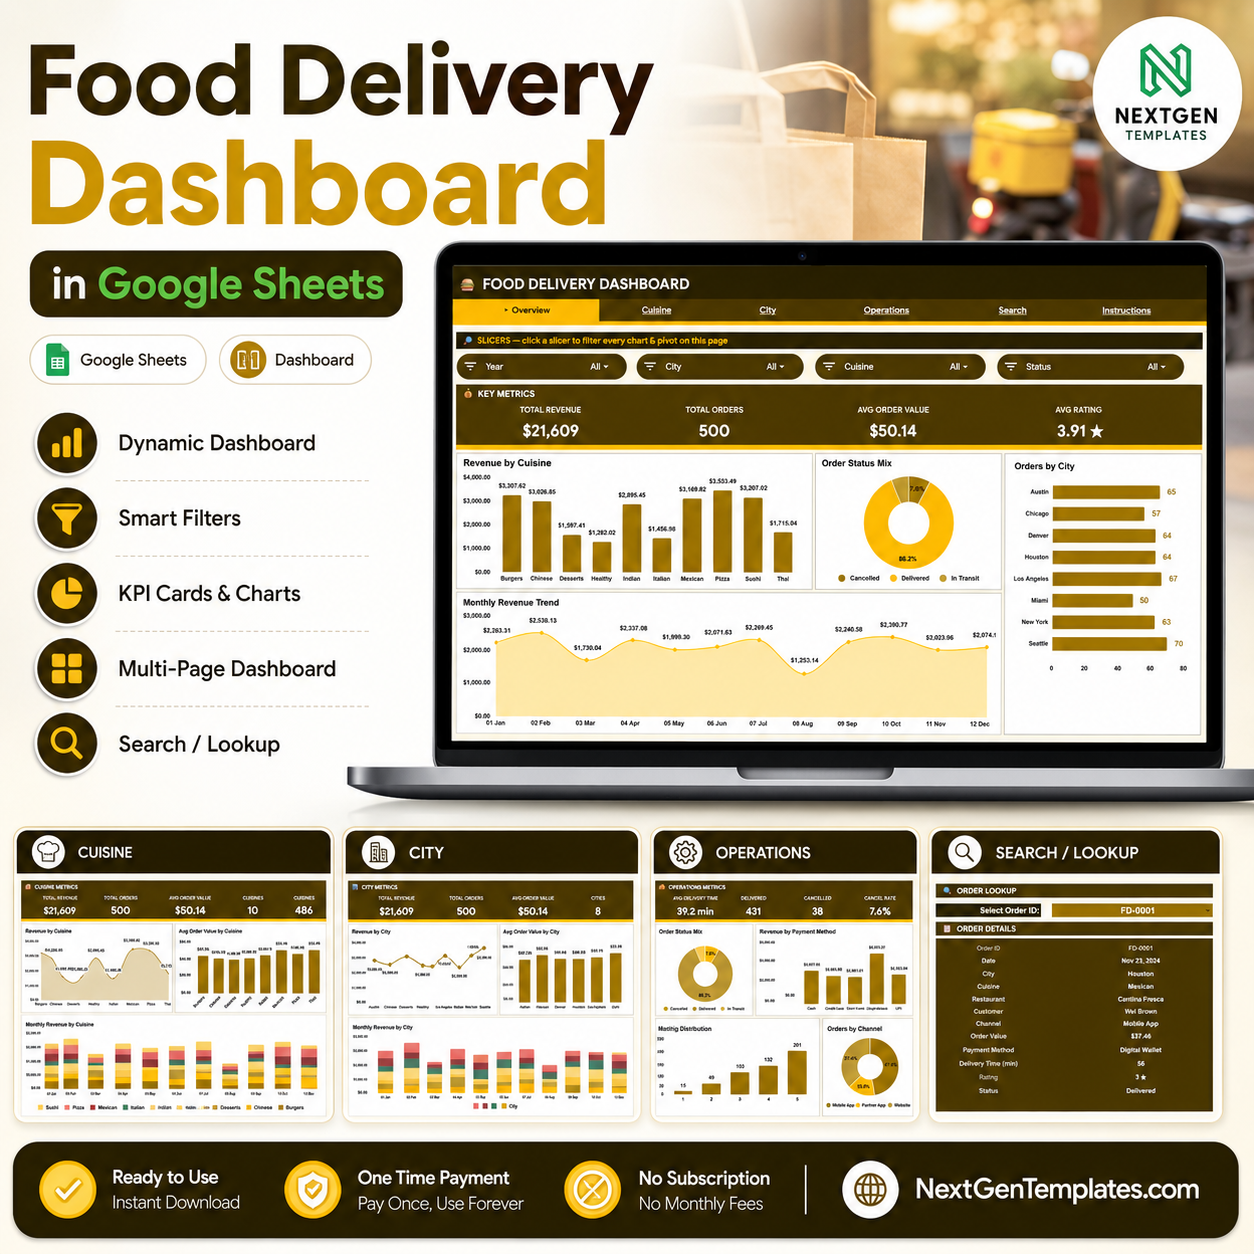
The Food Delivery Dashboard in Google Sheets tracks 4 headline KPIs across 6 connected sheets, with 17 pre-built charts and click-to-filter slicers. Setup takes under 10 minutes — paste your order data into the Data sheet and every chart, card, and lookup updates automatically.
🌍 Join 8,400+ teams in 40+ countries using NextGenTemplates to replace paid SaaS tools with one-time-purchase Excel, Google Sheets, Power BI, and HTML templates.
✅ Instant download · One-time payment · No subscription · No per-user fees · Lifetime access
🔑 Key Features of the Food Delivery Dashboard in Google Sheets
This dashboard tracks 4 headline KPIs — Total Revenue, Total Orders, Average Order Value, and Average Rating — and refreshes all of them the instant you paste new rows into the Data sheet. No formulas to rebuild, no charts to re-link.
It ships with 17 pre-built charts spread across four analysis pages, covering revenue, orders, delivery time, and ratings by cuisine, city, payment method, channel, and month. Each chart is already wired to the data range, so it expands as your order history grows.
Every analysis page carries slicer filters. Click a cuisine, city, order status, channel, or payment method and the whole page recalculates to show only the matching orders — the same drill-down experience you would expect from a paid BI tool, running entirely inside Google Sheets.
Because it is 100% native Google Sheets, there are no add-ons, no Apps Script permissions, and no installation. It opens in any browser and on the Google Sheets mobile app, and you can share it with your team using a single link. Explore more Google Sheets Dashboards if you need other formats.
📦 What’s Inside the Food Delivery Dashboard in Google Sheets
The template is built as six connected sheets — one overview, three analysis pages, a single-order search, and the data entry sheet. Here is what each one does.
Overview Page
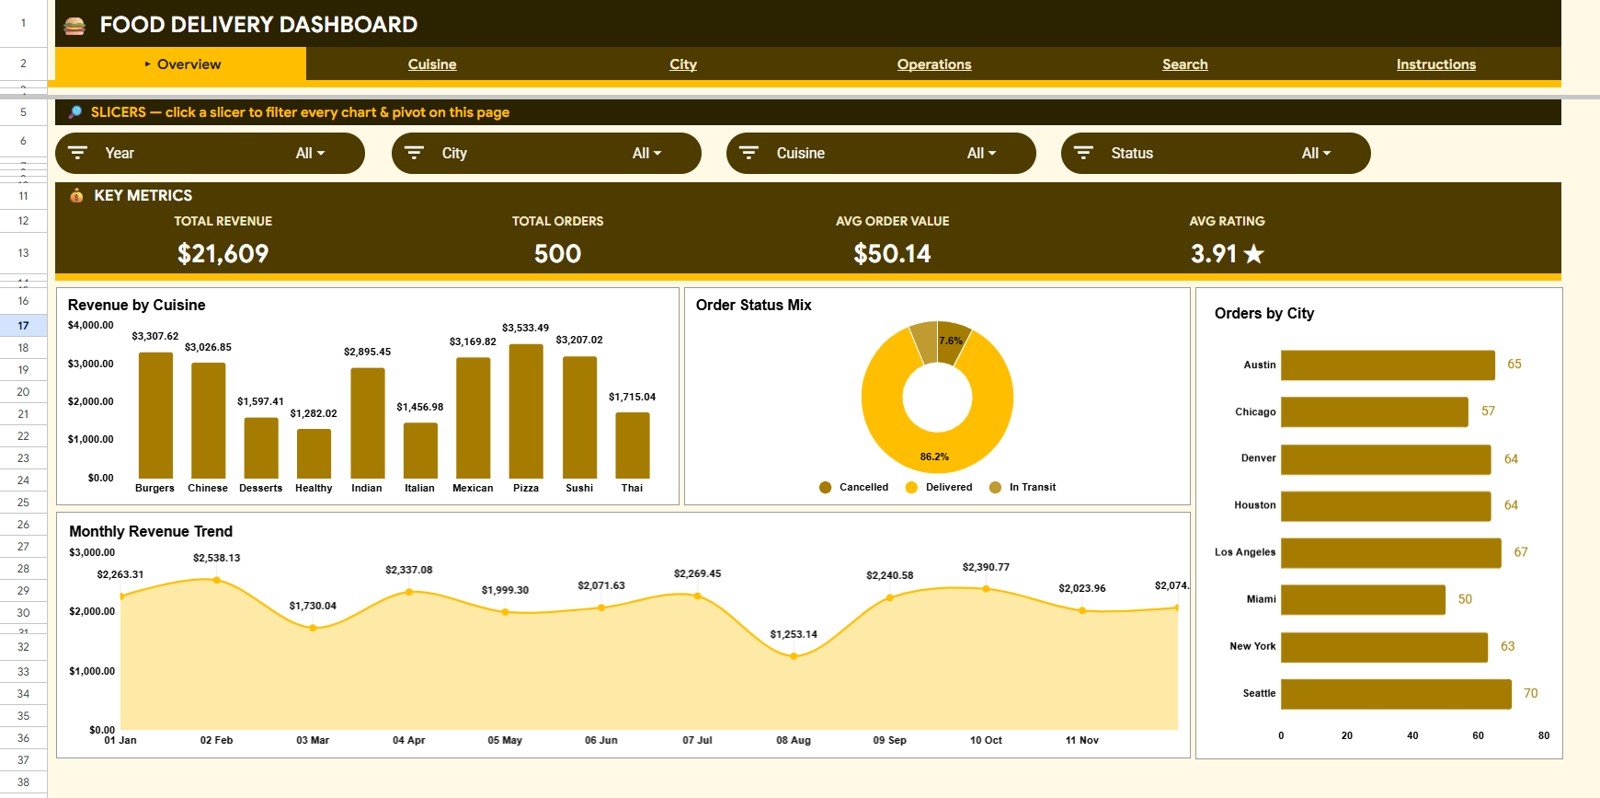
The Overview page opens with four KPI cards — Total Revenue, Total Orders, Average Order Value, and Average Rating — for an instant read on performance. Below the cards, charts show Revenue by Cuisine, Orders by Status, Orders by City, and Revenue by Month, and slicers at the top let you filter the entire page in a click.
Food Delivery Dashboard
Cuisine Analysis
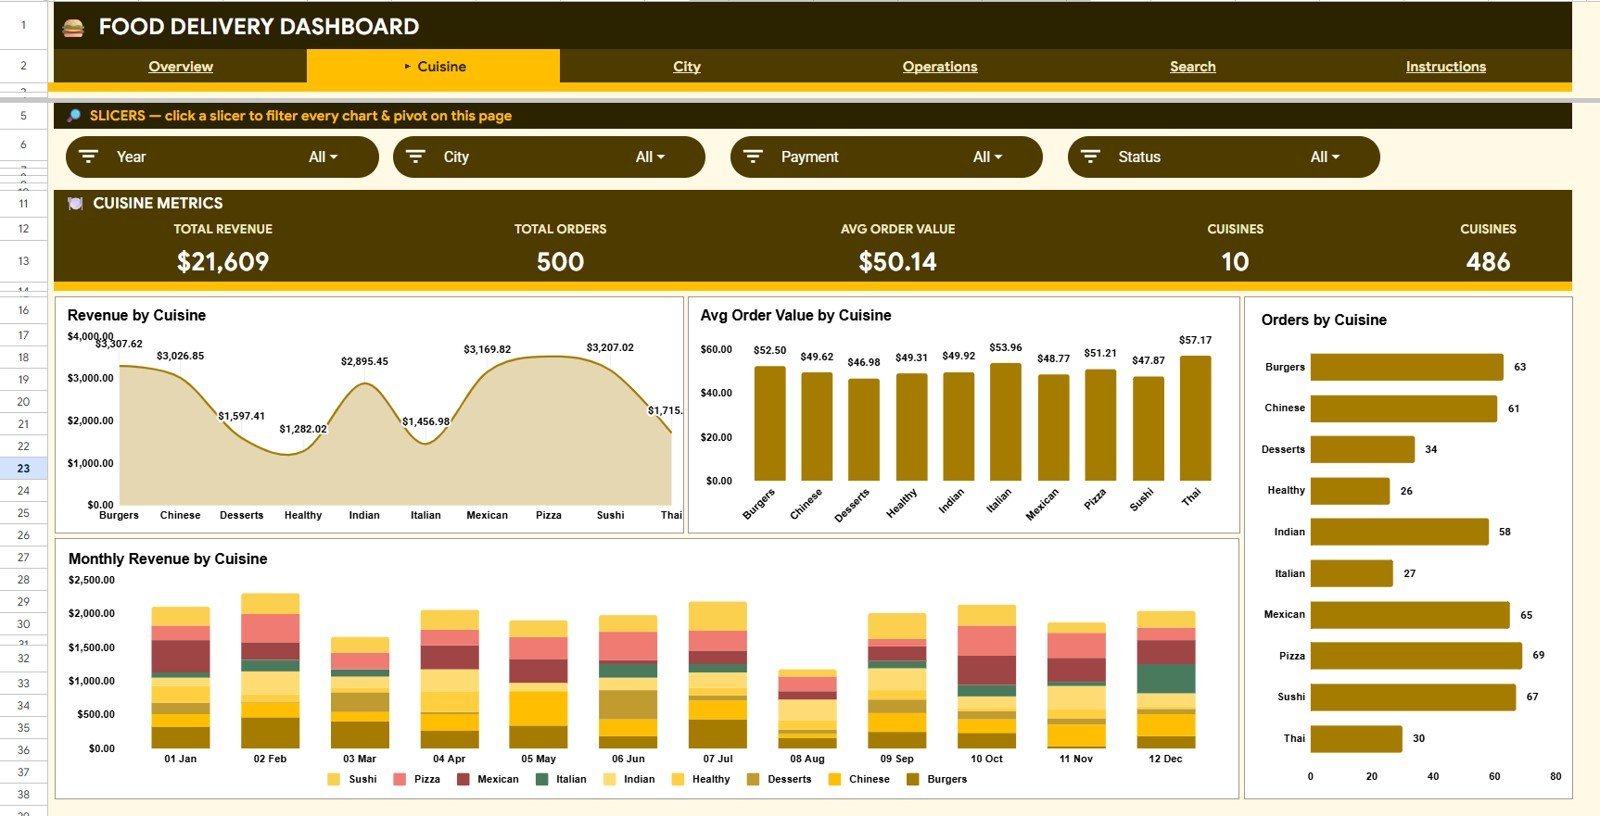
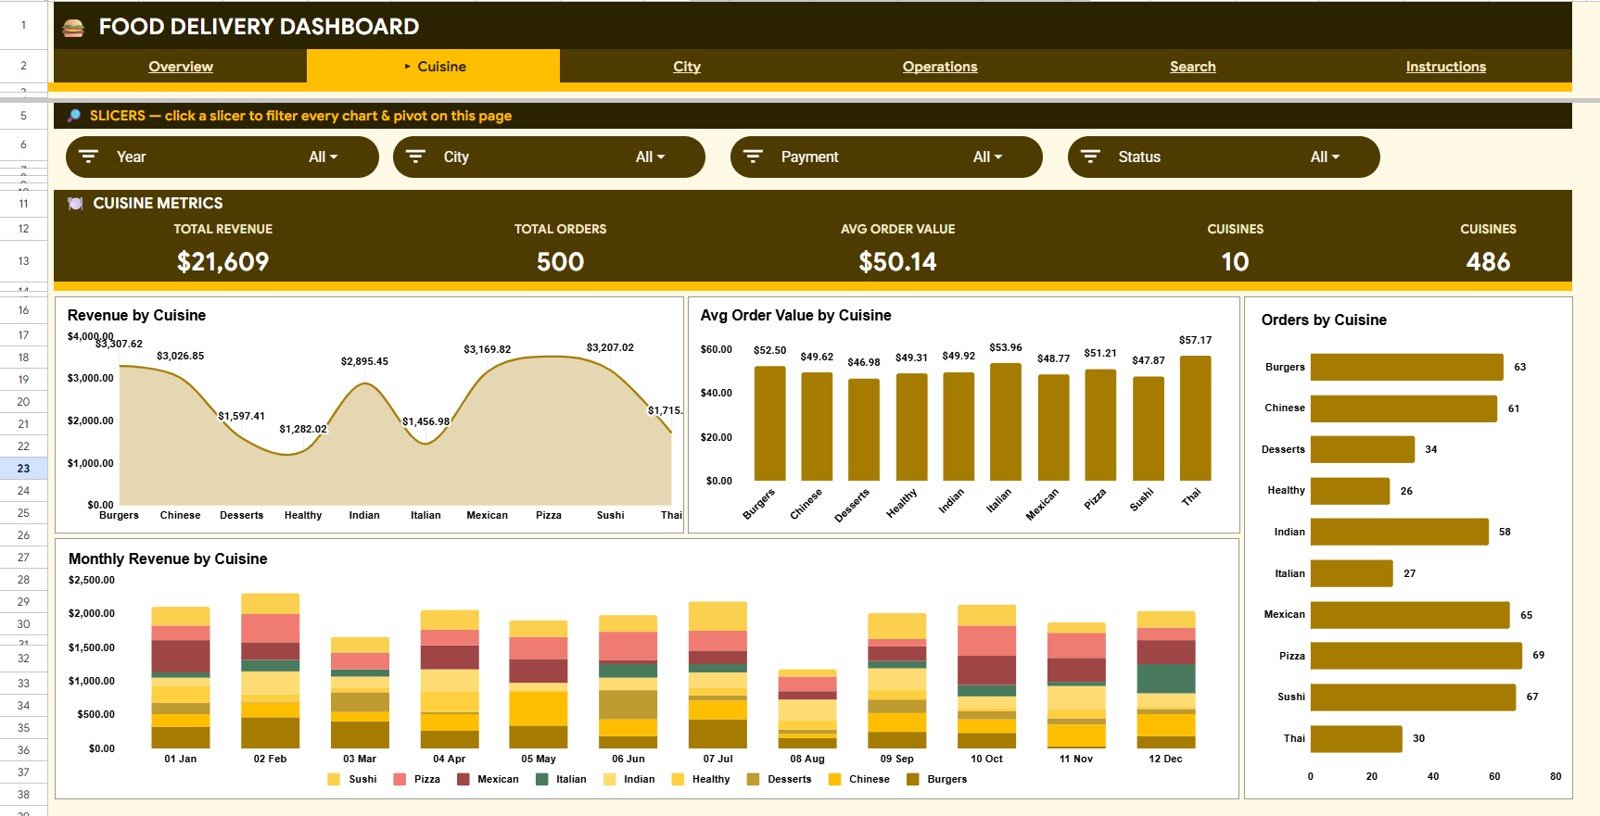
This page breaks performance down by cuisine type so you can see which menus drive the business. Charts include Revenue by Cuisine, Average Order Value by Cuisine, Orders by Cuisine, and Monthly Revenue by Cuisine.
Cuisine Analysis
City Analysis
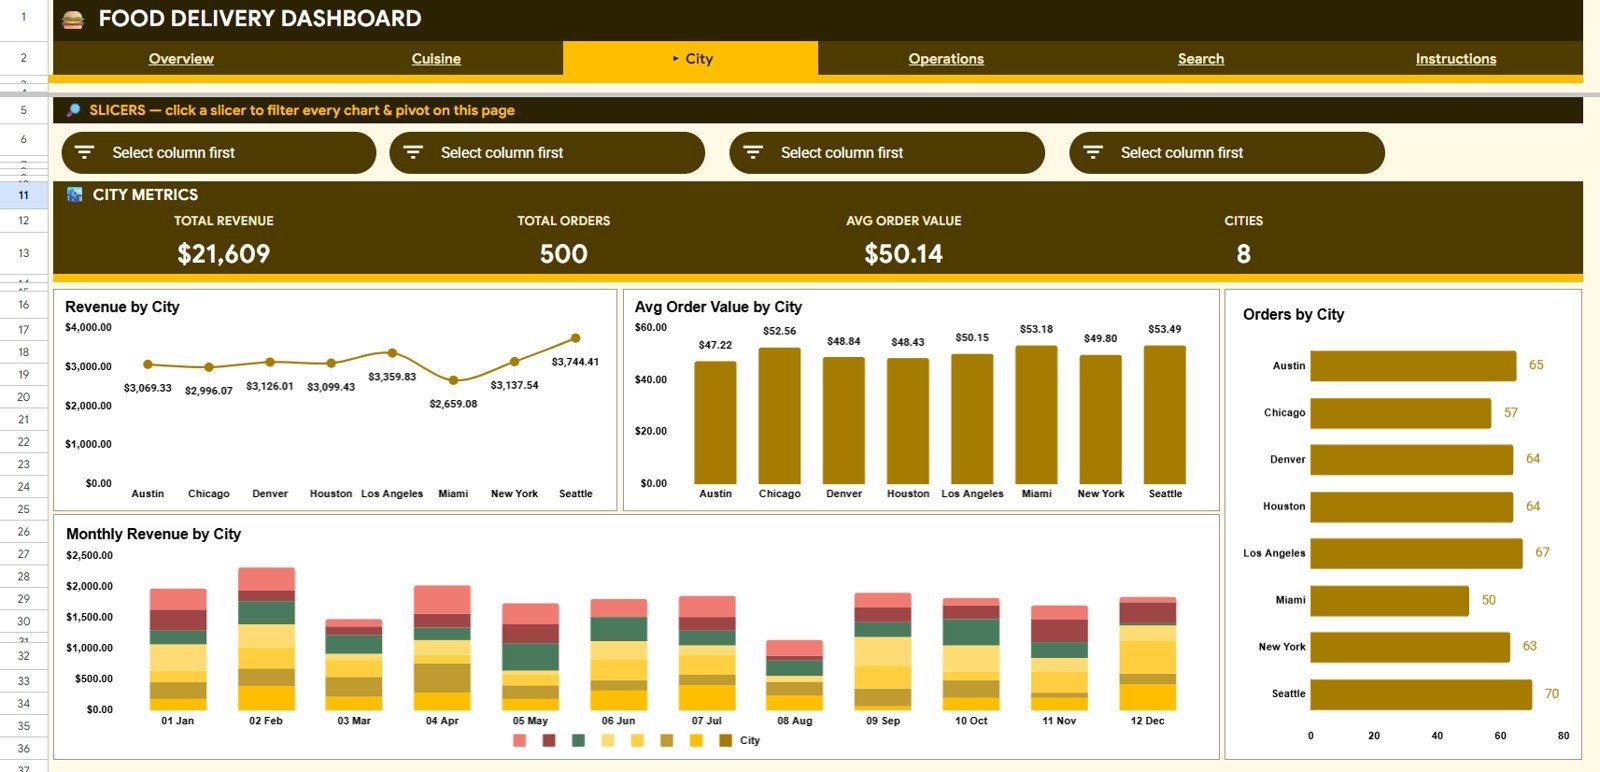
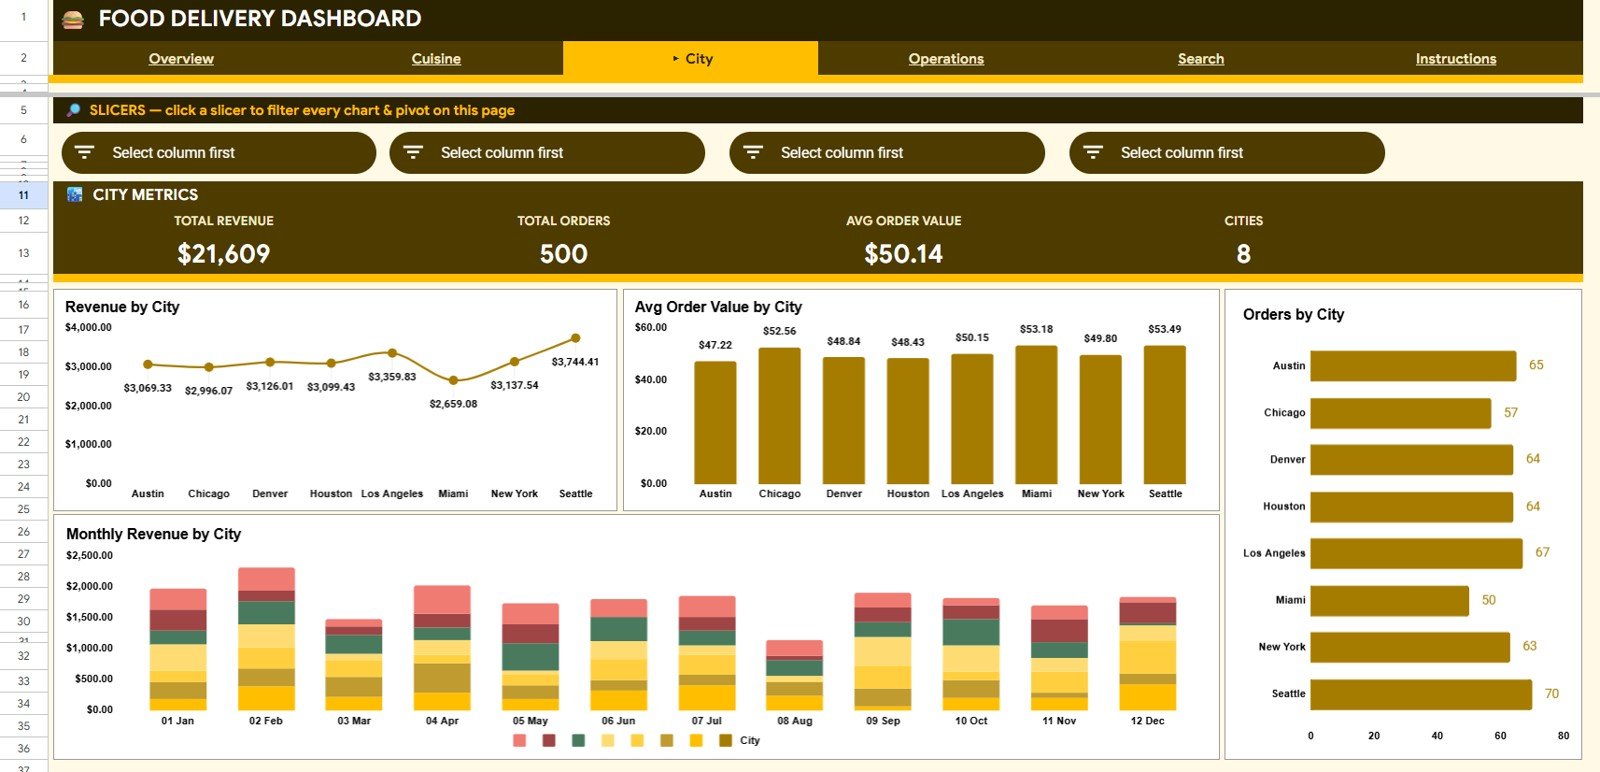
The City Analysis page compares delivery zones and locations head to head. Charts include Revenue by City, Average Order Value by City, Orders by City, and Monthly Revenue by City to reveal where demand is concentrated.
City Analysis
Operations Analysis
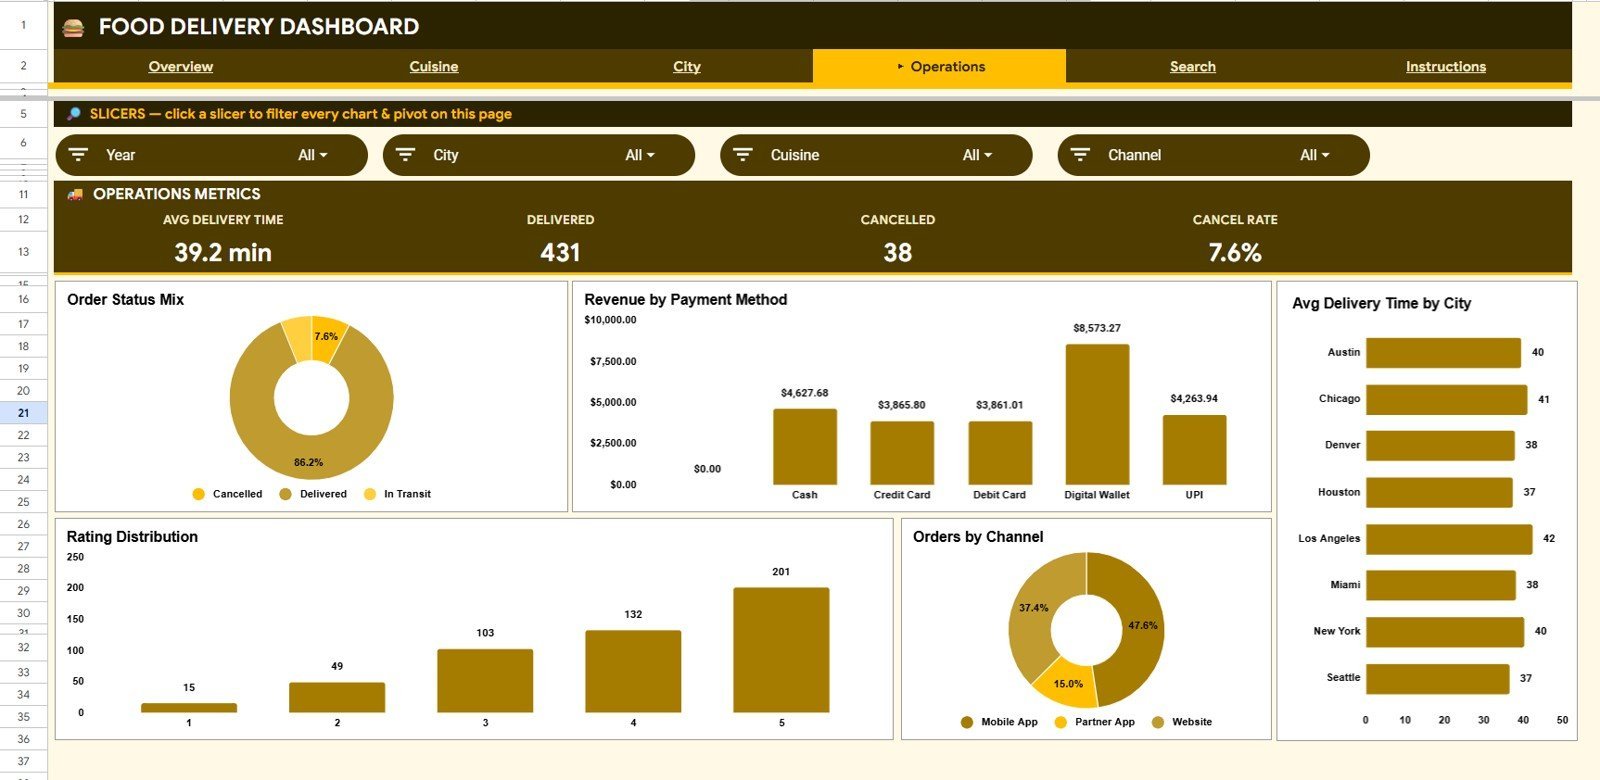
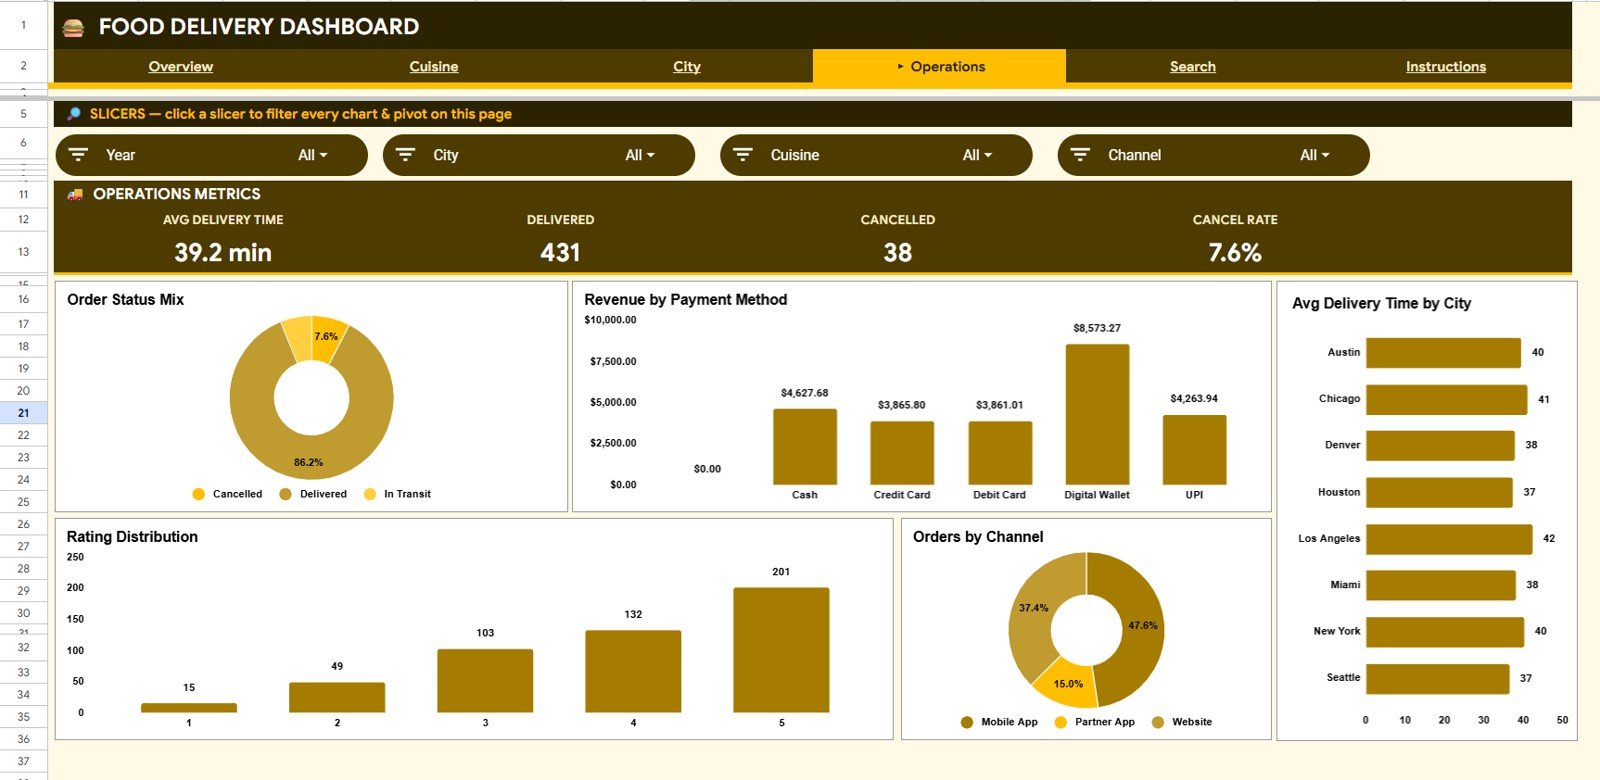
This page focuses on fulfilment and service quality. Charts include Orders by Status, Revenue by Payment Method, Average Delivery Time by City, Orders by Rating, and Orders by Channel — so you can spot delays, cancellations, and low-rated zones fast.
Operations Analysis
Search Sheet
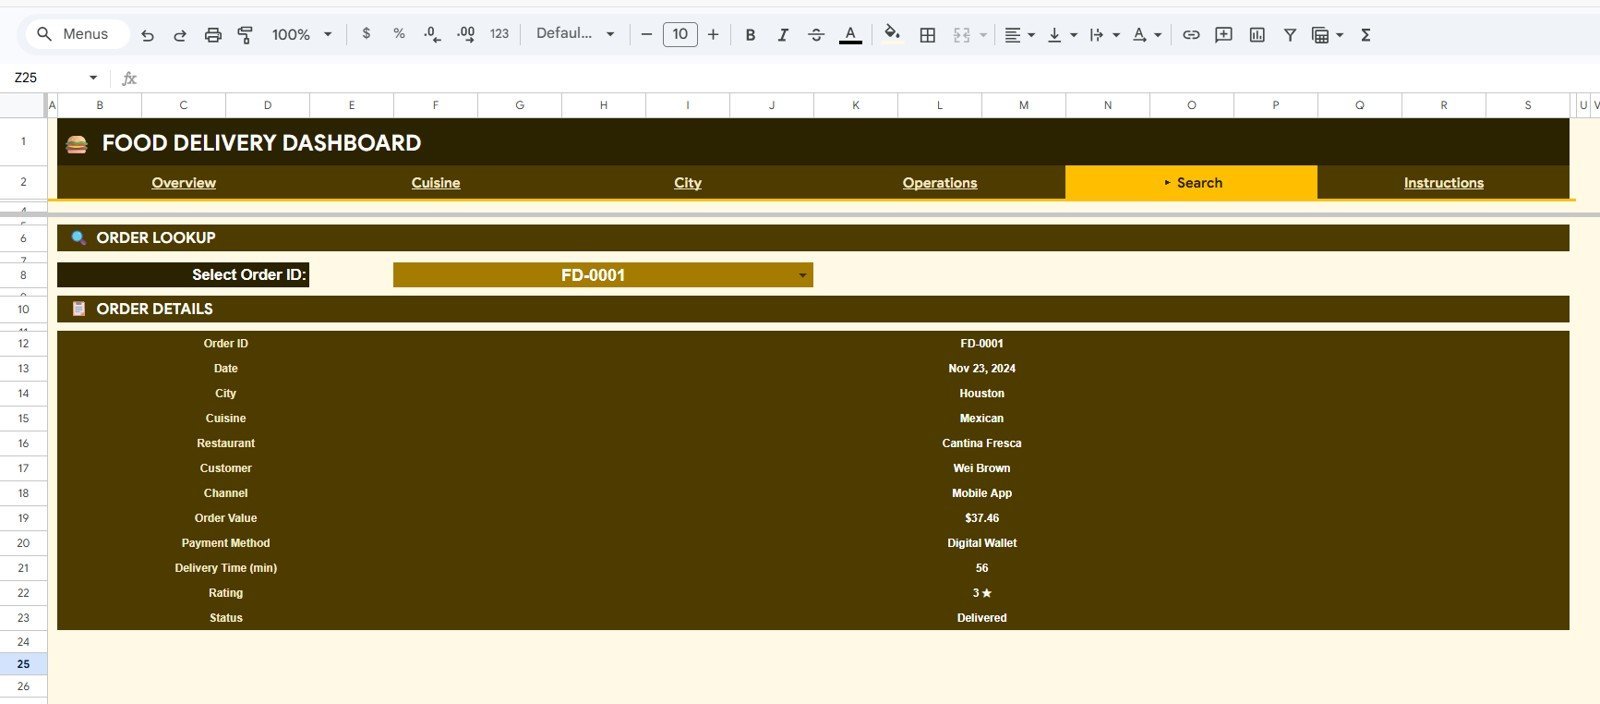
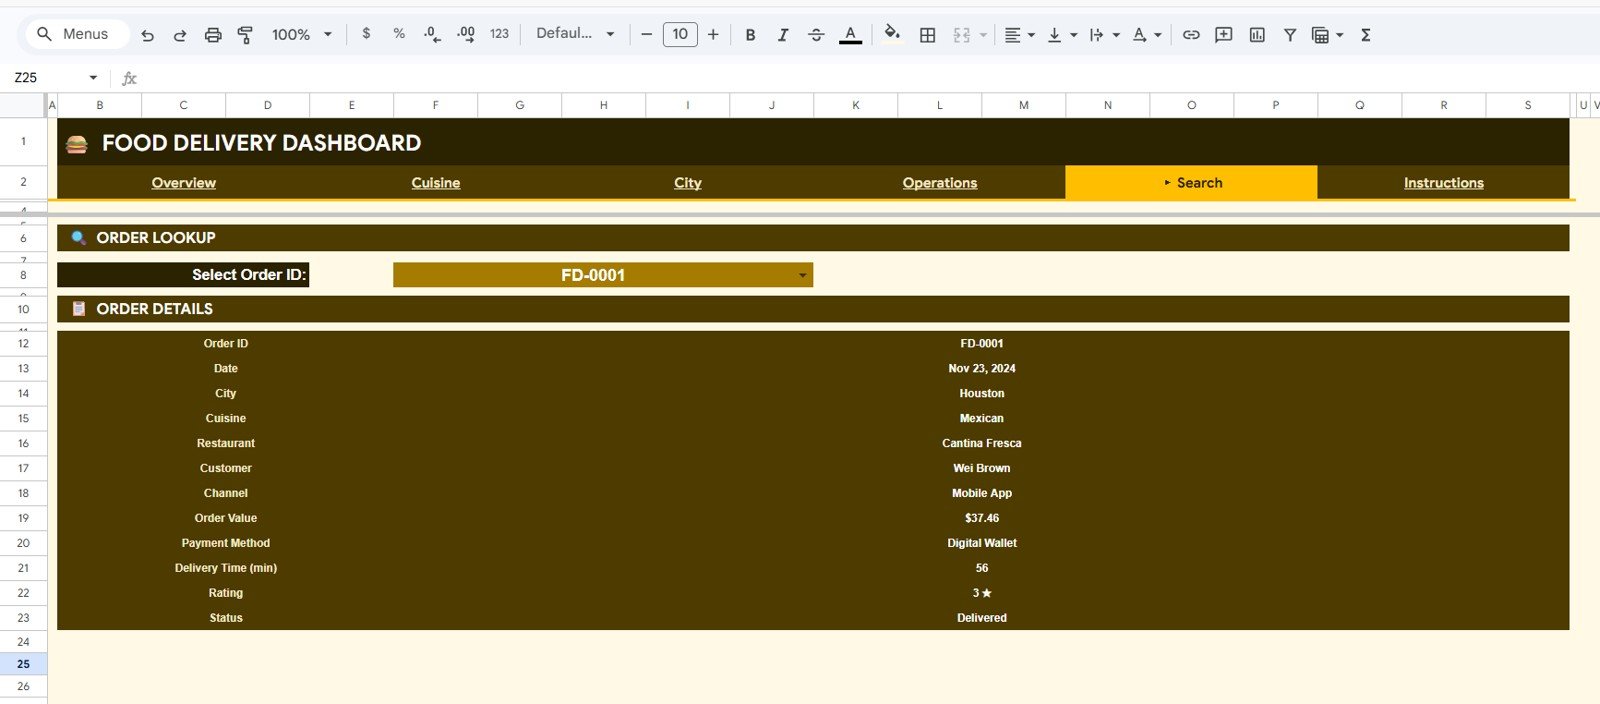
The Search sheet lets you look up any single order instantly. Select an Order ID from the dropdown and all the details appear at once — date, city, cuisine, restaurant, customer, channel, order value, payment method, delivery time, rating, and status.
Search Sheet tab
Data Sheet
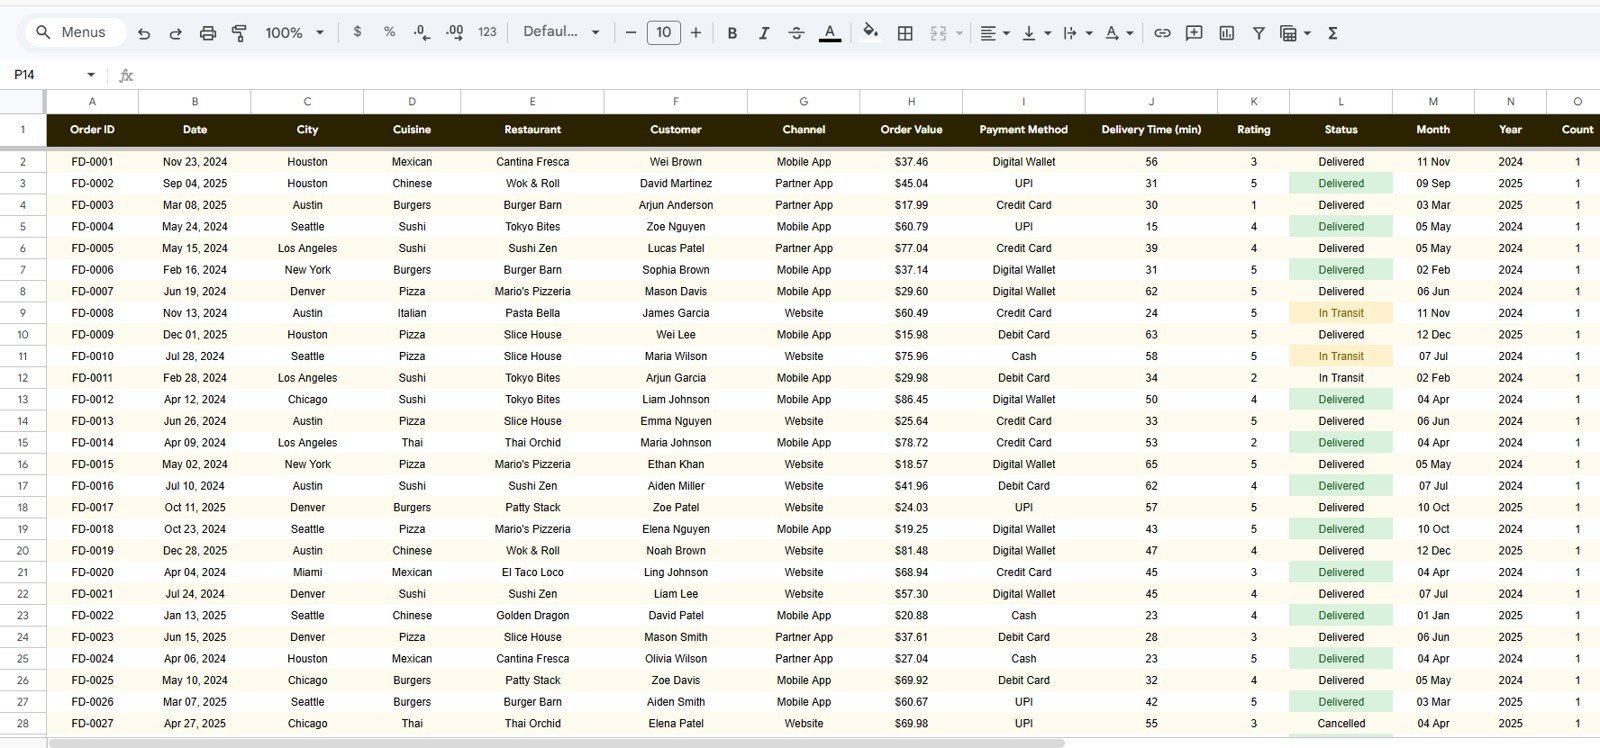
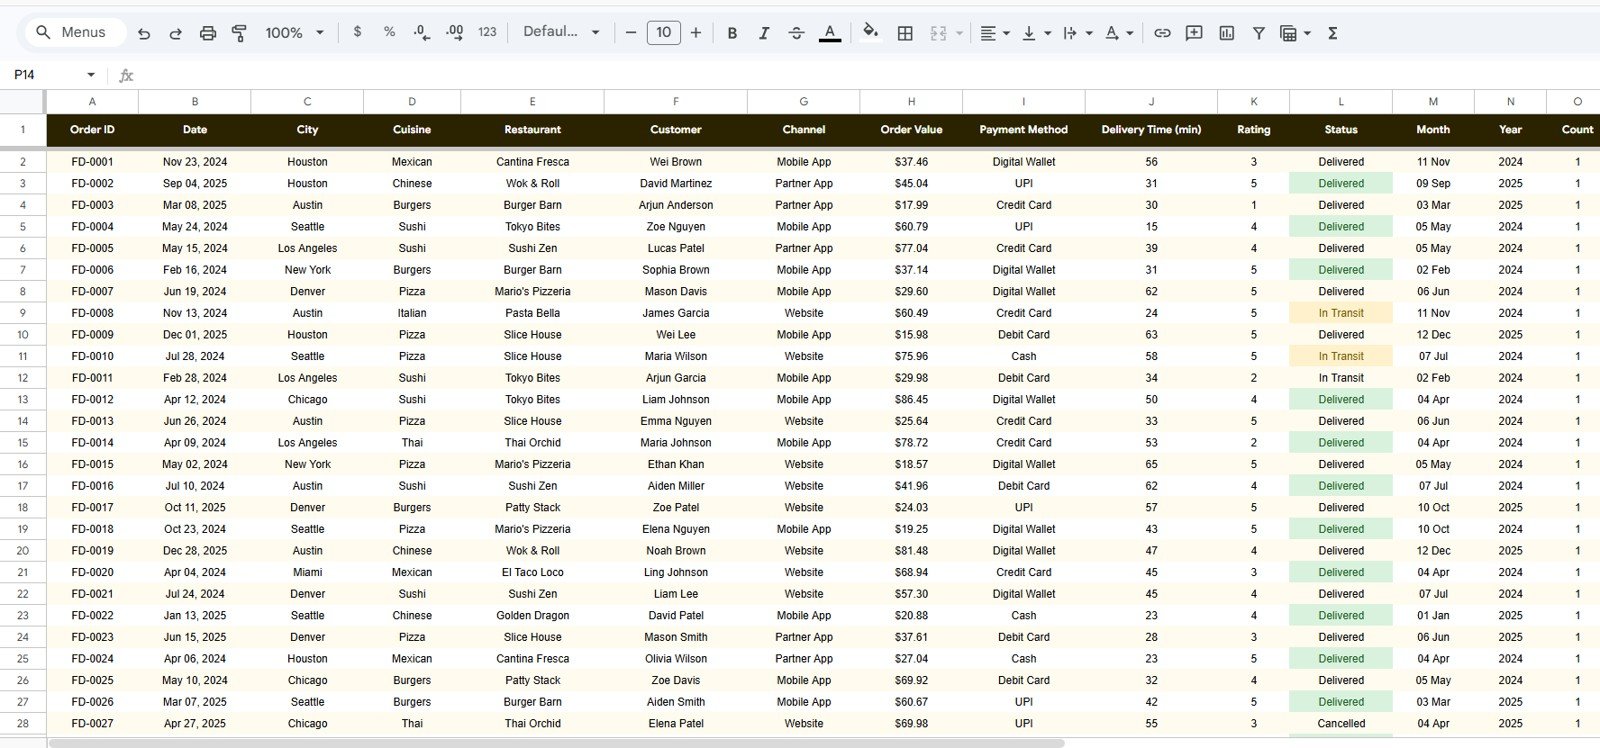
This is the Data sheet, where you add your orders in the same column format as the sample rows. Every KPI card, chart, and search result reads from this sheet, so keeping it clean and consistent keeps the whole dashboard accurate.
Data Sheet tab
📊 Food Delivery Dashboard: Google Sheets vs. Excel vs. Restaurant Analytics SaaS — Where This Fits
| Feature | Food Delivery Dashboard (Google Sheets) | Microsoft Excel Dashboard | Restaurant Analytics SaaS (Toast / Lighthouse) |
|---|---|---|---|
| Cost | $9.99 one-time | $17.99 one-time | $69–$300 / month |
| Platform | Google Sheets (browser) | Desktop Excel | Vendor cloud + POS lock-in |
| Setup time | Under 10 minutes ✅ | Under 10 minutes ✅ | Days to onboard |
| Real-time team collaboration | Yes, shared link ✅ | Limited | Yes ✅ |
| Mobile access | Yes, Sheets app ✅ | Limited | Yes ✅ |
| Slicer filters | Yes ✅ | Yes ✅ | Yes ✅ |
| Single-order search | Yes, built-in ✅ | Yes ✅ | Yes ✅ |
| Own your data | Yes, your Drive ✅ | Yes ✅ | No, vendor-hosted |
| Year-1 cost at 5 users | $9.99 ✅ | $17.99 | $4,000+ |
For food delivery operators who want live cuisine, city, and operations analytics without paying four figures a year for a SaaS suite, the Food Delivery Dashboard in Google Sheets sits in the sweet spot.
👥 Who This Template Is For — and Who It’s Not For
✅ This template is built for:
- Cloud kitchens and delivery-first restaurants tracking revenue and orders across cuisines and cities
- Restaurant owners and managers who want one shared dashboard the whole team can open on any device
- Operations and analytics staff who need fast filtering by status, channel, payment method, and rating
- Franchise and multi-location food businesses comparing performance across zones
❌ This template is NOT for:
- Teams that need a live POS integration with automatic order syncing — this reads from a Data sheet you maintain
- Enterprises requiring SSO, audit logs, or role-based access controls
- Users who want full profit-and-loss accounting — see the Restaurant P&L Dashboard instead
⚙️ How to Use the Food Delivery Dashboard in Google Sheets
- Open the PDF in your download and click the Google Sheets copy link to create your own editable copy in Google Drive.
- Go to the Data sheet and replace the sample rows with your own orders, keeping the same column order.
- Open the Overview page — KPI cards and charts refresh automatically from your data.
- Use the slicers on each analysis page to filter by cuisine, city, status, channel, or payment method.
- Open the Search sheet and pick an Order ID to view every detail for that single order.
💼 Real-World Use Cases
Aisha runs a cloud kitchen with three cuisines. She uses the Food Delivery Dashboard in Google Sheets to see Revenue by Cuisine each week, spot which menu is slipping, and reallocate her ad budget — without paying $200 a month for restaurant BI software.
Marco manages delivery for a five-city chain. He filters the City Analysis page by location to compare Average Order Value and Average Delivery Time, then shares the link with each city manager so everyone sees the same numbers.
Priya handles customer experience for a delivery brand. She watches Orders by Rating and Orders by Status on the Operations page, catches a spike in cancellations in one zone, and fixes the handoff before it hurts repeat orders.
❓ Frequently Asked Questions
What KPIs does the Food Delivery Dashboard in Google Sheets track?
The Food Delivery Dashboard in Google Sheets tracks 4 headline KPIs — Total Revenue, Total Orders, Average Order Value, and Average Rating — plus 17 charts covering cuisine, city, operations, and monthly trends. All metrics update automatically when you replace the sample data.
How long does setup take?
Setup takes under 10 minutes. You make your own copy from the included link, paste your orders into the Data sheet using the same columns as the sample, and every KPI card, chart, and search result in the Food Delivery Dashboard recalculates on its own.
Do I need any add-ons or Apps Script to use it?
No. The Food Delivery Dashboard in Google Sheets is 100% native Google Sheets — no add-ons, no Apps Script permissions, and no installation. It works in any browser and on the Google Sheets mobile app.
How does this compare to restaurant analytics SaaS like Toast?
Restaurant analytics SaaS tools run $69–$300 a month and lock your data into a vendor cloud. The Food Delivery Dashboard in Google Sheets is a one-time $9.99 purchase, keeps the data in your own Drive, and gives you cuisine, city, and operations analytics with slicer filters.
Can I add my own cuisines, cities, and channels?
Yes. Just type your own values into the Data sheet — the charts and slicers in the Food Delivery Dashboard read directly from that sheet, so new cuisines, cities, channels, and payment methods appear automatically with no setup.
Can my team use it at the same time?
Yes. Because the Food Delivery Dashboard in Google Sheets lives in Google Drive, you share one link and your whole team can view or edit it together in real time on desktop or mobile.
👤 About the Author
Built by PK — Microsoft Certified Professional with 15+ years of Excel, Google Sheets, and Power BI experience. Founder of NextGenTemplates, reaching 300K+ subscribers across YouTube channels (@PK-AnExcelExpert, @NextGenTemplates, @NeoTechNavigators). Every template is hand-built and tested before release.
🔗 Explore Related Templates
If you run a food or restaurant business, these pair well with this dashboard:
- Food Truck Dashboard in Google Sheets — sales and location analytics for mobile food vendors.
- Restaurant P&L Dashboard in Google Sheets — full profit-and-loss tracking for dine-in and delivery.
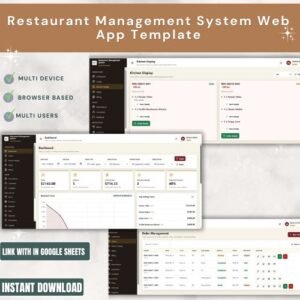
- Restaurant Management System Web App — a multi-user system for orders, menu, and billing.
Also available as: Food Delivery Dashboard in Excel for teams that prefer Microsoft Excel.
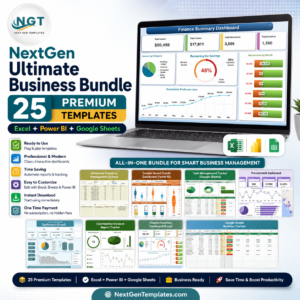
💎 Save more with a bundle: get this and 24 other premium templates in the NextGen Ultimate Business Bundle.
📖 Click here to read the Detailed Blog Post
Watch the step-by-step video Demo:
🎥 Visit our YouTube channel for step-by-step video tutorials
👉 YouTube.com/@NextGenTemplates