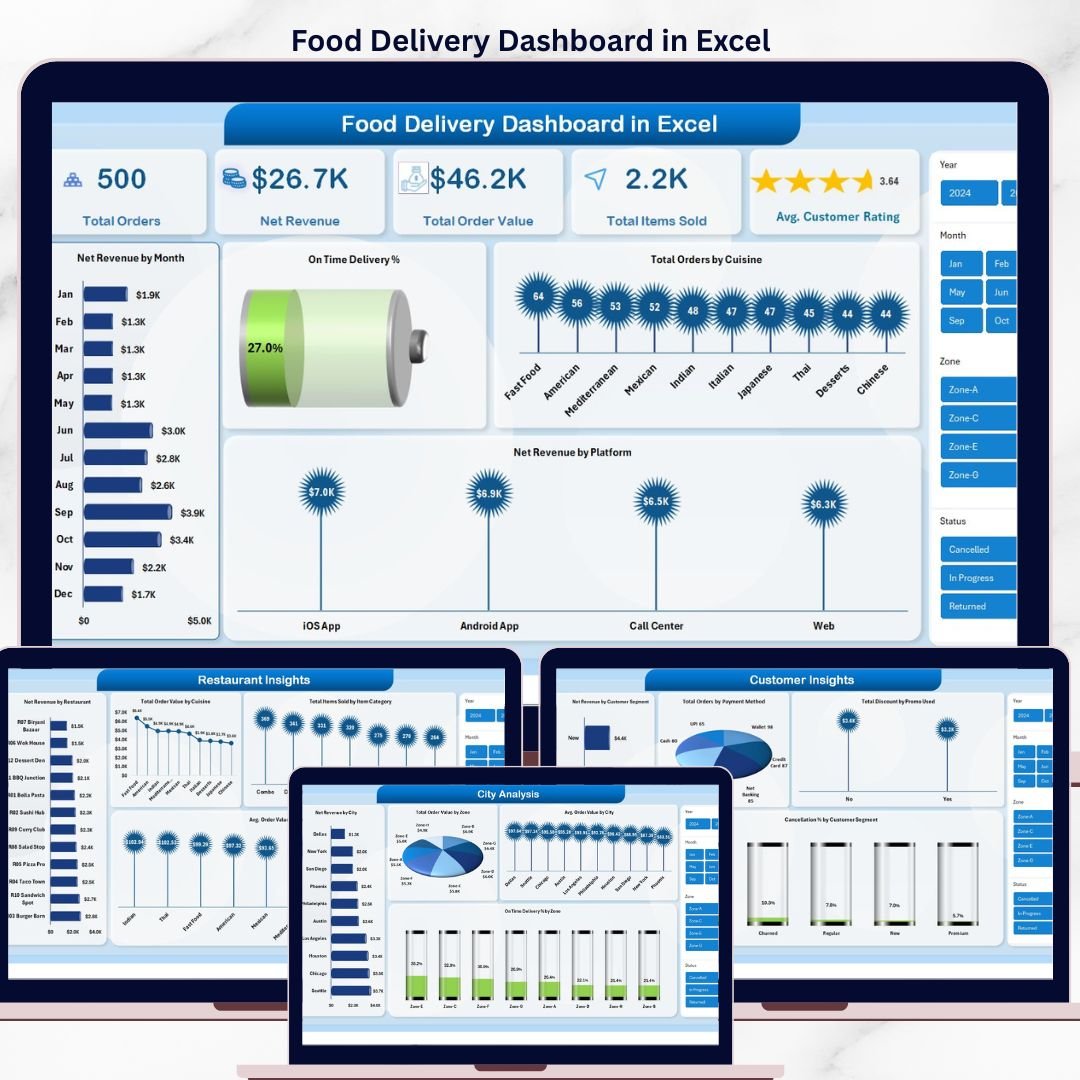


The Food Delivery Dashboard in Excel is a ready-to-use, plug-and-play analytics template built for cloud kitchen owners, multi-restaurant aggregators, and food delivery operations managers who want a single view of orders, revenue, riders, cuisines, cities, and customer behaviour — without paying for a SaaS POS subscription. Just paste your daily order export into the Data sheet, hit Refresh All, and the entire 5-page dashboard updates automatically through pivot tables and slicers.
This Excel Food Delivery Dashboard covers everything an aggregator needs to run weekly performance reviews: total orders, net revenue, average customer rating, on-time delivery percentage, rider tip leaderboards, cuisine-level profitability, zone-wise delivery time, and customer segment cancellation analysis. Whether you operate a single ghost kitchen or coordinate 50+ restaurants across multiple cities, this Food Delivery KPI Dashboard Excel template scales with your data.
What is the Food Delivery Dashboard in Excel?
The Food Delivery Dashboard in Excel is a 7-sheet analytics workbook that turns raw order-level data into an interactive performance dashboard. It uses native Excel pivot tables, pivot charts, slicers, and KPI cards — no add-ins, no macros, no Power Query required. The template is fully Mac and Windows compatible and works in Excel 2016, 2019, 2021, 365, and Excel for the Web.
Unlike rigid SaaS dashboards (Toast, Square for Restaurants, Lightspeed), this Excel template gives you full ownership of your data, unlimited customisation, and zero recurring fees. Add your own KPIs, change the colour scheme, plug in extra cuisines or cities — it’s your file forever.
Food Delivery Dashboard in Excel vs Google Sheets vs SaaS POS — Which One Should You Pick?
| Feature | Food Delivery Dashboard in Excel (this template) | Google Sheets Equivalent | Toast / Square / Lightspeed POS |
|---|---|---|---|
| One-time price | $17.99 (sale) | $9.99 | $69 – $399 / month |
| Recurring fees | None | None | $828 – $4,788 / year |
| Works offline | Yes | No (cloud only) | No (cloud only) |
| Pivot tables & slicers | Native & fast | Limited | Locked / non-customisable |
| Custom KPIs | Unlimited | Unlimited | Restricted to vendor templates |
| Data ownership | 100% yours (local file) | Google account | Vendor servers |
| Setup time | 10 minutes | 15 minutes | 2 – 6 weeks |
| Multi-restaurant aggregation | Yes — any number of restaurants | Yes | Per-location licence |
| Best for | Cloud kitchens, aggregators, ops analysts | Lean startups, freelancers | Large chains with POS integration |
Key Features of the Food Delivery Dashboard in Excel
- 5 fully-interactive analytics pages plus a Data sheet and Support sheet
- Slicers on every page for one-click filtering by city, cuisine, platform, rider, payment method, and date
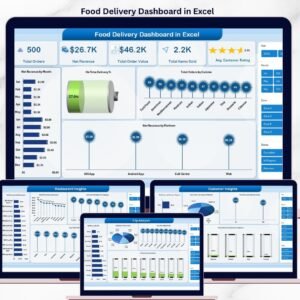
- 5 high-level KPI cards on the Overview page: Total Orders, Net Revenue, Total Order Value, Total Items Sold, Average Customer Rating
- 20+ pivot-driven charts covering revenue, delivery time, cuisine performance, rider tips, customer segments, and cancellations
- Pivot table engine on the Support sheet — refresh once, and every chart on every page updates instantly
- Sample dataset included so you can explore the dashboard before adding your own data
- Works on Excel 2016, 2019, 2021, Microsoft 365, and Excel for Mac
- Fully unlocked — no protected sheets, no hidden formulas, no macros
- Print-ready and presentation-ready layout for management reviews
Who Is This Food Delivery Dashboard For?
- Cloud kitchen and ghost kitchen owners who need to track multi-brand performance from a single Excel file
- Multi-restaurant aggregator managers handling 5 – 200 restaurants across cities and platforms (Zomato, Swiggy, Uber Eats, DoorDash)
- Food delivery operations analysts reporting on rider efficiency, on-time delivery, and zone profitability
- QSR (quick service restaurant) franchise owners tracking delivery channel performance vs dine-in
- Food & beverage MBA students and consultants building a portfolio case study
Who Is This Dashboard NOT For?
- Restaurants that need real-time live order tracking — this is a reporting dashboard, not a POS system
- Teams that don’t use Excel or Google Sheets at all
- Operators who need API-level integration with Zomato/Swiggy — this template imports CSV exports manually
- Single-outlet dine-in restaurants with no delivery channel — see our Restaurant P&L Dashboard in Excel instead
Inside the Food Delivery Dashboard — Page-by-Page Walkthrough
1. Overview Page
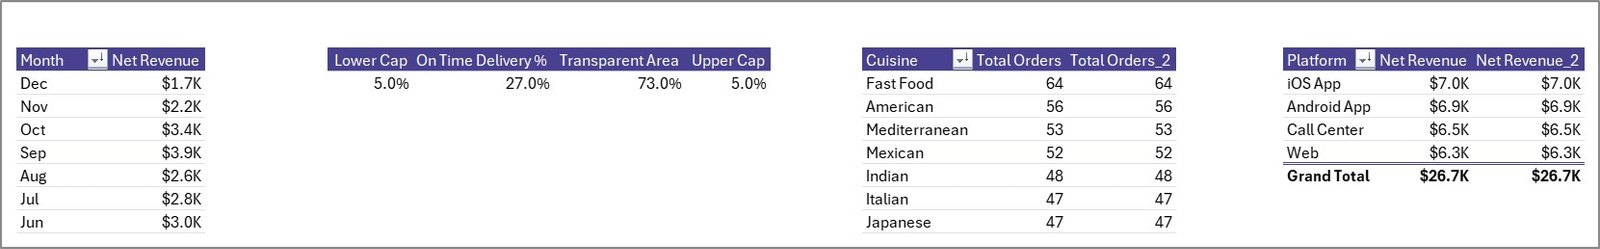
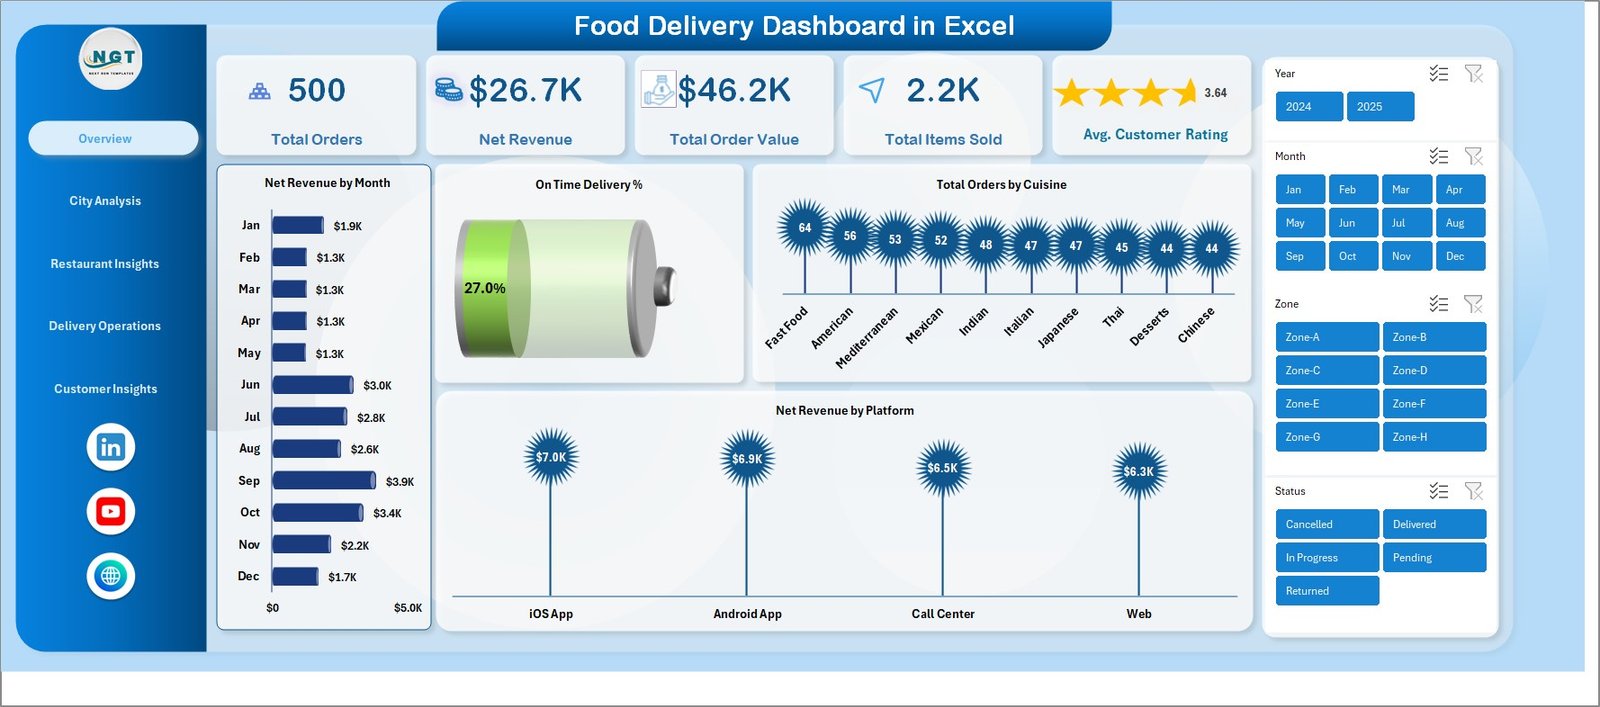
The Overview page is your daily command centre. At the top sit five KPI cards — Total Orders, Net Revenue, Total Order Value, Total Items Sold, and Average Customer Rating — each driven by pivot table SUM and AVERAGE measures so the numbers respond instantly to slicer selections.
Four interactive charts complete the page:
- Net Revenue by Month — a column chart that reveals revenue seasonality and month-over-month growth, useful for spotting weekend dip patterns and festival spikes.
- On Time Delivery % — a doughnut/pie visual showing the percentage of orders delivered within the SLA window, a critical operational health metric.
- Total Orders by Cuisine — a horizontal bar chart ranking cuisines from highest to lowest order volume, helping merchandisers prioritise menu visibility.
- Net Revenue by Platform — compares net revenue from Zomato, Swiggy, Uber Eats, DoorDash, or your own ordering app at a glance.
Overview Page
2. City Analysis
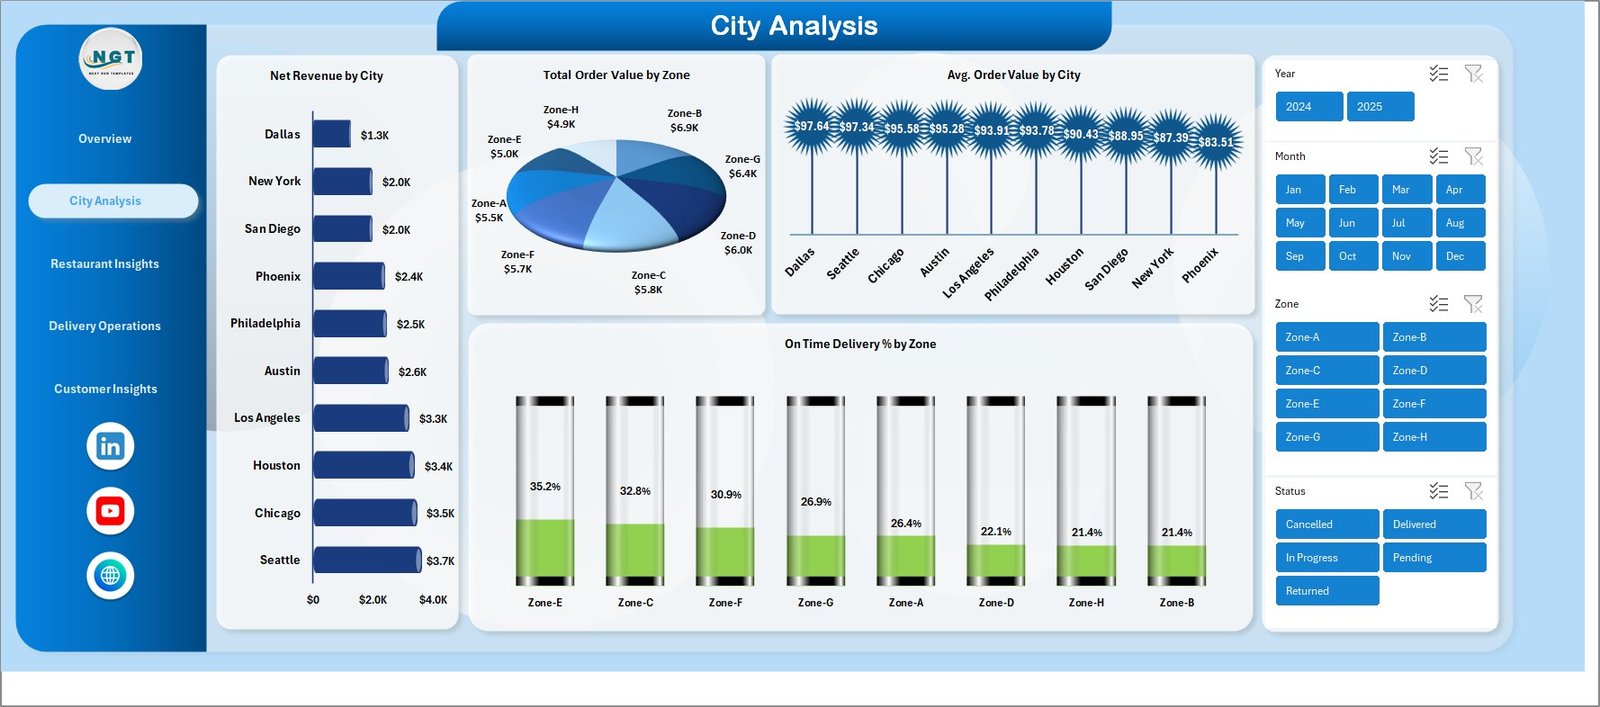
The City Analysis page lets you compare performance across delivery cities and zones. Charts on this page include Net Revenue by City (where revenue is concentrated), Total Order Value by Zone (which zones have higher AOV), Avg. Order Value by City (city-level pricing power), and On Time Delivery % by Zone (which zones struggle with delivery SLA).
City Analysis
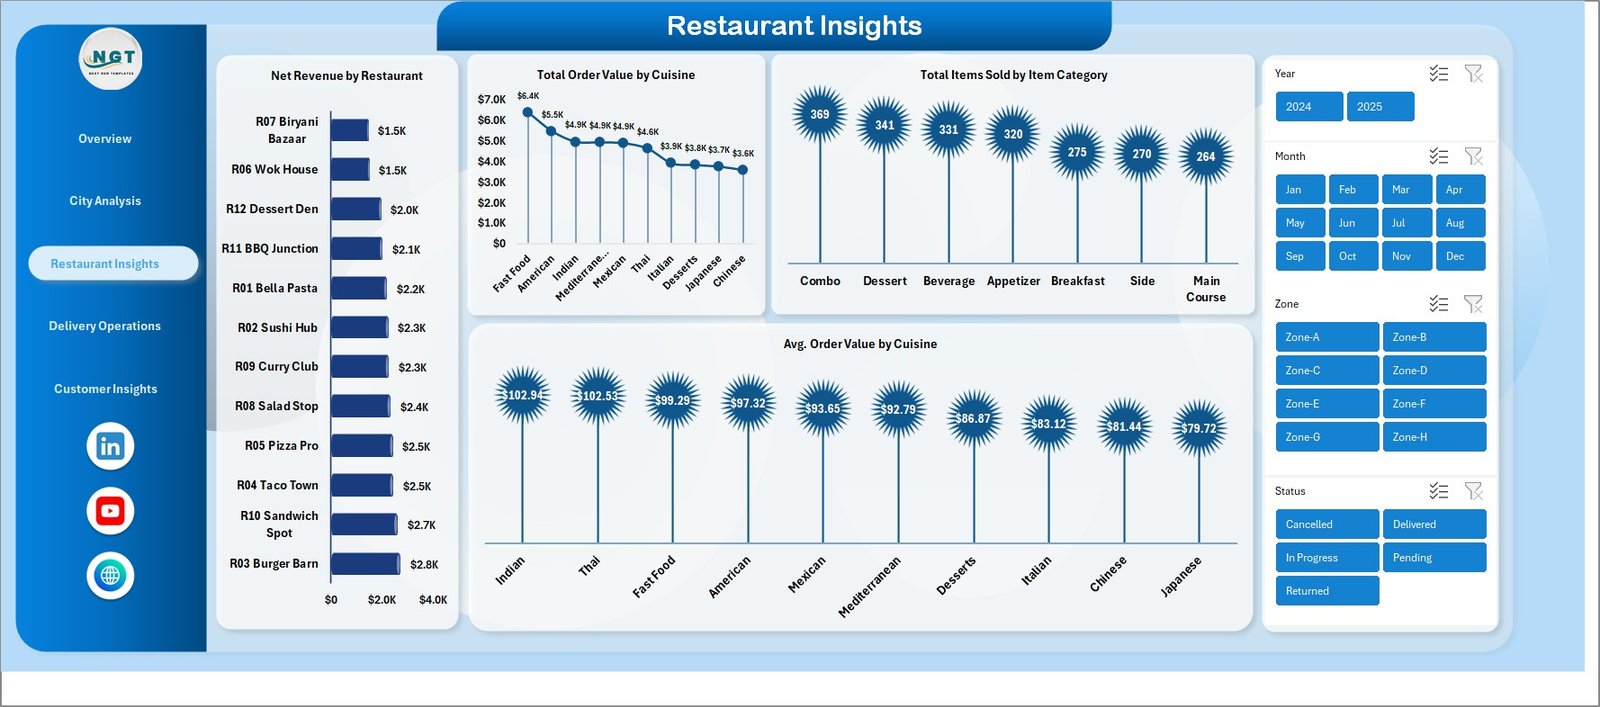
3. Restaurant Insights
This page focuses on restaurant-level and cuisine-level profitability. The four charts show Net Revenue by Restaurant (top performers and laggards), Total Order Value by Cuisine (which cuisines drive gross sales), Total Items Sold by Item Category (mains vs sides vs beverages), and Avg. Order Value by Cuisine (premium vs value cuisines). Aggregator managers use this page weekly to renegotiate commission terms with under-performing restaurants.

Restaurant Insights
4. Delivery Operations
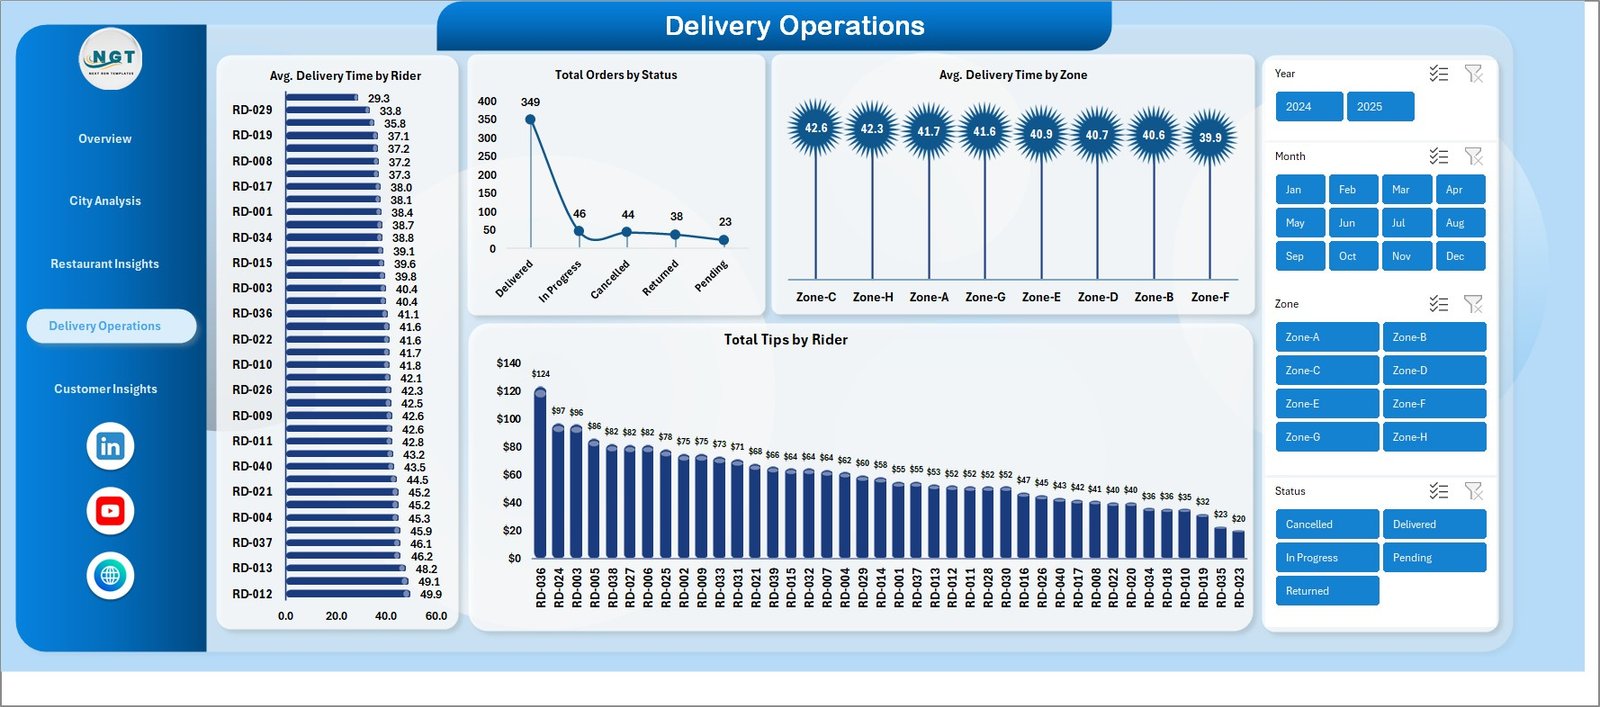
The Delivery Operations page is the rider performance and SLA monitoring page. Charts include Avg. Delivery Time by Rider (rider-level efficiency), Total Orders by Status (Delivered, Cancelled, Returned, Out for Delivery), Avg. Delivery Time by Zone (which delivery zones cause delays), and Total Tips by Rider (a customer-satisfaction proxy and a fairness check for incentive payouts).
Delivery Operations
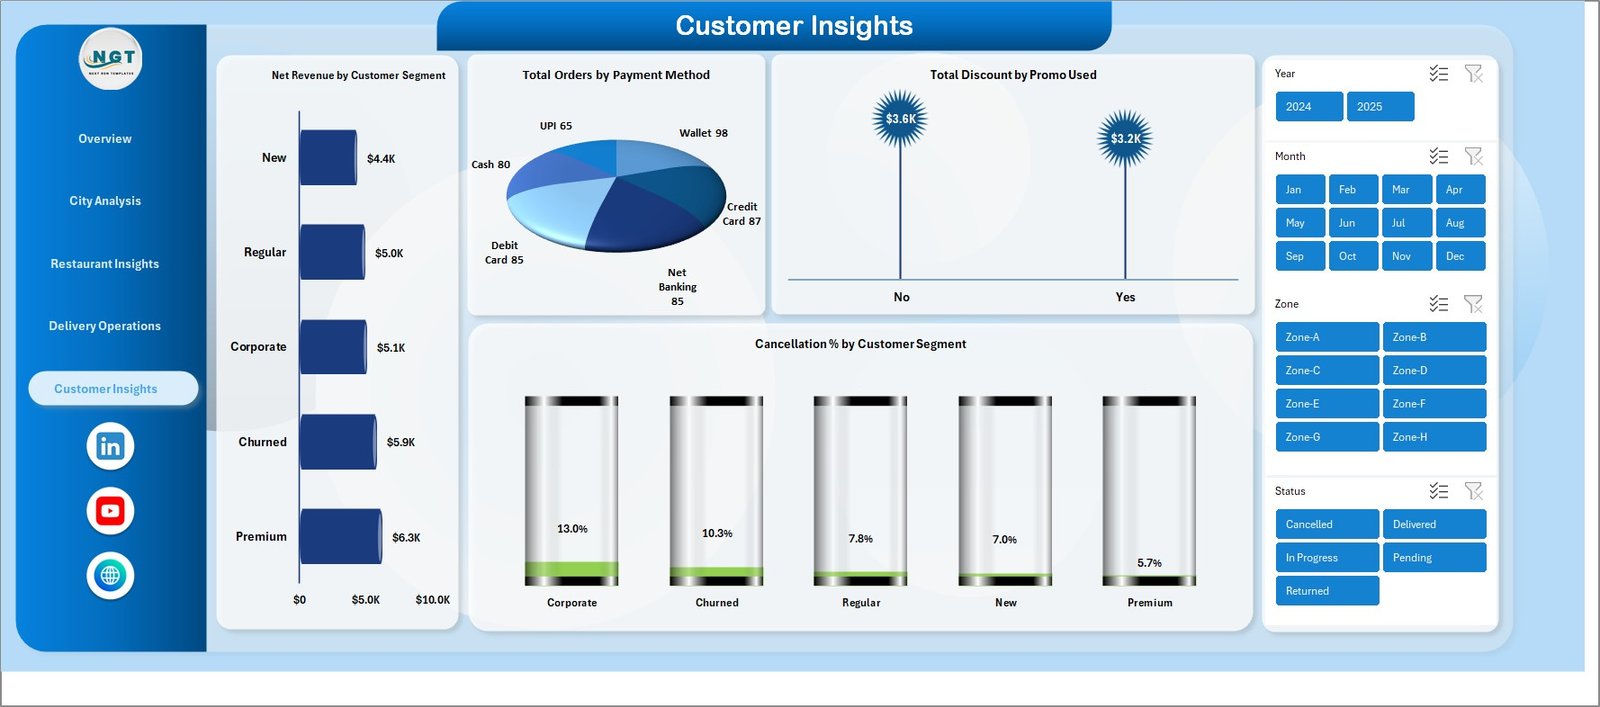
5. Customer Insights
The Customer Insights page surfaces customer behaviour patterns. The four charts cover Net Revenue by Customer Segment (New, Repeat, VIP, At-Risk), Total Orders by Payment Method (UPI, Card, Cash, Wallet), Total Discount by Promo Used (which promo codes are eating margin), and Cancellation % by Customer Segment (which segments are unprofitable to acquire). This page is the go-to view for marketing and CRM teams.

Customer Insights
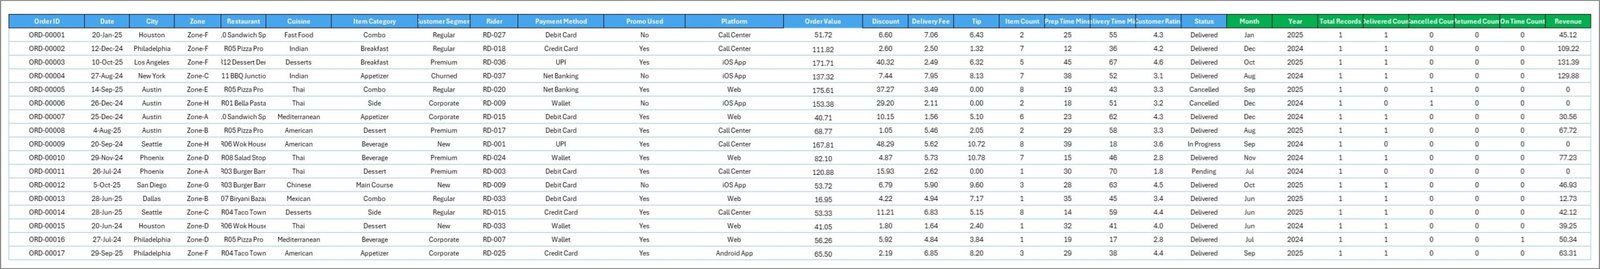
6. Data Sheet
The Data Sheet is the input layer. Just paste your order-level export from Zomato, Swiggy, Uber Eats, DoorDash, or your own ordering platform into the same column structure — Order ID, Date, City, Zone, Restaurant, Cuisine, Item Category, Items Sold, Order Value, Discount, Net Revenue, Platform, Payment Method, Customer Segment, Promo Used, Rider, Delivery Time, Order Status, Customer Rating. The dashboard handles any number of rows.

Data Sheet tab
7. Support Sheet (Pivot Engine)
The Support Sheet is where every pivot table that powers the dashboard lives. After you update the Data Sheet, go to the Data tab in the Excel ribbon and click Refresh All — every pivot table on this sheet refreshes, and every chart and KPI card on the dashboard pages updates automatically. You can keep this sheet hidden once the dashboard is live for end users.

Support sheet tab
How to Use the Food Delivery Dashboard in Excel
- Download and unzip the template file from your purchase confirmation email.
- Open the file in Microsoft Excel (2016 or later) or Excel for Mac. Enable editing if prompted.
- Go to the Data sheet and replace the sample rows with your own order-level data. Keep the column headers exactly as they are.
- Click on any pivot table in the Support sheet, then go to Data → Refresh All in the ribbon. Alternatively, press Ctrl+Alt+F5 on Windows or Cmd+Option+R on Mac.
- Use the slicers at the top of each page to filter by city, cuisine, platform, payment method, or date range. The KPI cards and charts update in real time.
- Hide the Support Sheet (right-click the tab → Hide) before sharing the file with stakeholders.
- Save and share the file as .xlsx, or export individual pages as PDF for management reports.
Real-World Use Cases
Use Case 1 — Priya, Cloud Kitchen Owner in Bangalore
Priya runs a 4-brand cloud kitchen (Indian, Chinese, Healthy Bowls, Desserts) selling on Zomato and Swiggy. Every Monday morning she downloads the previous week’s order export from both platforms, pastes them into the Data sheet, hits Refresh All, and uses the City Analysis page to spot which Bangalore zones drove the most revenue and which had the worst on-time delivery. She uses the Restaurant Insights page to decide which brand to push in Friday-night promotions. Saves her about 3 hours of manual reporting every Monday.
Use Case 2 — Rohit, Operations Manager at a Food Aggregator (Tier-2 Cities)
Rohit manages 80+ partner restaurants across 6 Tier-2 cities. He uses the Delivery Operations page weekly to identify which riders are consistently slow (Avg. Delivery Time by Rider) and which zones need more rider supply (Avg. Delivery Time by Zone). The Total Tips by Rider chart helps him spot top performers for the monthly rider-of-the-month award. The Customer Insights page tells him which payment methods to push (UPI vs Cash) and which customer segments are too cancellation-heavy to keep paying acquisition costs for.
Use Case 3 — Anjali, Food & Beverage Strategy Analyst
Anjali is a strategy consultant working on a regional QSR’s delivery channel performance review. She loads 6 months of order data into the Data sheet and uses the Overview page to present month-on-month revenue trends to the client. The Restaurant Insights and Customer Insights pages give her the cuisine-mix and segment-mix slides she needs for her board deck. She values that the dashboard is a single Excel file she can email and a non-technical CFO can open and explore on their own.
Frequently Asked Questions
Q1. Will this Food Delivery Dashboard work on Excel for Mac?
Yes. The template uses only native Excel features (pivot tables, slicers, pivot charts) that are fully supported on Excel for Mac (2016 onwards) and on Microsoft 365 for Mac. There are no VBA macros, no Power Query, and no platform-specific features.
Q2. How many orders or rows can the dashboard handle?
The dashboard has been tested with up to 100,000 order rows. Excel can technically handle over 1 million rows on a single sheet, but performance depends on your machine’s RAM. For typical cloud kitchen and aggregator use cases (1,000 – 50,000 orders/month), the dashboard refreshes in 1 – 5 seconds.
Q3. Can I add my own KPIs or change the chart colours?
Absolutely. The template is completely unlocked. You can add new KPI cards by inserting a pivot table on the Support sheet and linking a cell on the Overview page to it. Chart colours can be changed via Excel’s standard Chart Design ribbon.
Q4. Does this template integrate directly with Zomato, Swiggy, Uber Eats, or DoorDash APIs?
No — this is a pure Excel template. You export your order data as CSV from your aggregator’s merchant portal (every major platform supports this) and paste it into the Data sheet. For an API-driven solution you’ll need a custom Power BI or Power Query setup, which is outside the scope of this template.
Q5. Is this a one-time purchase or a subscription?
One-time purchase. Pay $17.99 once, download the file forever, no recurring fees, no “seats”, no usage caps. Use it on as many computers and projects as you want.
Q6. Can I use this dashboard for my consulting client work?
Yes — the template is licensed for both personal and commercial use. You can customise it, rebrand it, and use it inside client engagements. You may not, however, resell the template itself as a standalone product.
Q7. What if I need help setting it up?
The download includes a sample dataset and a step-by-step usage guide. We also publish video tutorials on the PK – An Excel Expert YouTube channel covering pivot tables, slicers, and dashboard customisation. For deeper customisation we offer a separate consulting service.
Related Food & Restaurant Dashboards You May Also Like
- Restaurant P&L Dashboard in Excel — for single-outlet dine-in restaurants tracking food cost, labour cost, and net profit
- Food Truck Dashboard in Excel — for mobile food vendors tracking daily location-based sales
- Food Truck Dashboard in Power BI — Power BI version with drill-throughs and DAX measures
- Coffee Chains Dashboard in Power BI — for cafe and coffee chain operators
- Restaurant P&L Dashboard in Google Sheets — Google Sheets version
- Browse all Excel Dashboard templates or Power BI Dashboards on NextGenTemplates.
About the Author — PK, Microsoft Certified Professional
This template is built by PK (Puneet Kumar), a Microsoft Certified Professional and the founder of NextGenTemplates.com and PK-AnExcelExpert.com. PK has over 15 years of hands-on experience designing Excel, Google Sheets, and Power BI dashboards for retail, hospitality, manufacturing, healthcare, and finance clients. PK’s YouTube channels — @PK-AnExcelExpert, @NextGenTemplates, and @NeoTechNavigators — have a combined audience of 300,000+ subscribers and feature step-by-step tutorials on every dashboard sold on this site. Over 8,400 customers across 40+ countries already use templates from our library.
Read the detailed blog walkthrough on PK-AnExcelExpert: Click here to read the Detailed Blog Post.
Watch the step-by-step video tutorial:
YouTube


Reviews
There are no reviews yet.