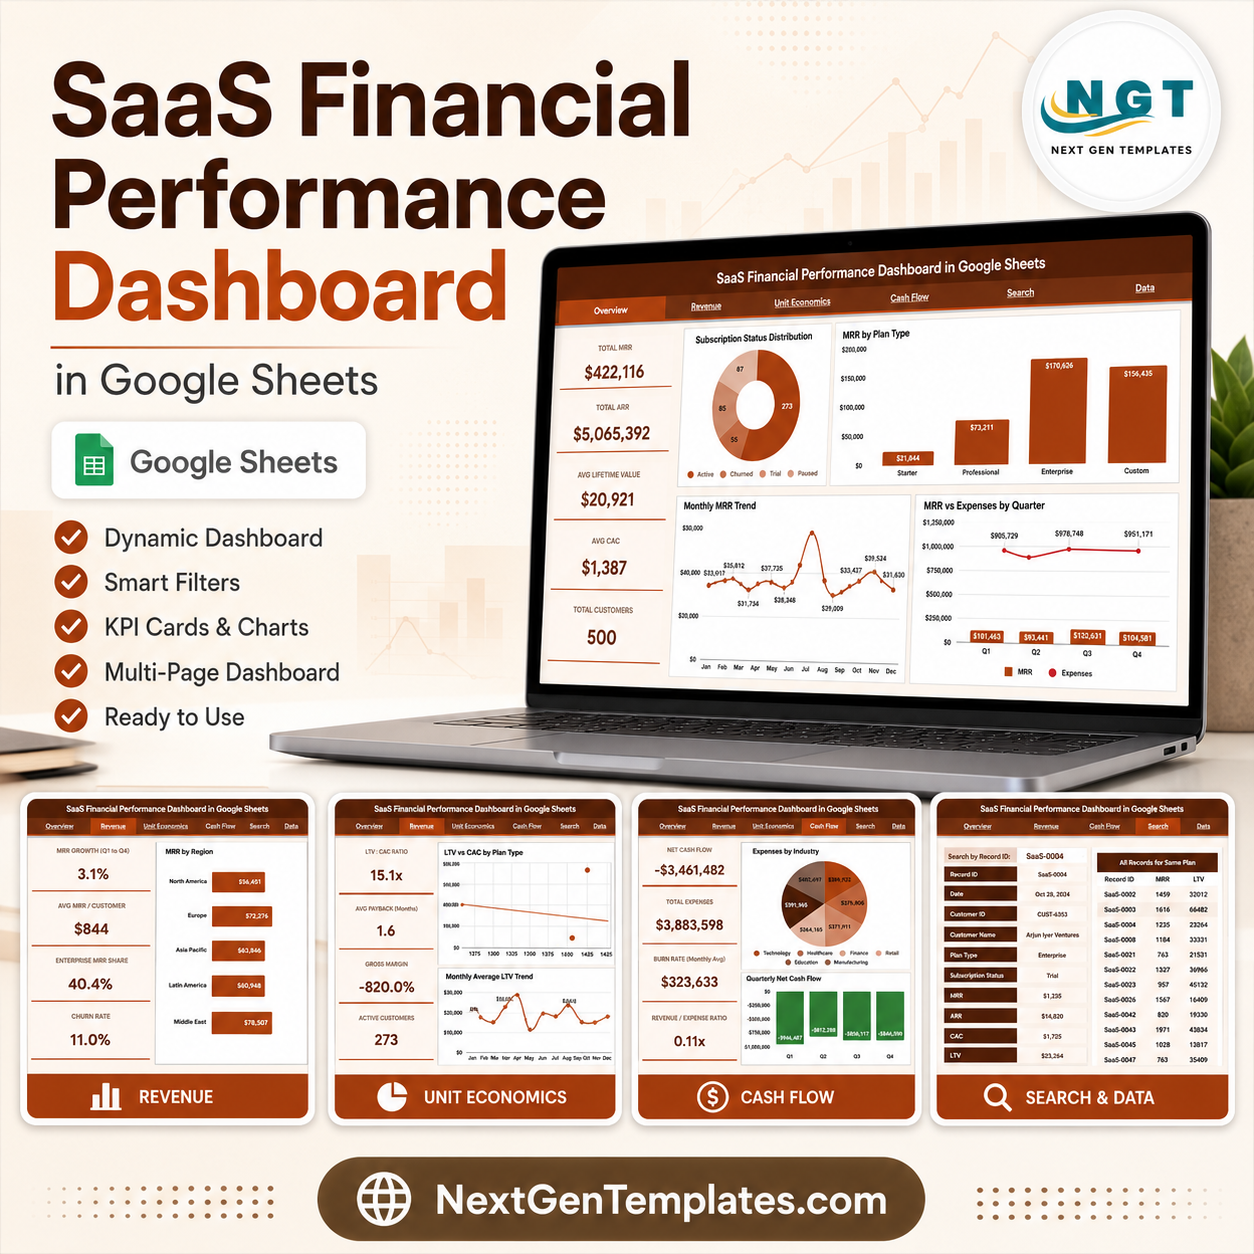


The SaaS Financial Performance Dashboard in Google Sheets tracks 5 executive KPIs – Total MRR, Total ARR, Average Lifetime Value, Average CAC and Total Customers – across 6 connected tabs with 14 pre-built charts and slicer filters. Setup takes under 10 minutes: replace the sample data on the Data tab and every chart, card and trend updates automatically.
🌍 Join 8,400+ teams in 40+ countries using NextGenTemplates to replace paid SaaS tools with one-time-purchase Excel, Google Sheets, Power BI and HTML templates.
✅ Instant download · One-time payment · No subscription · No per-user fees · Lifetime access
🔑 Key Features of the SaaS Financial Performance Dashboard in Google Sheets
📊 This dashboard tracks 5 headline SaaS finance KPIs – Total MRR, Total ARR, Average Lifetime Value, Average CAC and Total Customers – so your recurring-revenue health is visible in one glance on the Overview tab.
📈 It ships with 14 ready-made charts spread across four analysis tabs, covering subscription status, MRR by plan and region, ARR trend, LTV-to-CAC ratios, expenses and quarterly net cash flow.
🎛️ Slicers on the Overview tab let you filter the entire dashboard by plan type, subscription status, region and quarter, so every card and chart redraws instantly without editing a single formula.
🔎 A dedicated Search tab returns the full profile of any customer by Record ID and lists every other account on the same plan type beside it for fast cohort comparison.
☁️ Because it is built natively in Google Sheets, finance and growth teams can collaborate in real time with link sharing – no installs and no per-seat fees, unlike most financial tools that lock you into monthly billing.
📦 What’s Inside the SaaS Financial Performance Dashboard in Google Sheets
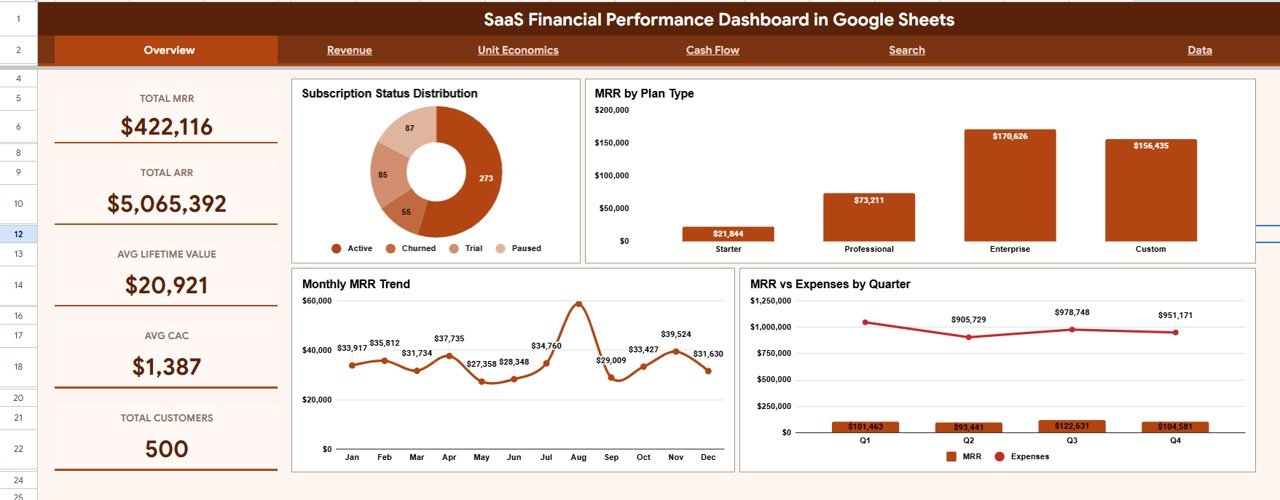
Page 1: Overview
Five KPI cards – Total MRR, Total ARR, Average Lifetime Value, Average CAC and Total Customers – sit above four charts: Subscription Status Distribution, MRR by Plan Type, Monthly MRR Trend and MRR vs Expenses by Quarter. Slicers filter every card and chart instantly.
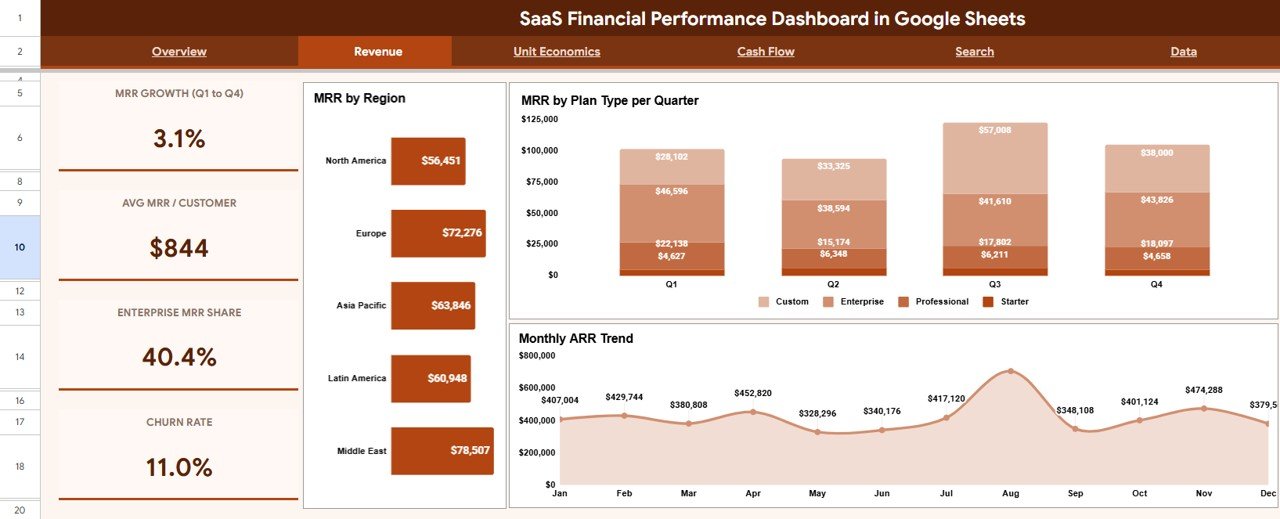
Page 2: Revenue
Three charts break recurring revenue down by source: MRR by Region, MRR by Plan Type per Quarter and Monthly ARR Trend. The tab answers which markets and plans are actually driving growth.
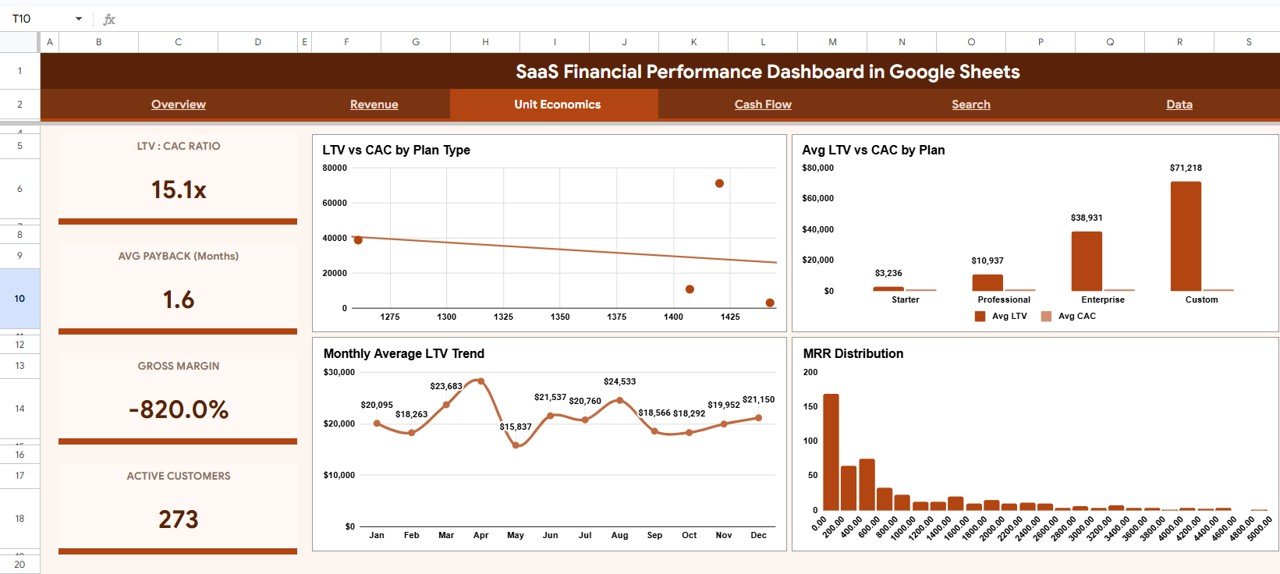
Page 3: Unit Economics
Four charts judge whether growth is healthy: LTV vs CAC by Plan Type, Average LTV vs CAC by Plan, Monthly Average LTV Trend and MRR Distribution – showing whether each plan acquires customers profitably.
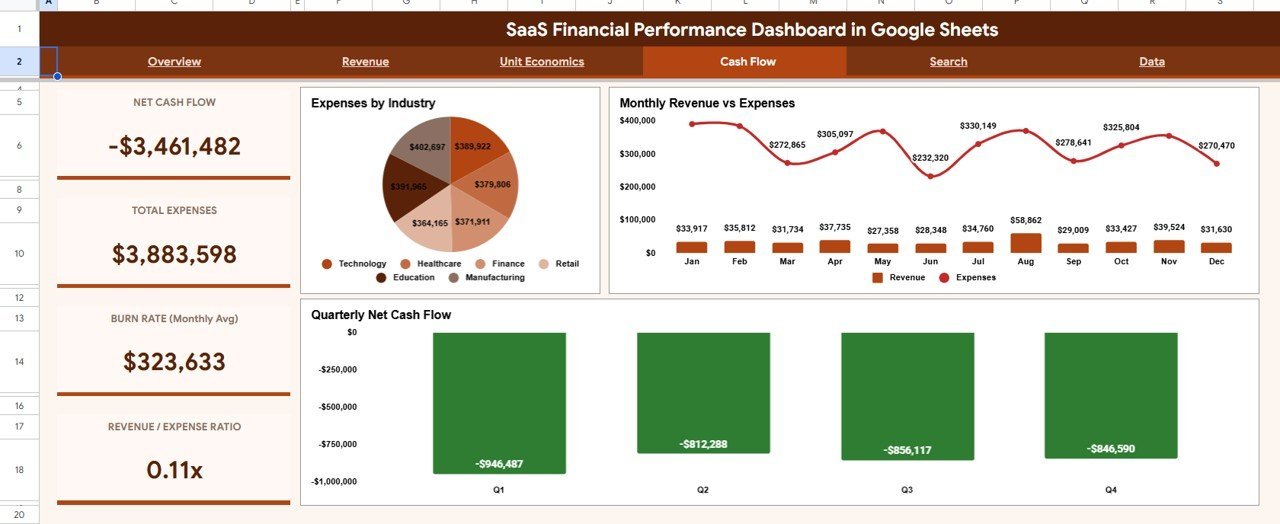
Page 4: Cash Flow
Expenses by Industry, Monthly Revenue vs Expenses and Quarterly Net Cash Flow connect revenue to spending, turning the dashboard from a vanity-metrics view into a runway-and-survival view.

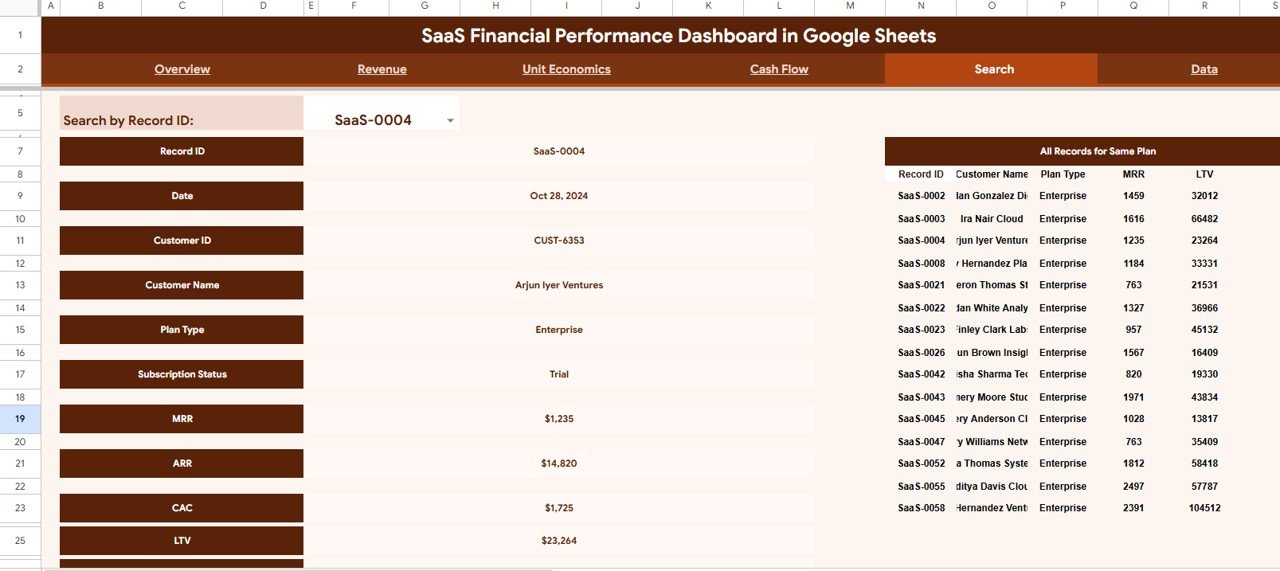
Page 5: Search
Pick any Record ID from the dropdown and the sheet returns that customer’s Date, Customer ID, Name, Plan Type, Subscription Status, MRR, ARR, CAC and LTV, while the right side lists every other record on the same plan type.
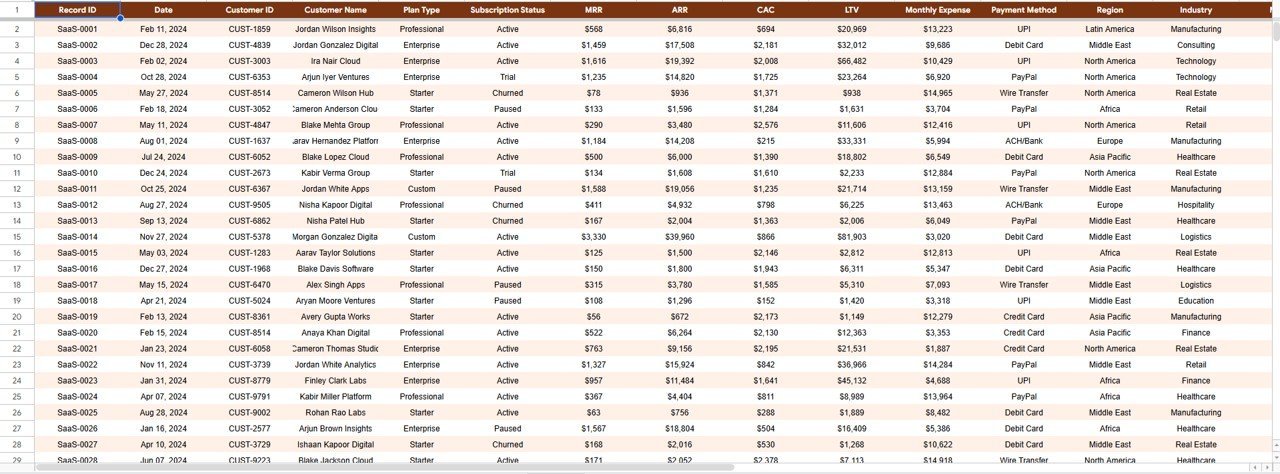
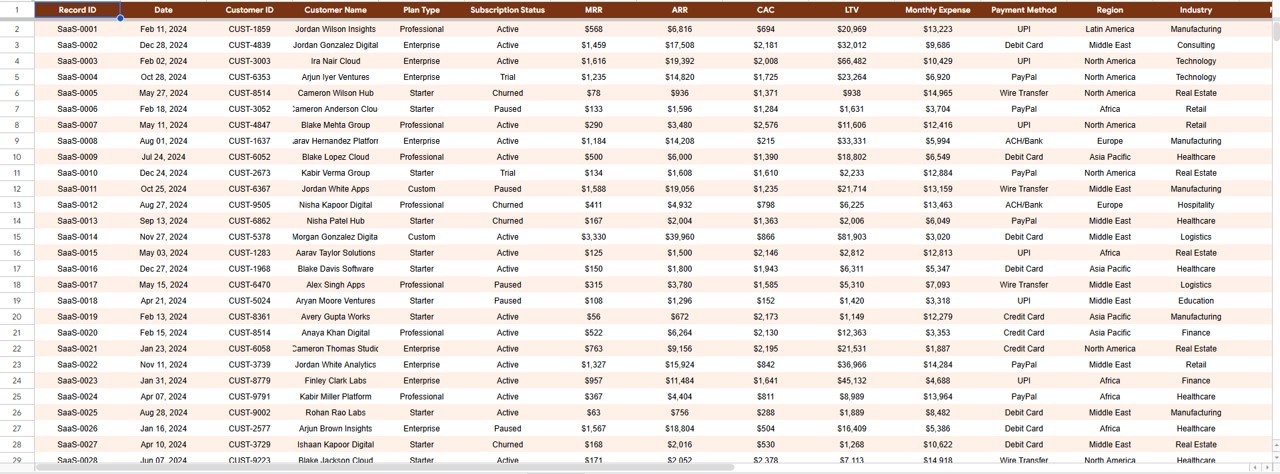
Page 6: Data Sheet
The single source of truth. Paste your subscription records here in the existing column format and every tab – Overview, Revenue, Unit Economics, Cash Flow and Search – recalculates automatically.
📊 SaaS Financial Performance Dashboard in Google Sheets vs. Microsoft Excel Dashboard vs. ChartMogul / Baremetrics – Where This Fits
| Feature | SaaS Financial Performance Dashboard in Google Sheets | Microsoft Excel Dashboard | ChartMogul / Baremetrics |
|---|---|---|---|
| Cost | $9.99 one-time | $10-25 one-time | $100-$1,000+ / month |
| Platform | Google Sheets (browser, no install) | Desktop Excel required | Cloud SaaS |
| Setup time | Under 10 minutes ✅ | Under 15 minutes | Connect billing + onboarding |
| Real-time team collaboration | Yes, native ✅ | Limited (file versions) | Yes |
| Mobile access | Yes, Sheets app ✅ | Limited | Yes |
| Own your data & formulas | Yes, fully ✅ | Yes | No (closed system) |
| Customizable fields | Yes ✅ | Yes | Limited to vendor schema |
| Per-customer Search lookup | Yes ✅ | Manual | Yes |
| Year-1 cost at 5 users | $9.99 ✅ | ~$15 | $1,200-$12,000+ |
For SaaS founders and finance teams that want MRR, ARR, LTV and cash-flow visibility without paying four figures a year, the SaaS Financial Performance Dashboard in Google Sheets sits in the sweet spot.
👥 Who This Template Is For – and Who It’s Not For
✅ This template is built for:
- Bootstrapped and seed-stage SaaS founders tracking MRR, ARR and runway without a finance hire
- Finance and RevOps analysts who want LTV-to-CAC and cash-flow views they fully control
- Agencies and consultants reporting subscription performance to SaaS clients
- Small SaaS teams that prefer Google Sheets over a $100+/month analytics subscription
❌ This template is NOT for:
- Enterprises that need a direct, automated sync to Stripe, Chargebee or a data warehouse
- Teams requiring SOC 2, SSO and audit logging inside the reporting tool itself
- Businesses with no recurring-revenue or subscription model to measure
⚙️ How to Use the SaaS Financial Performance Dashboard in Google Sheets
- Open the PDF guide in your download and click the Google Sheets copy link to create your own editable copy in Google Drive.
- Go to the Data tab and replace the sample subscription records with your own, keeping the same column order.
- Open the Overview tab and use the slicers to filter by plan type, status, region or quarter.
- Review the Revenue, Unit Economics and Cash Flow tabs to read MRR, ARR, LTV, CAC and net cash flow analysis.
- Use the Search tab to look up any single customer by Record ID and review all records on the same plan type.
💼 Real-World Use Cases
Maya is the founder of a 12-person B2B SaaS startup. Each Monday she filters the Overview tab by plan and checks Total MRR and the Monthly MRR Trend before standup – replacing the $200/month analytics tool she cancelled.
Daniel runs finance at a subscription analytics agency. He uses the Unit Economics tab to show clients which plans have healthy LTV-to-CAC ratios, then the Cash Flow tab to flag when monthly expenses outrun revenue.
❓ Frequently Asked Questions
What KPIs does the SaaS Financial Performance Dashboard in Google Sheets track?
The SaaS Financial Performance Dashboard in Google Sheets tracks 5 headline KPIs – Total MRR, Total ARR, Average Lifetime Value, Average CAC and Total Customers – alongside 14 charts covering revenue, unit economics and cash flow. Every metric refreshes when you replace the sample data.
Do I need to install anything to use this dashboard?
No installation is required. The SaaS Financial Performance Dashboard in Google Sheets runs entirely in your browser through Google Sheets. Open the PDF guide in your download, click the copy link, and an editable copy is created in your own Google Drive in seconds.
How long does setup take?
Setup takes under 10 minutes. Paste your subscription records into the Data tab using the existing column order, and the Overview, Revenue, Unit Economics, Cash Flow and Search tabs update automatically. No formulas or scripts need rebuilding.
How does this compare to ChartMogul or Baremetrics?
ChartMogul and Baremetrics charge roughly $100-$1,000+ per month. The SaaS Financial Performance Dashboard in Google Sheets is a one-time $9.99 purchase you own outright, with full visibility into the data and formulas instead of a closed SaaS black box.
Can I filter the dashboard by plan, region or status?
Yes. The Overview tab includes slicers so you can filter the entire dashboard by plan type, subscription status, region or quarter and watch every card and chart update instantly without touching a formula.
Does the Search tab let me look up a single customer?
Yes. The Search tab lets you pick any Record ID from a dropdown and instantly see that customer’s Date, Customer ID, Name, Plan Type, Subscription Status, MRR, ARR, CAC and LTV, plus every other record on the same plan type beside it.
👤 About the Author
Built by PK – Microsoft Certified Professional with 15+ years of Excel, Google Sheets and Power BI experience. Founder of NextGenTemplates, reaching 300K+ subscribers across YouTube channels (@PK-AnExcelExpert, @NextGenTemplates, @NeoTechNavigators). Every template is hand-built and tested before release.
🔗 Explore Related Templates
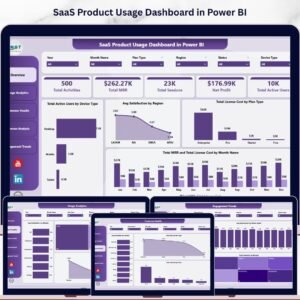
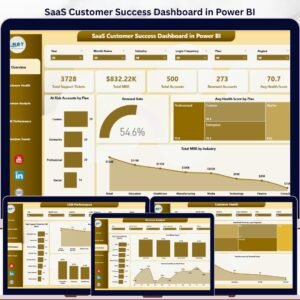
Pair this with the SaaS Product Usage Dashboard in Google Sheets to connect product engagement to revenue, or step up to the SaaS Customer Success Dashboard in Power BI for retention analytics. Finance teams also like the Church Finance Dashboard in Google Sheets and the Finance KPI Scorecard in HTML.
Also available as: a SaaS Customer Success edition in Excel and Power BI for teams on other platforms.
📖 Click here to read the Detailed Blog Post
Watch the step-by-step video tutorial:
🎥 Visit our YouTube channel for step-by-step video tutorials
👉 YouTube.com/@NextGenTemplates
📅 Last updated: June 2026


Reviews
There are no reviews yet.