

Finance KPI Scorecard in HTML is a professionally designed, interactive HTML dashboard template built for finance managers, CFOs, controllers, and business analysts who want a powerful yet browser-based tool to monitor critical financial performance indicators in real time. This HTML Dashboard Template delivers 10 essential finance KPIs with traffic light indicators, sparkline trends, MTD and YTD comparison modes, and detailed trend analysis charts — all in a single self-contained HTML file that runs in any modern web browser without software installation.
Managing financial health requires continuous monitoring of key metrics like revenue growth, net profit margin, operating expense ratio, and return on equity. Without a centralized visual reporting tool, finance teams often struggle to detect underperformance early, compare results against targets or prior periods, and communicate financial status to stakeholders. The Finance KPI Scorecard in HTML solves this by consolidating all critical finance analytics into one elegant, responsive scorecard powered by dynamic JavaScript charts, traffic light color coding, and interactive filtering.
🔑 Key Features of Finance KPI Scorecard in HTML
📊 10 Finance KPIs with Traffic Light Indicators — Monitor Revenue Growth, Net Profit Margin, Operating Expense Ratio, Current Ratio, Debt-to-Equity, Return on Equity, Days Sales Outstanding, Budget Variance, Working Capital Turnover, and Accounts Payable Turnover. Each KPI card displays a green, yellow, or red traffic light based on performance against target thresholds.
📈 MTD and YTD Toggle for Period Comparison — Switch between Month-to-Date and Year-to-Date views instantly to analyze short-term and cumulative financial performance from a single control.
🔄 Vs Target and Vs Previous Year Comparison Modes — Compare current KPI values against budgeted targets or against the same period from the previous year using a convenient dropdown selector.
✨ Sparkline Trend Charts on Each KPI Card — Every scorecard card includes a mini sparkline showing monthly actual values across the year, making it easy to spot trends at a glance without navigating away from the overview.
📉 Detailed KPI Trend Analysis with 4 Charts — The dedicated trend page features MTD Actual vs Target, MTD Actual vs Previous Year, YTD Actual vs Target, and YTD Actual vs Previous Year charts for deep-dive analysis on any selected KPI.
📤 Upload Your Own Excel Data — Replace sample data with your own financial figures using the companion Excel data template and see all charts and KPIs update automatically.
📄 Export to CSV and Vector PDF — Download your scorecard data as CSV for further analysis or export crisp vector PDF reports for board meetings and stakeholder presentations.
📱 Fully Responsive Design with Collapsible Sidebar — The dashboard adapts to any screen size from desktop monitors to tablets, with a collapsible sidebar navigation for distraction-free viewing.
📦 What’s Inside the Finance KPI Scorecard in HTML
This dashboard includes 4 interactive pages designed to give you complete visibility into your financial KPIs:
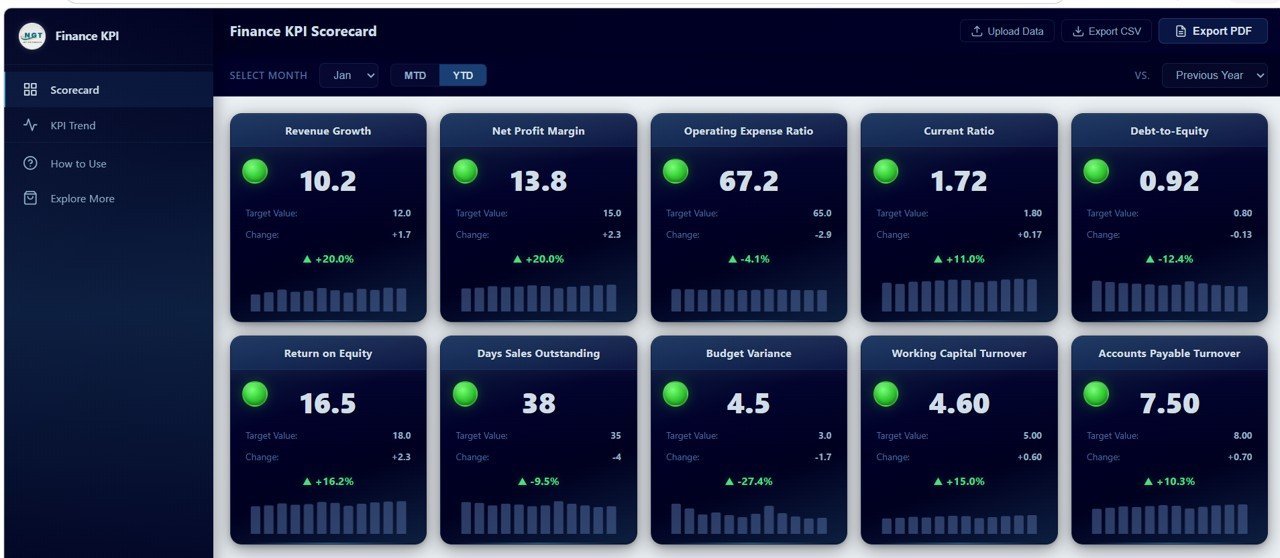
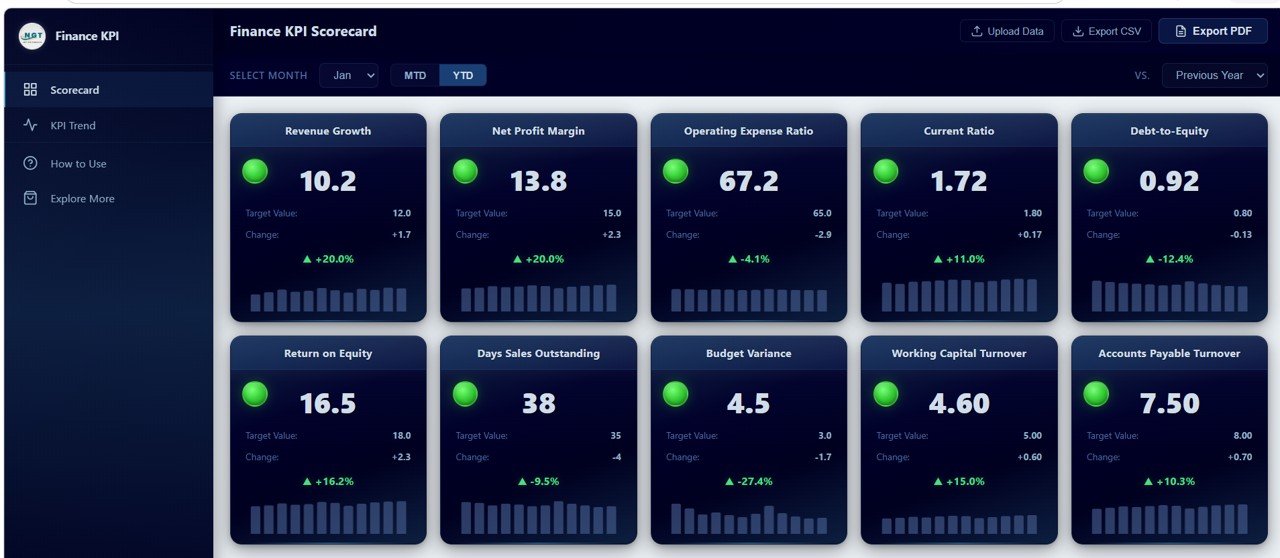
1. Scorecard Page — The main overview page features a filter bar with Month Selector, MTD/YTD Toggle, and Vs. Target/Previous Year dropdown. Below the filters, 10 KPI cards are displayed in a grid layout. Each card shows the KPI name, traffic light indicator (green for on or above target, yellow for within 10 percent of target, red for below 10 percent of target), current value, target value, change amount, percentage change, and a sparkline trend for the year.
 Finance KPI Scorecard
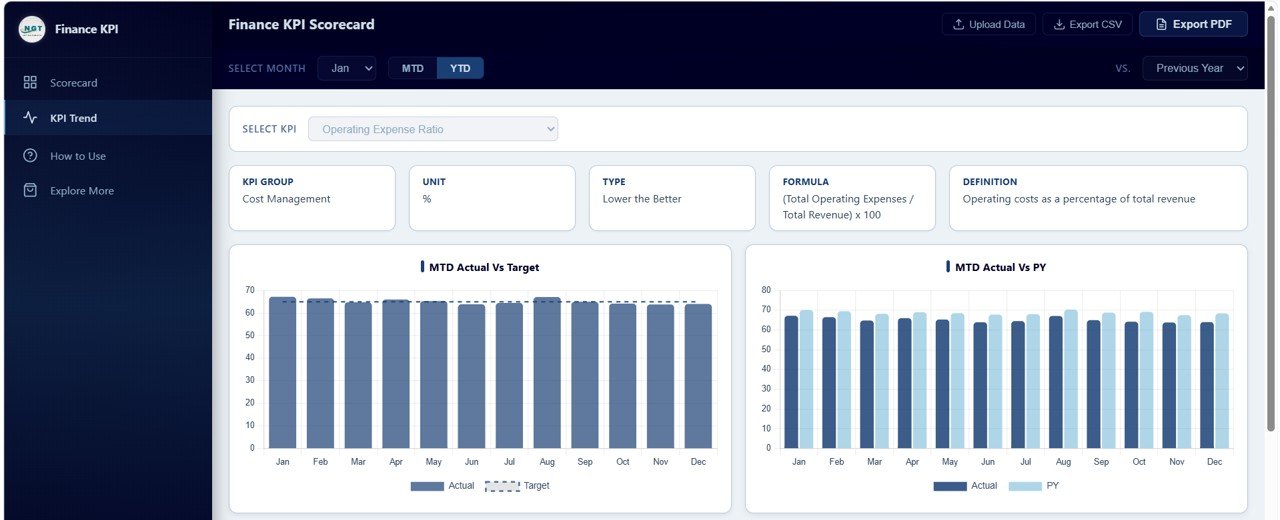
2. KPI Trend Page — This analysis page features a KPI selector dropdown at the top and an information bar showing KPI Group, Unit, Type, Formula, and Definition. Below that, four detailed charts provide comprehensive trend analysis: MTD Actual vs Target shows monthly performance gaps against budgeted goals, MTD Actual vs Previous Year reveals month-over-month growth patterns compared to the prior year, YTD Actual vs Target tracks cumulative progress toward annual targets, and YTD Actual vs Previous Year highlights year-over-year cumulative performance shifts.
 KPI Trend Analysis
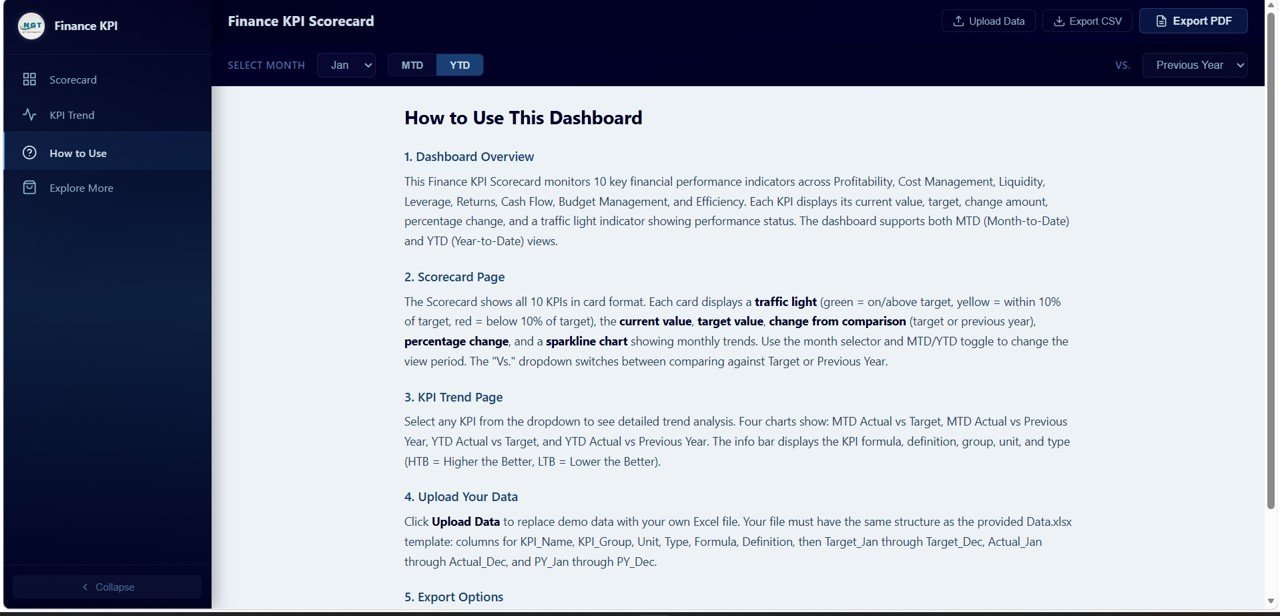
3. How to Use Page — A complete instructional guide covering dashboard overview, scorecard page features, KPI trend page features, how to upload your own data using the Excel template, and export options including CSV and PDF. Any team member can get started quickly without additional training.
 How to Use Guide
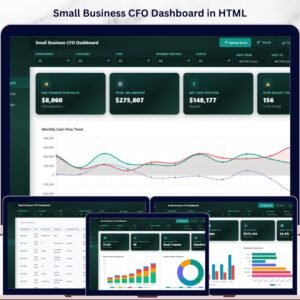
4. Explore More Page — A promotional page showcasing related premium finance templates from NextGenTemplates.com featuring product cards for the SaaS Financial Model Dashboard in HTML, Church Finance Dashboard in HTML, and CFO Dashboard template. Includes a WELCOME15 coupon code for 15 percent off the first purchase.
⚙️ How to Use the Finance KPI Scorecard in HTML
1️⃣ Download and unzip the template file to your computer.
2️⃣ Open the included Excel data template and replace sample data with your own finance KPIs, targets, and monthly actuals.
3️⃣ Save the Excel file and open index.html in any modern browser (Chrome, Edge, Firefox).
4️⃣ Use the Month Selector, MTD/YTD toggle, and comparison dropdown to explore your financial performance.
5️⃣ Navigate to the KPI Trend page for detailed chart analysis on any specific KPI.
6️⃣ Export your scorecard as CSV or vector PDF for reporting and presentations.
👥 Who Can Benefit from This Finance KPI Scorecard in HTML
💼 CFOs and Finance Directors — Get an executive-level snapshot of all critical financial KPIs in one responsive dashboard.
📊 Financial Controllers — Track budget variance, operating expenses, and working capital turnover with traffic light alerts.
🏢 Business Analysts — Perform trend analysis comparing actual results against targets and prior year benchmarks.
🚀 Startup Founders — Monitor burn rate-adjacent metrics, debt ratios, and revenue growth with minimal setup. Also explore our Startup Burn Rate Dashboard in HTML.
📋 Accounting Teams — Track days sales outstanding, accounts payable turnover, and current ratio for cash flow management.
❓ Frequently Asked Questions
What KPIs does the Finance KPI Scorecard in HTML track?
The Finance KPI Scorecard in HTML tracks 10 key performance indicators including Revenue Growth, Net Profit Margin, Operating Expense Ratio, Current Ratio, Debt-to-Equity Ratio, Return on Equity, Days Sales Outstanding, Budget Variance, Working Capital Turnover, and Accounts Payable Turnover. Each KPI features traffic light color coding and sparkline trends.
Do I need coding skills to use this HTML finance dashboard?
No. Simply replace the sample data in the companion Excel template with your own financial figures, save the file, and open index.html in any web browser. All charts, KPIs, and traffic lights update automatically.
Can I compare my finance KPIs against both targets and previous year?
Yes. The dashboard includes a dropdown selector that lets you toggle between Vs. Target mode and Vs. Previous Year mode for both MTD and YTD views, giving you four distinct comparison perspectives for every KPI.
What is the best HTML dashboard template for tracking finance KPIs?
The Finance KPI Scorecard in HTML from NextGenTemplates is one of the best browser-based finance KPI tracking solutions available. It includes 10 KPIs with traffic light indicators, sparkline trends, 4 detailed trend charts, Excel data upload, and CSV/PDF export — all in a single HTML file with no software installation required.
Can I export the finance scorecard data for reporting?
Yes. The dashboard supports exporting scorecard data to CSV format for spreadsheet analysis and to vector PDF for high-quality print-ready reports suitable for board meetings and stakeholder presentations.
🔗 Explore Related Templates
📌 SaaS Financial Model Dashboard in HTML — Track SaaS-specific financial metrics including MRR, ARR, churn rate, and runway projections.
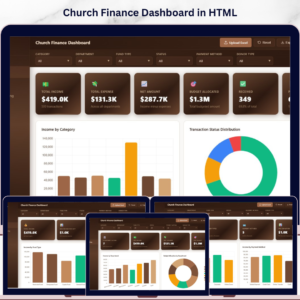
📌 Church Finance Dashboard in HTML — Monitor church income, expenses, fund allocations, and donation tracking with visual analytics.
📌 Startup Burn Rate Dashboard in HTML — Analyze startup cash burn, runway, and monthly expenditure patterns with interactive charts.


Reviews
There are no reviews yet.