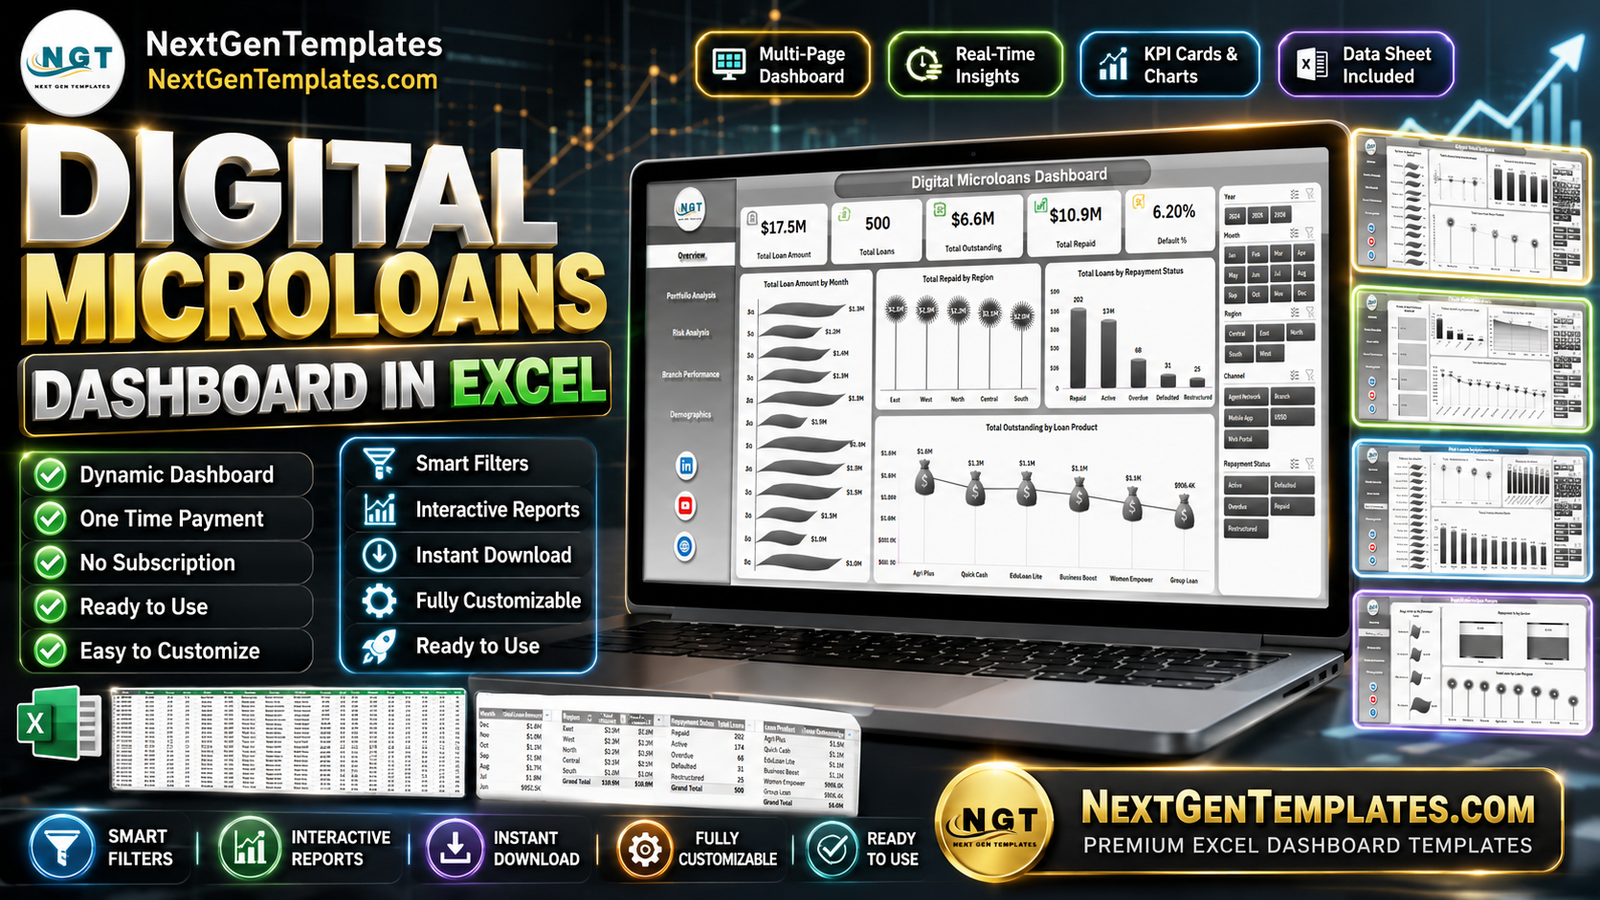


Digital Microloans Dashboard in Excel gives lending teams 5 KPI cards, 19 pivot-driven charts, multiple slicers, a structured Data sheet, and a hidden Support sheet for refresh-ready reporting. Microloan portfolios can change daily across regions, borrower types, loan officers, repayment statuses, and risk categories; this Excel dashboard helps you review that activity without building every pivot report manually. Join 8,400+ teams in 40+ countries using NextGenTemplates for one-time-purchase templates with no subscription, no per-user fee, and lifetime file access.
Digital Microloans Dashboard in Excel
Key Features of Digital Microloans Dashboard in Excel
5 executive KPI cards – Total Loan Amount, Total Loans, Total Outstanding, Total Repaid, and Default % summarize portfolio health at the top of the Overview page.
19 ready-made analysis charts – Review monthly loan movement, repayment by region, outstanding balances by product, default percentage by risk category, officer repayment performance, and borrower demographics.
Multiple slicers for fast filtering – Filter the dashboard by key portfolio dimensions and see charts update instantly without editing formulas.
Pivot-table engine – The Support sheet contains the pivot tables behind every chart, so you can refresh all reports after updating the Data sheet.
Excel-first workflow – Keep the dashboard offline, customize it in Excel, and use your existing portfolio export without paying for a separate SaaS reporting tool.
What’s Inside the Digital Microloans Dashboard in Excel
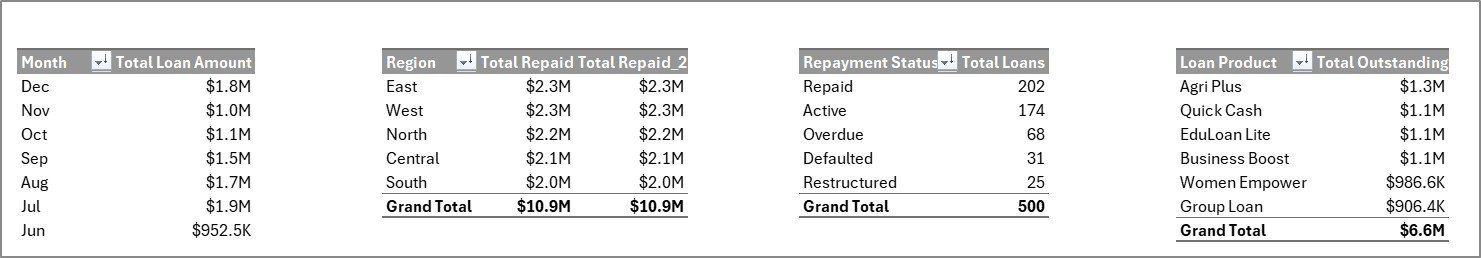
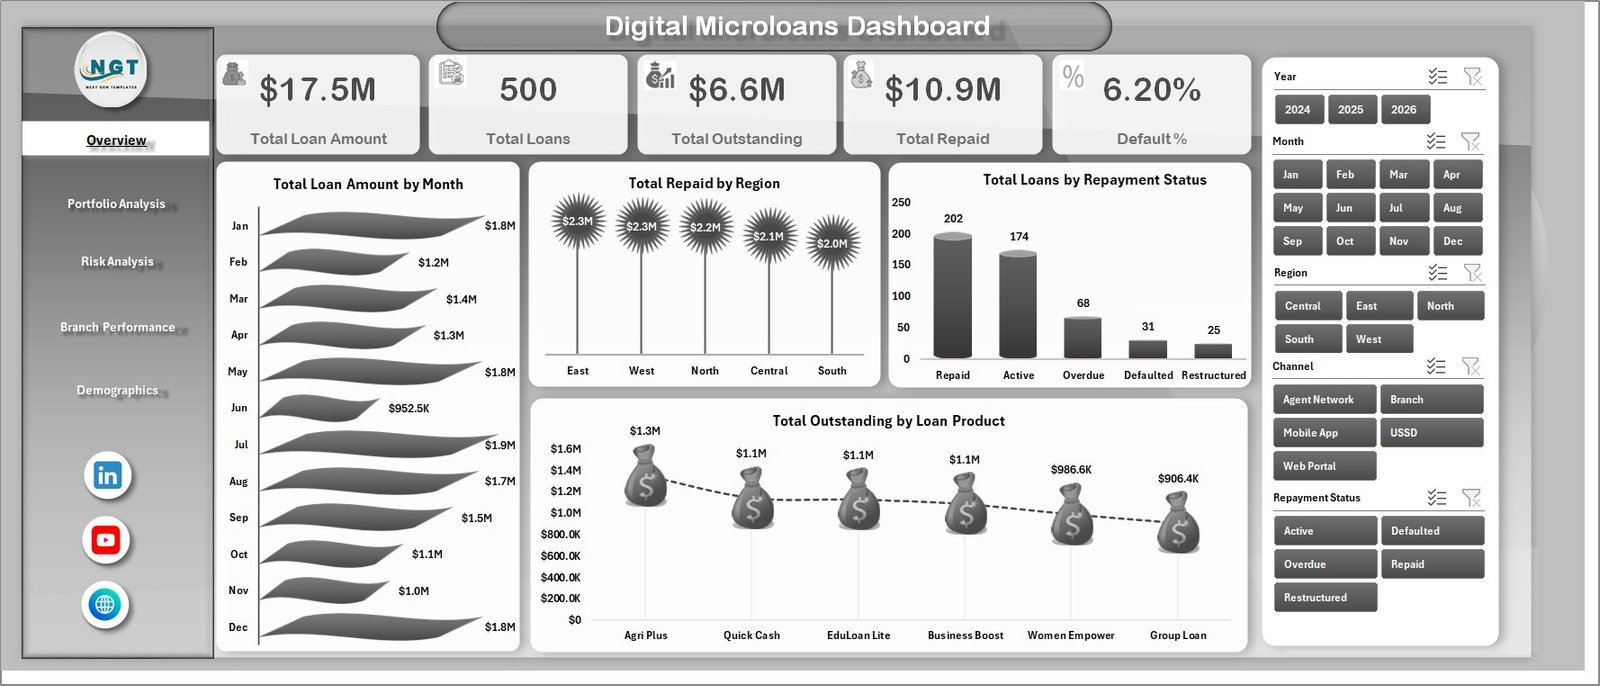
1 – Overview Page – The top cards show Total Loan Amount, Total Loans, Total Outstanding, Total Repaid, and Default %. The page also includes Total Loan Amount by Month for trend tracking, Total Repaid by Region for collection visibility, Total Loans by Repayment Status for portfolio status mix, and Total Outstanding by Loan Product for exposure analysis.
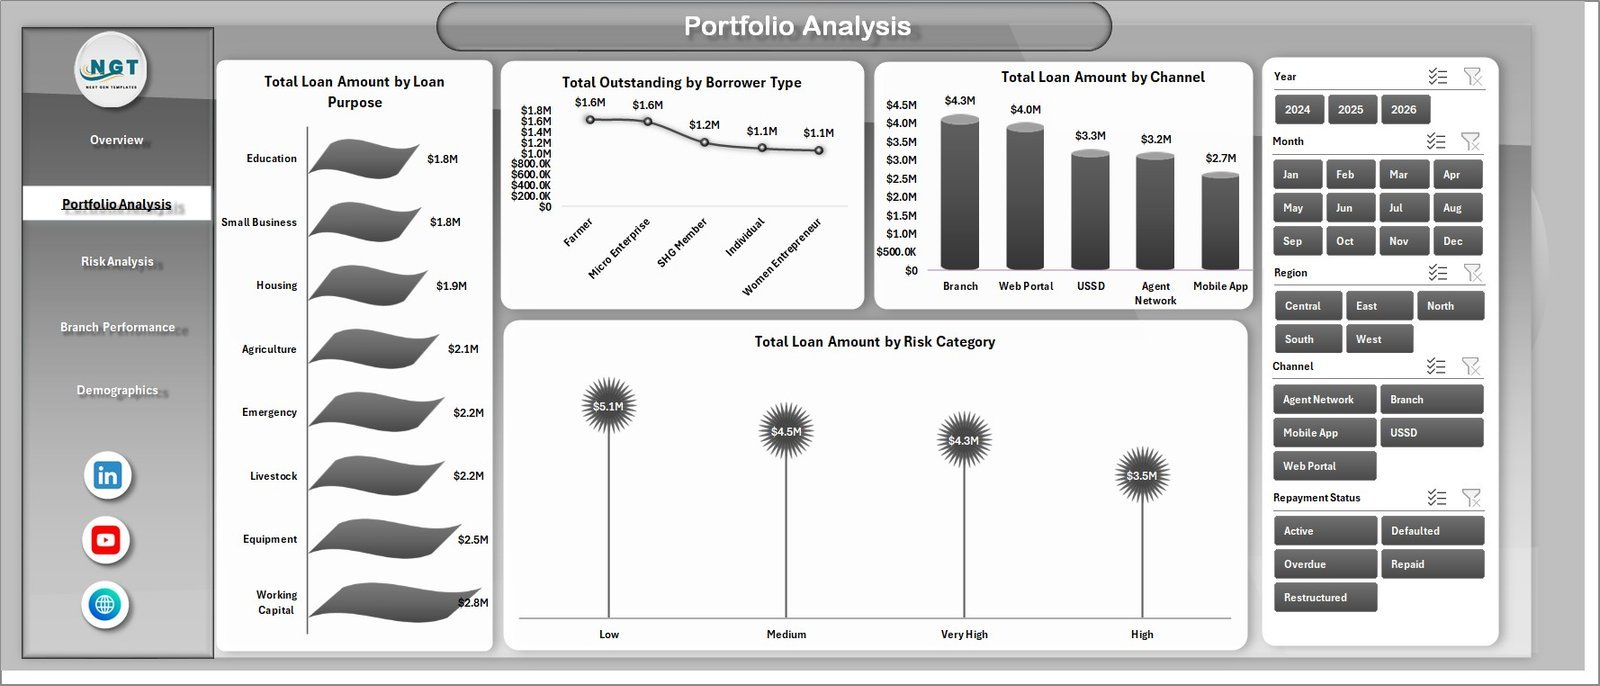
2 – Portfolio Analysis – This page explains where the lending portfolio is concentrated. Total Loan Amount by Loan Purpose shows which borrower needs drive disbursement volume, Total Outstanding by Borrower Type highlights exposure by customer group, Total Loan Amount by Channel compares origination channels, and Total Loan Amount by Risk Category shows how much lending sits in each risk tier.
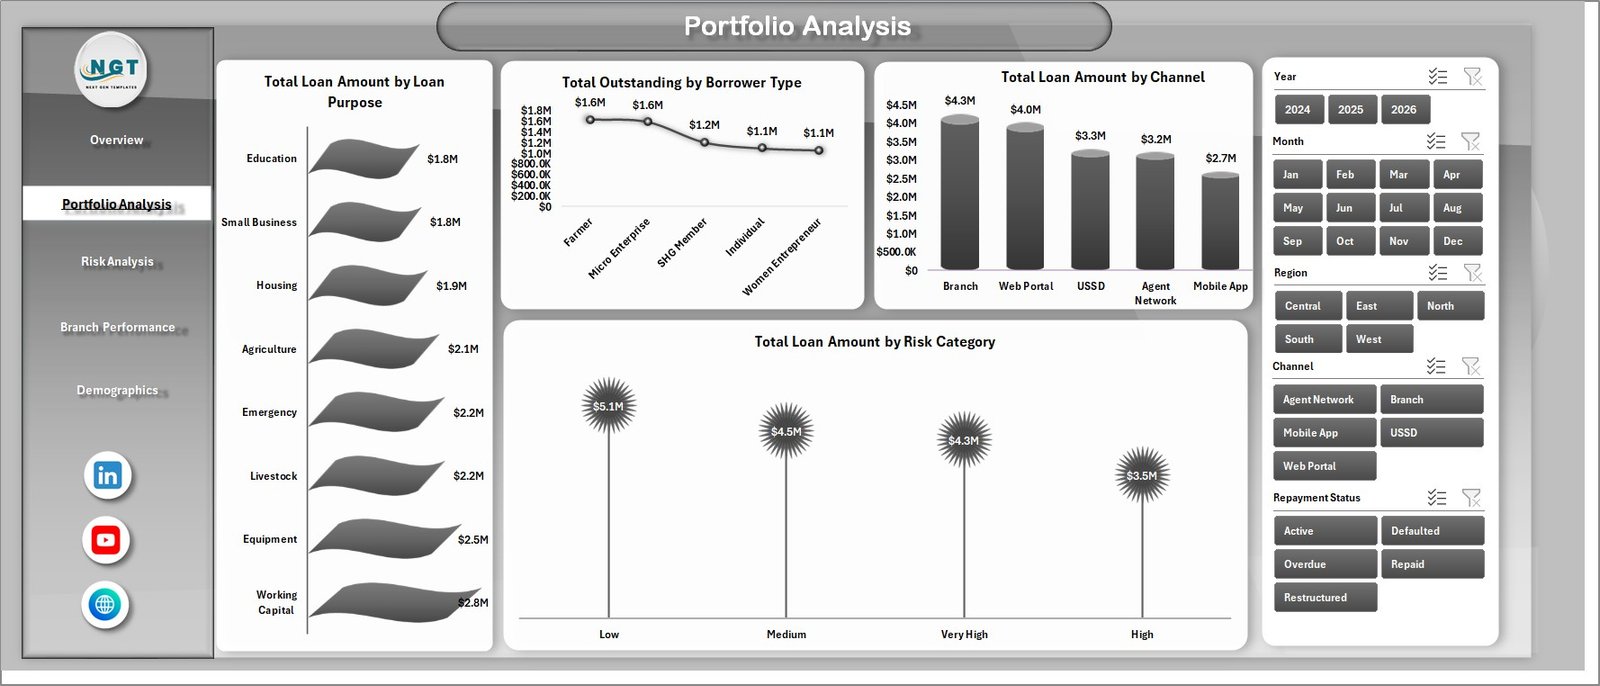
Portfolio Analysis
3 – Risk Analysis – This page focuses on repayment risk and branch-level exposure. Default % by Risk Category helps validate risk bands, Total Outstanding by Repayment Status shows unpaid exposure by stage, Total Loans by Risk Category counts volume by risk tier, and Total Loan Amount by Branch compares lending scale across locations.
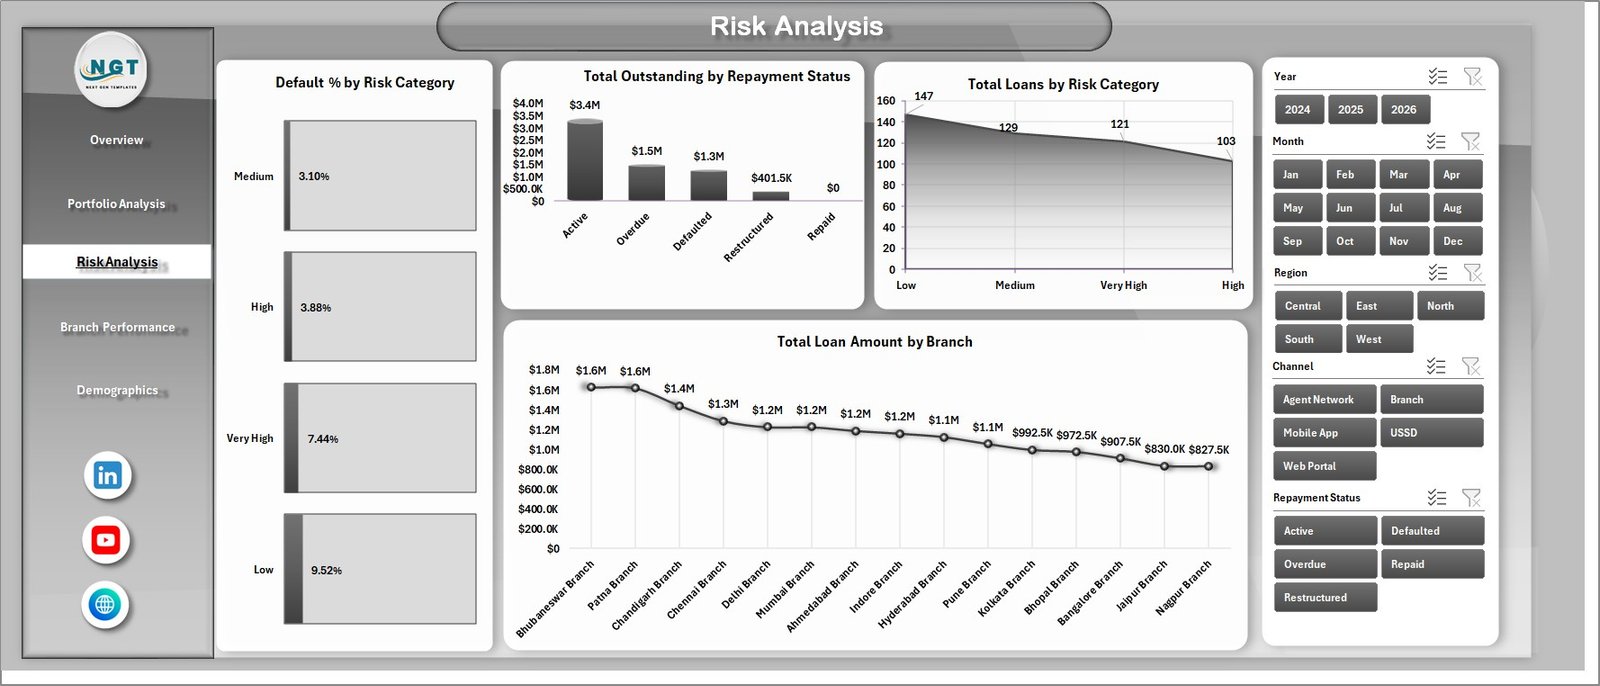
Risk Analysis
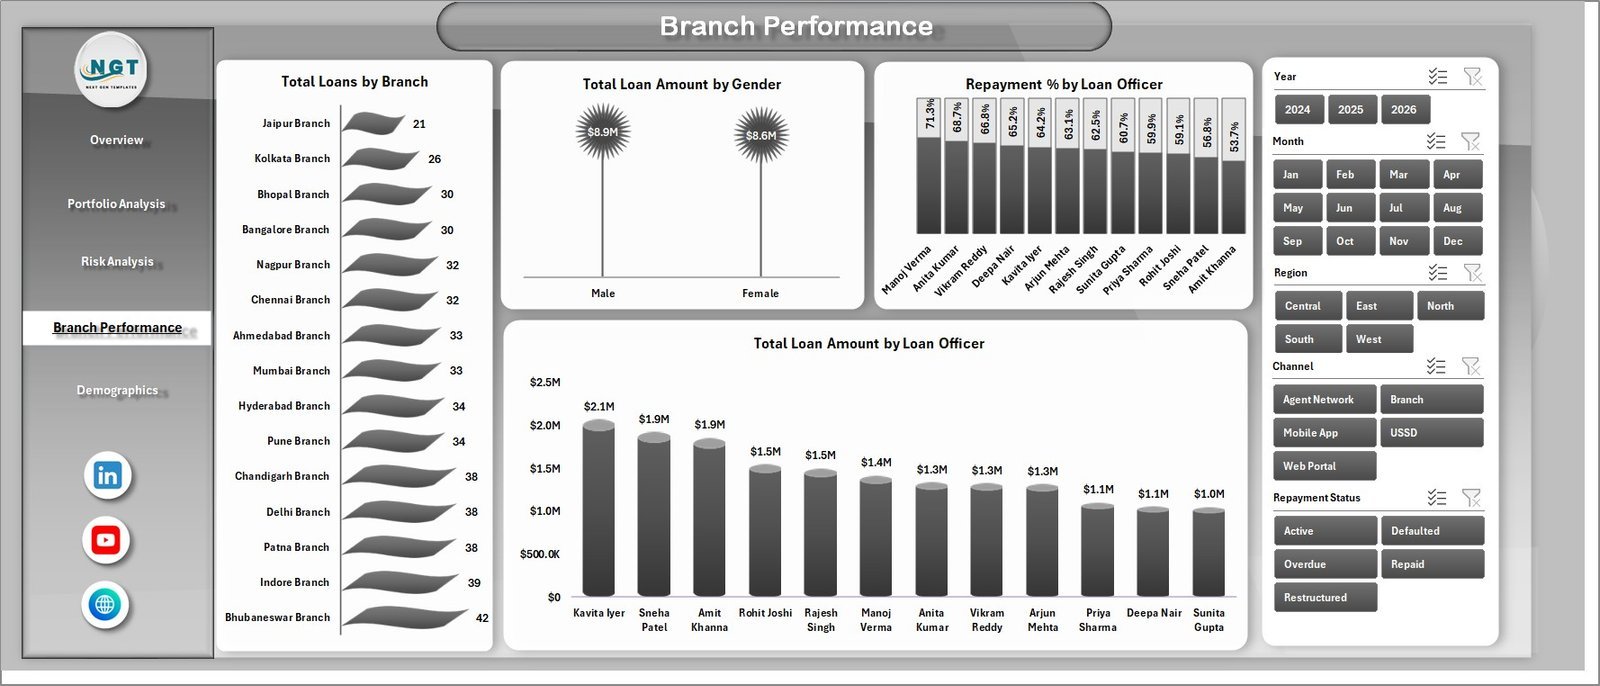
4 – Branch Performance – Compare branch and officer output in one view. Total Loans by Branch shows branch activity, Total Loan Amount by Gender supports borrower segmentation, Repayment % by Loan Officer helps identify strong collection performance, and Total Loan Amount by Loan Officer compares officer-managed lending volume.
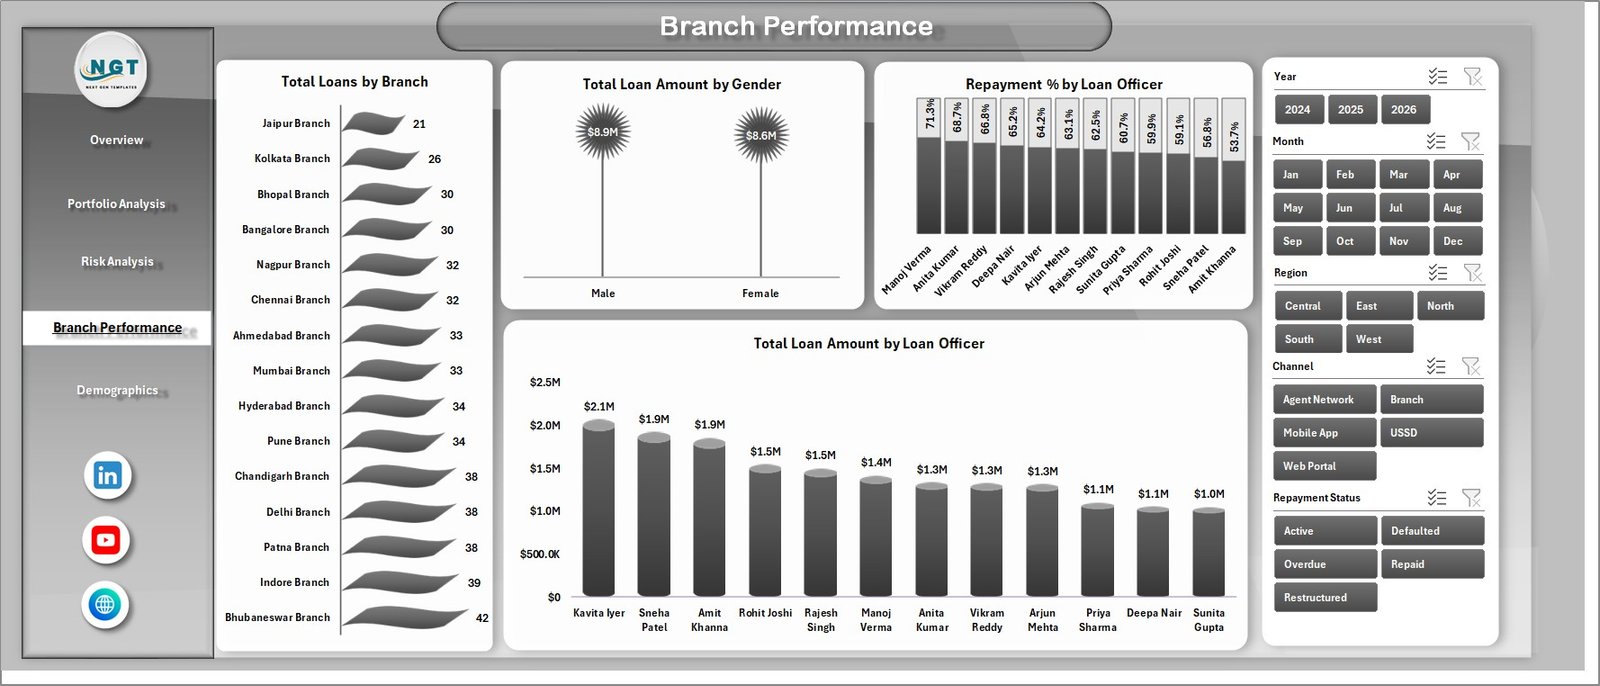
Branch Performance
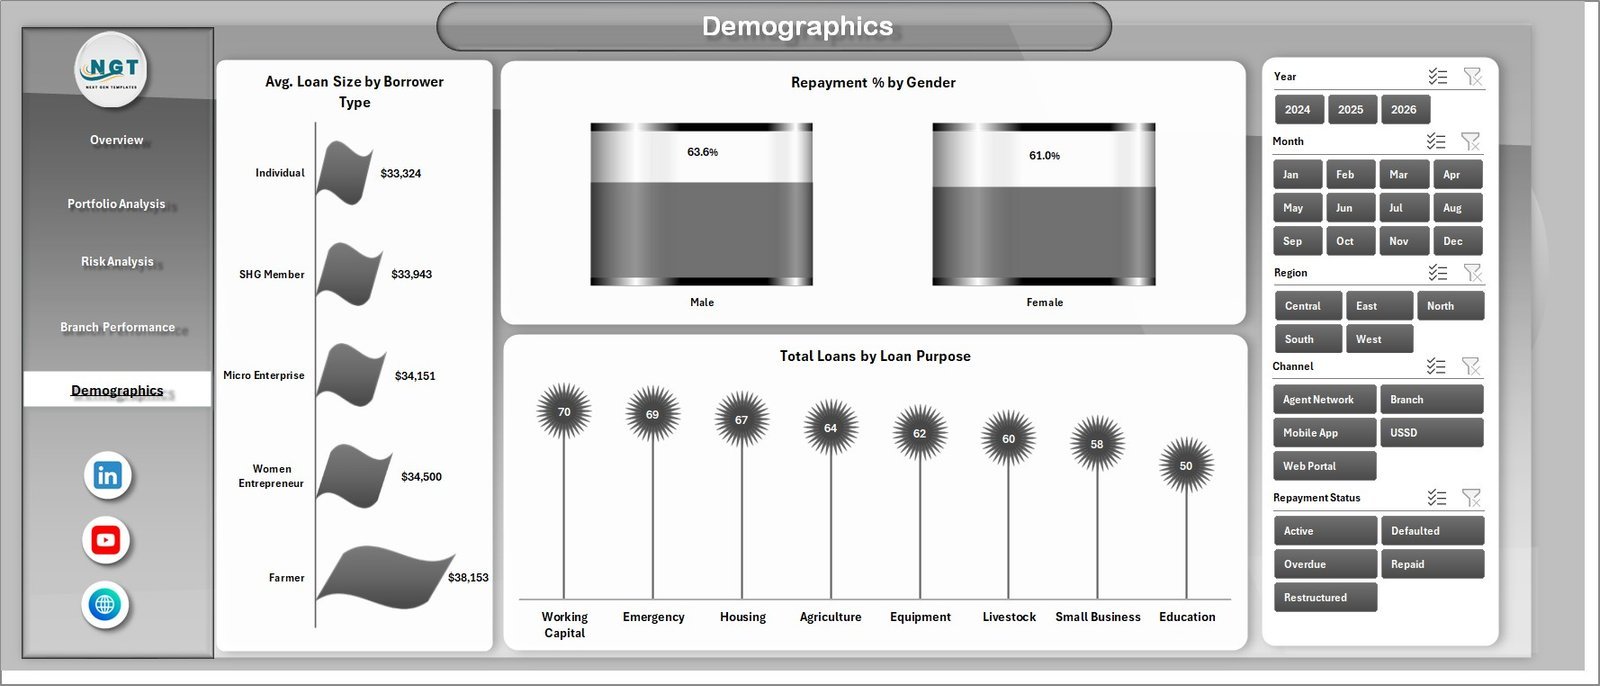
5 – Demographics – Understand borrower mix and repayment patterns. Avg. Loan Size by Borrower Type reveals differences in ticket size, Repayment % by Gender helps compare repayment behavior, and Total Loans by Loan Purpose shows demand by use case.
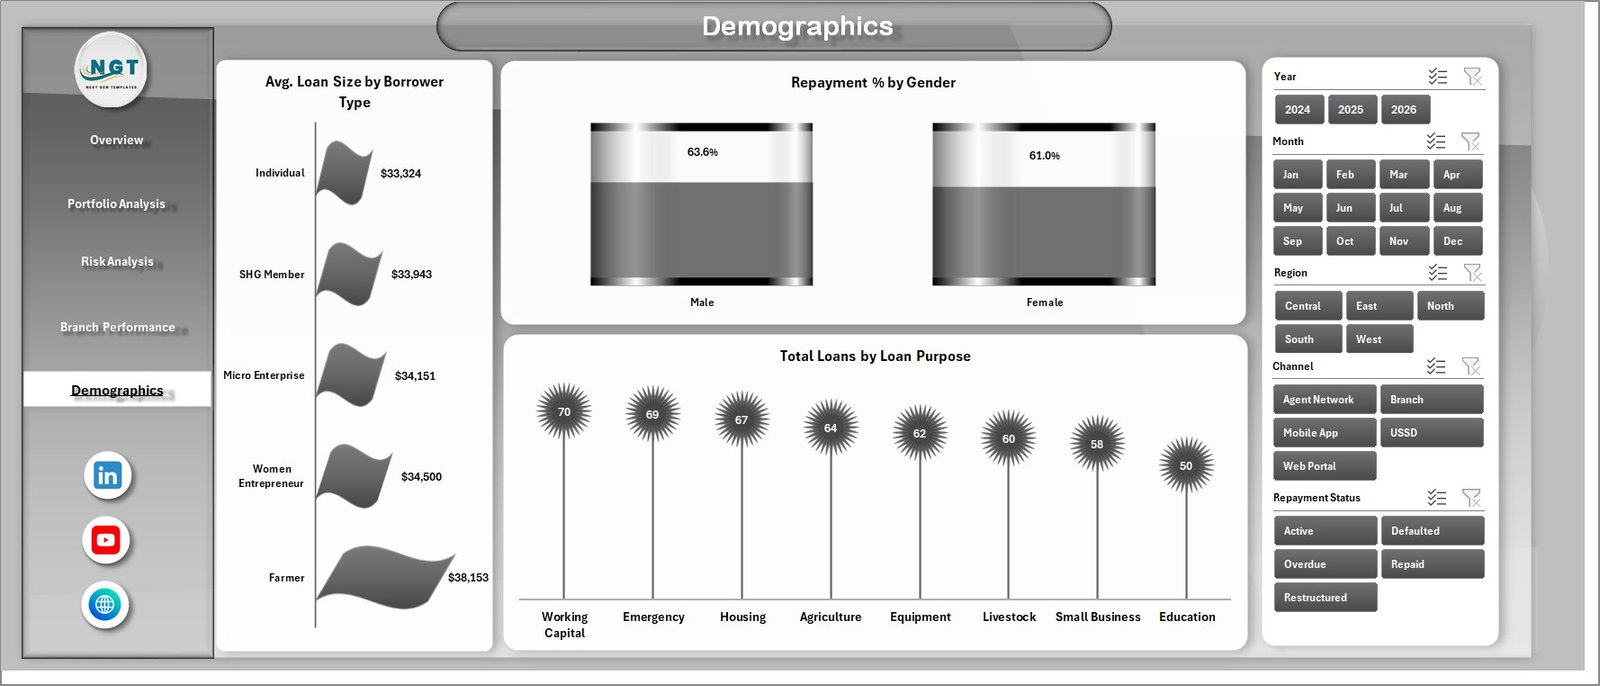
Demographics
6 – Data Sheet – Paste or type your microloan records in the same column format as the sample file. Keep the headers intact, add your own rows, then refresh the workbook.
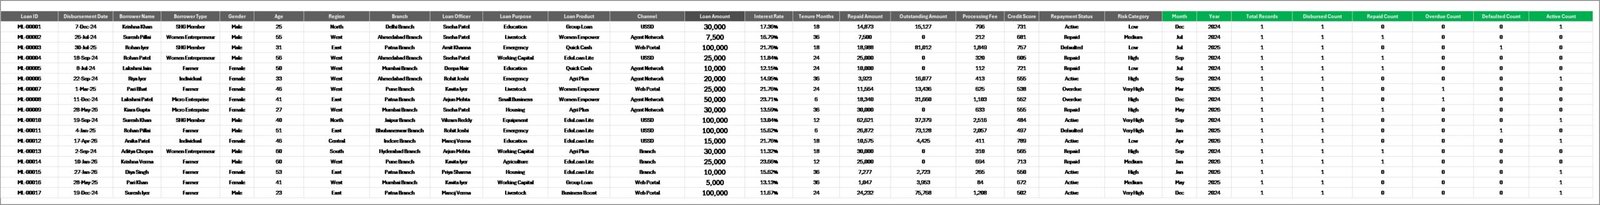
Data Sheet tab
7 – Support Sheet – The Support sheet stores the pivot tables that drive the charts. After updating the Data sheet, go to the Data tab in the Excel Ribbon and click Refresh All. You can keep this sheet hidden for normal dashboard use.
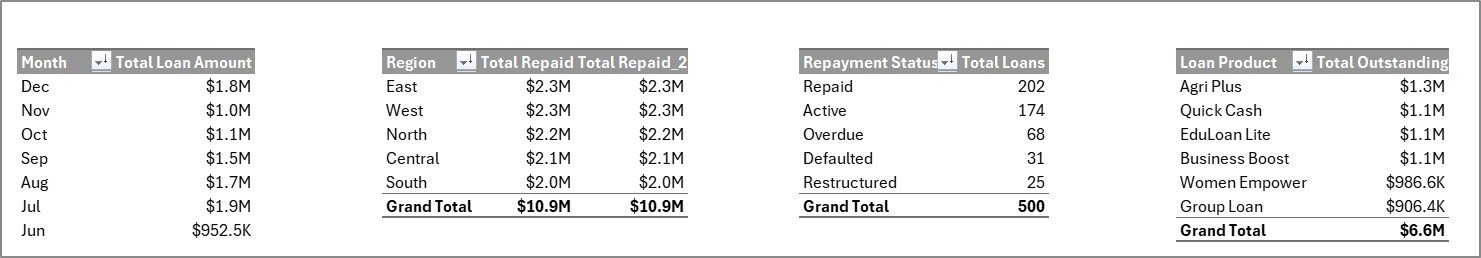
Support sheet tab
Digital Microloans Dashboard in Excel vs. Google Sheets vs. Paid Lending SaaS – Where This Fits
| Feature | This Excel dashboard | Google Sheets tracker | Paid lending SaaS |
|---|---|---|---|
| Cost | $17.99 one-time | Free to low-cost, manual build | Monthly subscription |
| Platform | Microsoft Excel | Browser-based spreadsheet | Vendor-hosted system |
| Setup time | Under 10 minutes | 30+ minutes if building reports | Days or weeks |
| Offline access | Yes | Limited | No |
| Pivot-driven charts | Included | Manual setup | Included at higher cost |
| Year-1 cost at 5 users | $17.99 total | $0 plus build time | Often hundreds or thousands |
Who This Template Is For – and Who It’s Not For
Built for: microfinance institutions, digital lending startups, NGO lending programs, branch managers, loan officers, portfolio analysts, finance teams, and consultants who need fast Excel-based loan portfolio reporting.
Not for: teams needing real-time API integration, regulated core banking replacement, automated borrower communication, payment collection automation, or a full loan origination system.
How to Use the Digital Microloans Dashboard in Excel
- Download and unzip the file.
- Open the workbook in Microsoft Excel.
- Go to the Data sheet and replace the sample records with your own microloan data.
- Keep the existing column headers and data format.
- Click Data > Refresh All in the Excel Ribbon.
- Use slicers to filter the Overview, Portfolio Analysis, Risk Analysis, Branch Performance, and Demographics pages.
- Hide the Support sheet if you want a cleaner file for end users.
Real-World Use Cases
Asha, portfolio manager at a regional microfinance institution, uses the Overview and Risk Analysis pages every month to check outstanding balances, repayment status, and default % by risk category before the leadership meeting.
Daniel, operations lead at a digital lender, compares Total Loan Amount by Channel and Total Loans by Repayment Status to see which acquisition channels are producing healthy repayment behavior.
Meera, branch performance analyst, uses Repayment % by Loan Officer and Total Loans by Branch to identify coaching opportunities and recognize high-performing field teams.
Frequently Asked Questions
Does this dashboard require macros?
No. The dashboard is designed around standard Excel sheets, charts, slicers, and pivot tables.
Can I replace the sample data?
Yes. Add your records in the Data sheet using the same format, then click Refresh All to update the dashboard.
Can I add more branches, loan officers, or regions?
Yes. Add them as values in your data table and refresh the pivots. Slicers and charts will pick them up from the refreshed data source.
Is this a loan management system?
No. It is a reporting dashboard for analysis. It does not collect repayments, send reminders, or originate loans.
Can I customize the charts?
Yes. Because the file is built in Excel, you can edit charts, pivot tables, colors, headings, and layout after purchase.
Which Excel versions are supported?
Use Microsoft Excel 2016, 2019, 2021, or Microsoft 365 for best results with slicers and pivot refresh.
About the Author
Built by PK – Microsoft Certified Professional with 15+ years of Excel, Google Sheets, and Power BI experience. Founder of NextGenTemplates, reaching 300K+ subscribers across YouTube channels. Every template is hand-built and tested before release.
Explore Related Templates
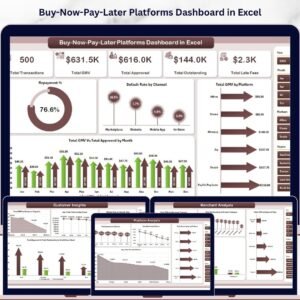
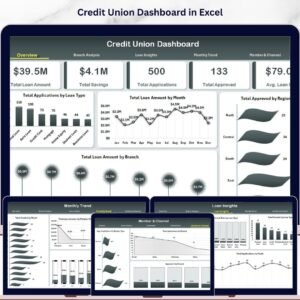
Explore the Microfinance Institutions Dashboard in Excel, Buy-Now-Pay-Later Platforms Dashboard in Excel, Credit Union Dashboard in Excel, and Buy-Now-Pay-Later Platforms Dashboard in Power BI. You can also browse all MS Excel templates and Excel dashboard templates.
Download the Digital Microloans Dashboard in Excel today and turn loan records into decision-ready reporting in minutes.
Last updated: June 3, 2026


Reviews
There are no reviews yet.