
Angel investors globally deploy over $25 billion annually across 60,000+ startup deals in the US alone — yet most angel networks still manage deal flow, portfolio performance, and geographic analysis in disconnected spreadsheets with no unified view. The Business Angel Networks Dashboard in Power BI consolidates your entire investment operation into 5 interactive analytics pages, tracking 5 high-level KPIs and 20+ Power BI visuals across deal flow, portfolio performance, network dynamics, and geographic spread. Setup takes under 10 minutes — connect your data source in Power BI Desktop and every chart, KPI card, and slicer updates automatically.
🌍 Join 8,400+ teams in 40+ countries using NextGenTemplates to replace expensive SaaS platforms with one-time-purchase Excel, Google Sheets, Power BI, and HTML templates.
✅ Instant download · One-time payment · No subscription · No per-user fees · Lifetime access
🔑 Key Features of the Business Angel Networks Dashboard in Power BI
🔹 5 fully-interactive Power BI pages — Overview, Deal Flow, Portfolio Performance, Network Analysis, and Geographic Analysis. Each page answers a distinct investment question: from which sectors generate the best returns to which regions carry the most concentration risk. Every page is cross-filterable using multi-dimensional slicers for sector, region, funding stage, investor type, and deal status.
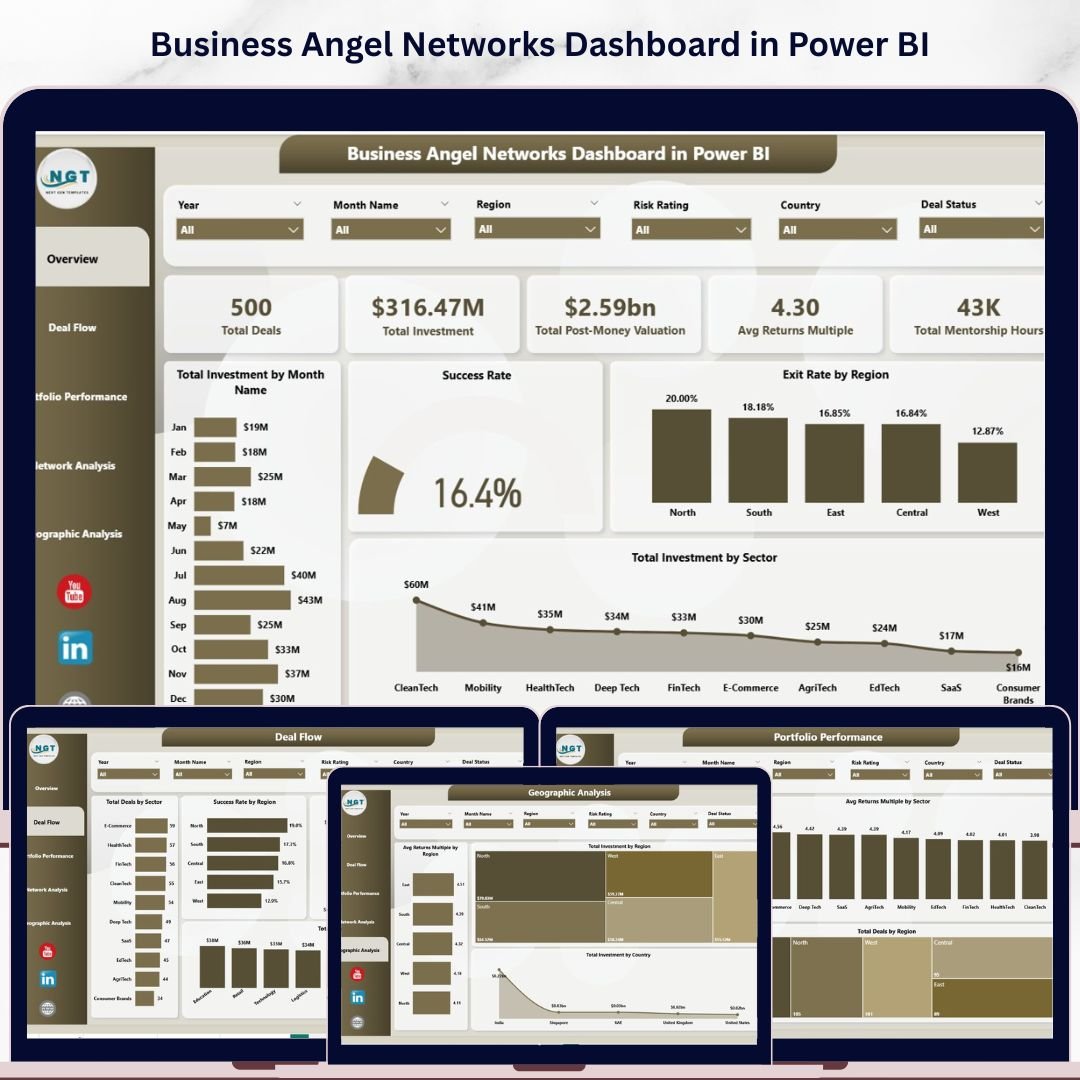
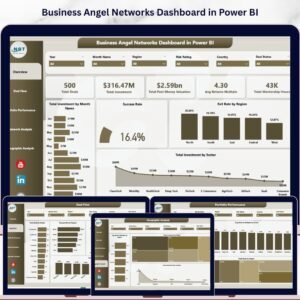
🔹 5 headline KPI cards on the Overview page — Total Deals, Total Investment ($), Total Post-Money Valuation, Avg Returns Multiple, and Total Mentorship Hours. These top-of-page metrics respond in real-time to slicer selections, giving angel network managers an instant pulse on portfolio health before diving into deeper analysis.
🔹 20+ Power BI DAX-powered visuals — including Total Investment by Month (trend line), Success Rate gauge, Exit Rate by Region, Total Investment by Sector, Deal Flow by Industry and Funding Stage, Returns Multiple by Funding Stage and Sector, Investment by Investor Type, Investment by Deal Status, and Geographic Investment by Region and Country. Every visual is purpose-built around angel network decision-making, not generic business analytics.
🔹 Works with free Power BI Desktop — download and use the .pbix file at zero additional cost. Microsoft’s Power BI Desktop is a free download; no Power BI Pro subscription is required to view and edit this dashboard locally. Share via Power BI Service when your team needs collaborative access.
📦 What’s Inside the Business Angel Networks Dashboard in Power BI
The download includes a single .pbix file pre-loaded with realistic sample data across all 5 dashboard pages. Replace the sample dataset with your own deal records and the entire dashboard — all visuals, KPI cards, and cross-filters — refreshes instantly.
Page 1 — Overview: 5 KPI cards (Total Deals, Total Investment, Post-Money Valuation, Avg Returns Multiple, Total Mentorship Hours) + 4 charts: Total Investment by Month Name (trend), Success Rate gauge, Exit Rate by Region, Total Investment by Sector. Interactive slicers for all key dimensions.
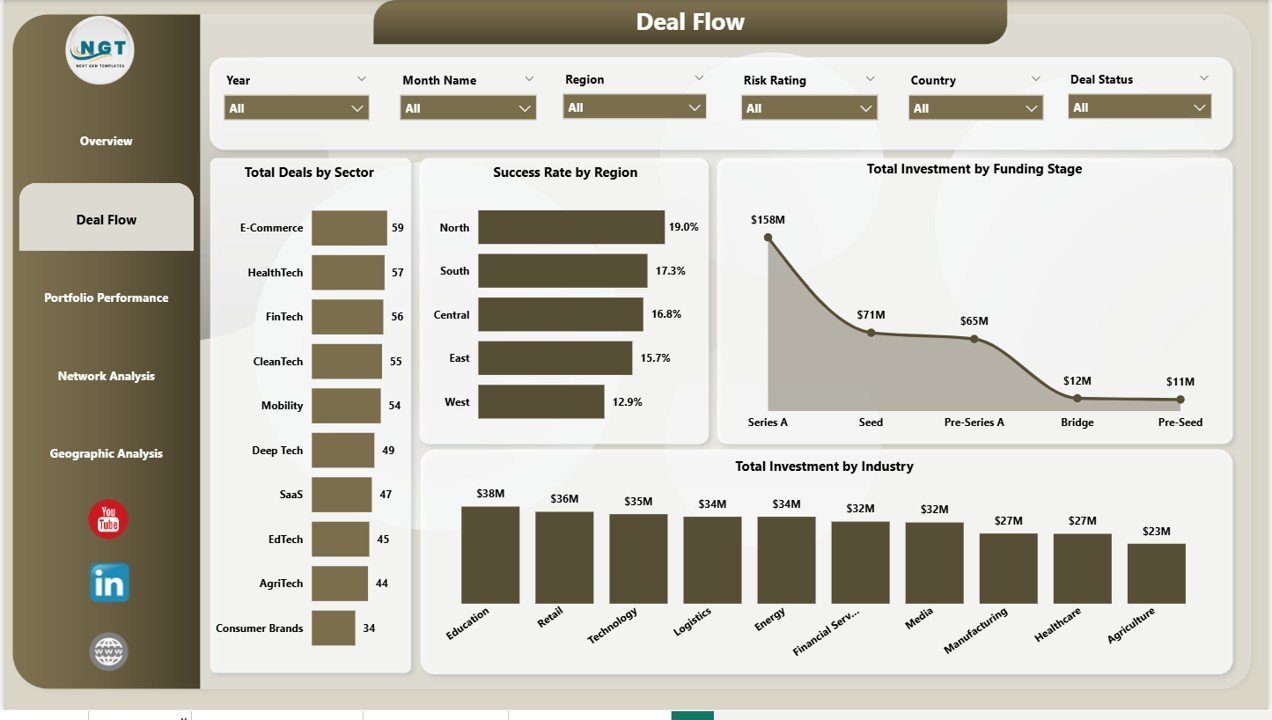
Page 2 — Deal Flow: Total Deals by Sector, Success Rate by Region, Total Investment by Funding Stage, Total Investment by Industry. Identifies your best-performing deal pipelines and funding concentrations.
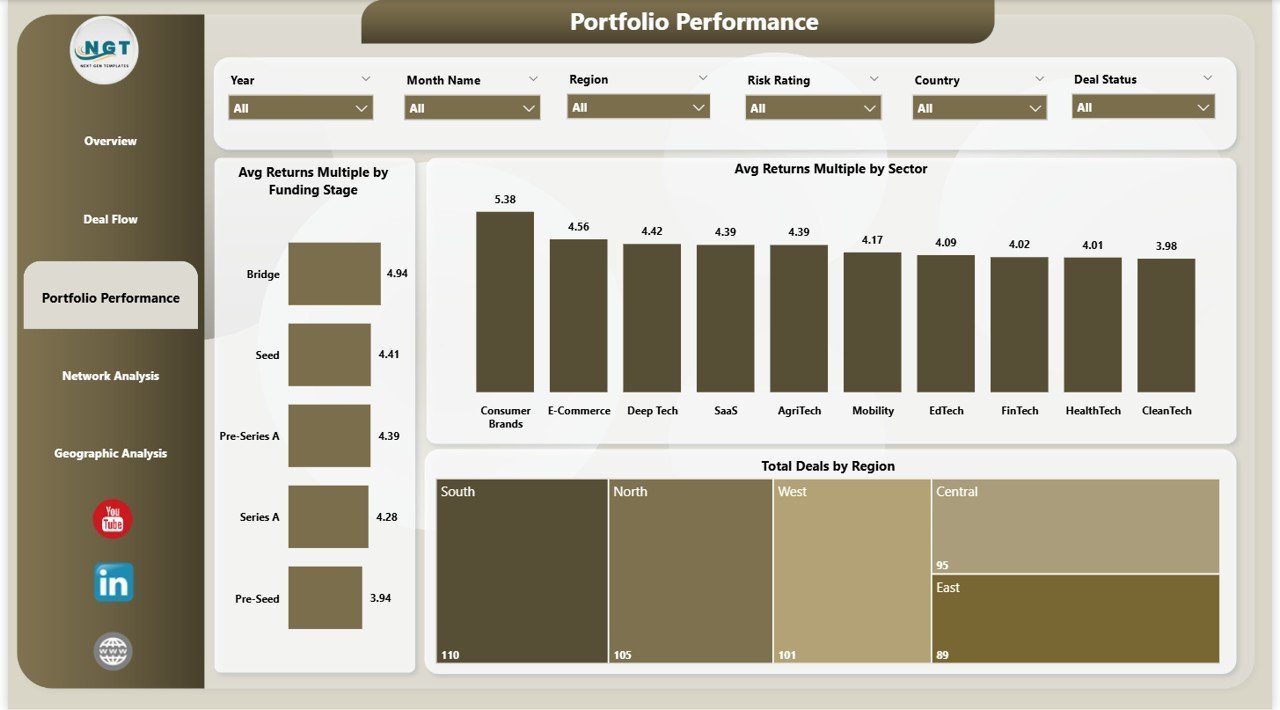
Page 3 — Portfolio Performance: Avg Returns Multiple by Funding Stage, Avg Returns Multiple by Sector, Total Deals by Region. Benchmarks portfolio ROI across investment dimensions.
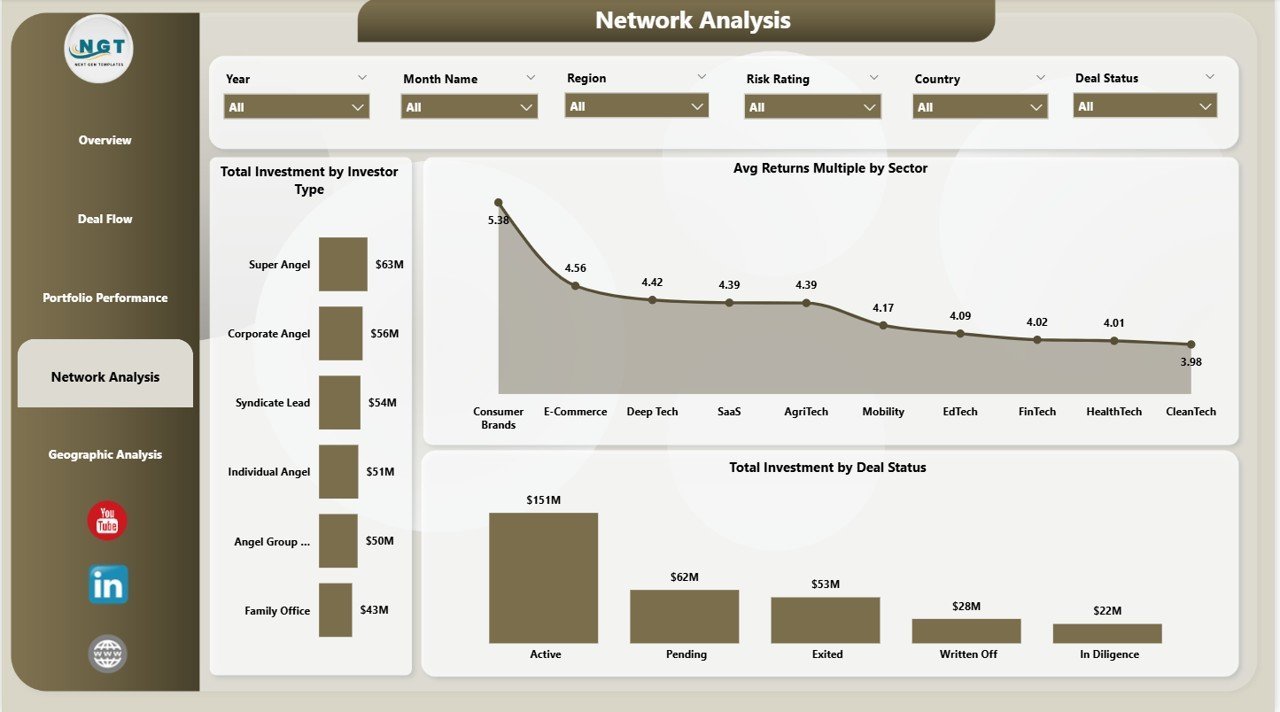
Page 4 — Network Analysis: Total Investment by Investor Type, Avg Returns Multiple by Sector, Total Investment by Deal Status. Maps investor mix and deal status distribution.
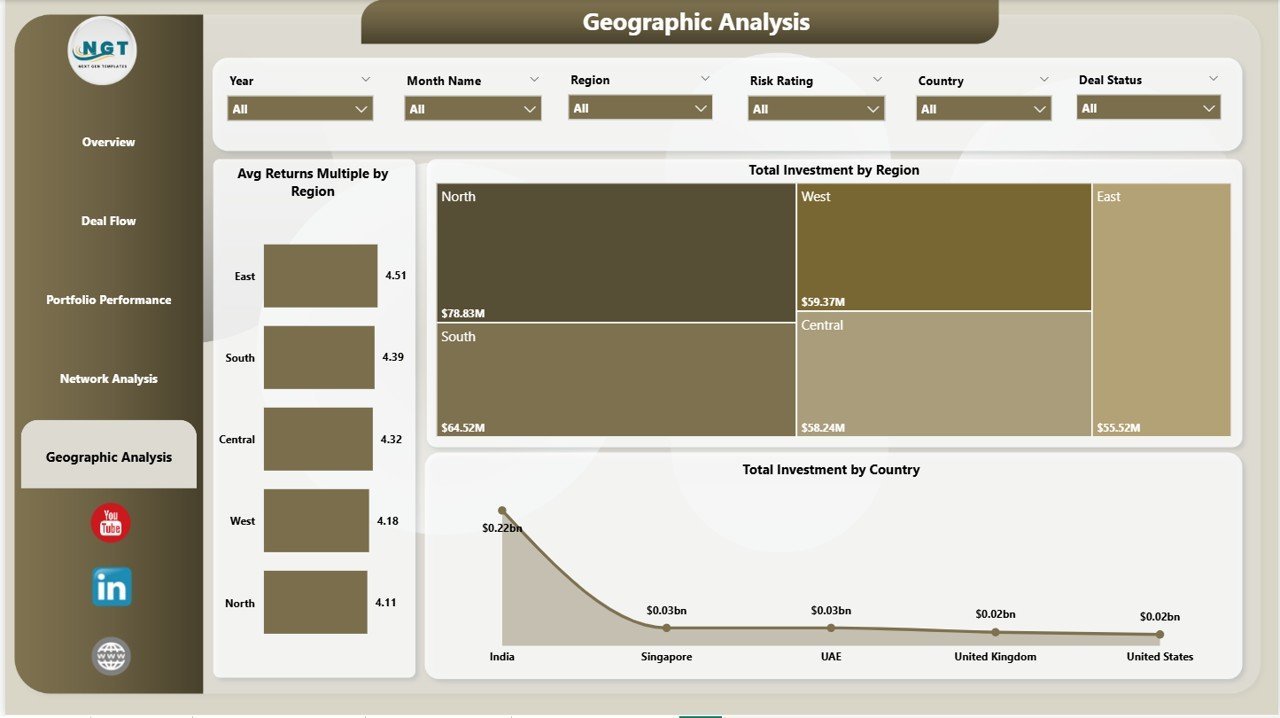
Page 5 — Geographic Analysis: Avg Returns Multiple by Region, Total Investment by Region, Total Investment by Country. Full geographic concentration and returns visibility.
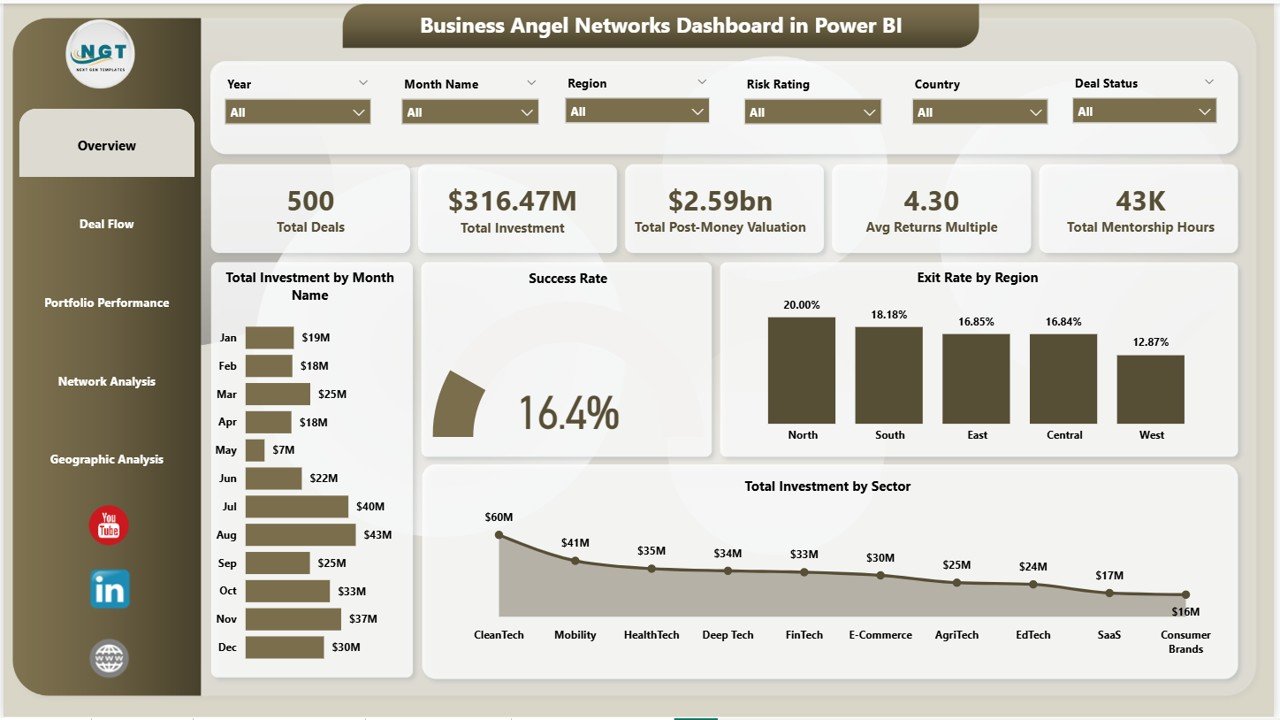
Business Angel Networks Dashboard in Power BI – Overview Page
📊 Business Angel Networks Dashboard in Power BI vs. Tableau vs. Paid Portfolio SaaS — Where This Fits
| Feature | Business Angel Networks Dashboard in Power BI | Tableau Public / Desktop | Visible Capital / Carta |
|---|---|---|---|
| Cost | $17.99 one-time | $70–$75 / user / month | $500–$2,000 / year |
| Platform | Power BI Desktop (free) | Tableau Desktop required | Web-only SaaS |
| Setup time | Under 10 minutes | 2–8 hours build time | 2–5 days onboarding |
| Angel-specific KPIs | ✅ Pre-built (Returns Multiple, Mentorship Hours, Exit Rate) | ❌ Build from scratch | ✅ Partial coverage |
| Geographic Analysis | ✅ Region + Country breakdowns | ✅ Available | ⚠️ Limited in base tier |
| Customizable fields | ✅ Full DAX flexibility | ✅ Available | ⚠️ Vendor-controlled |
| Offline access | ✅ Full offline via Desktop | ⚠️ Limited | ❌ Cloud-only |
| Year-1 cost (5 users) | $17.99 total | ~$4,500 | ~$1,000–$10,000 |
| No subscription required | ✅ | ❌ | ❌ |
For angel networks that want 5-page investment analytics without paying SaaS subscription fees, the Business Angel Networks Dashboard in Power BI sits in the sweet spot.
👥 Who This Template Is For — and Who It’s Not For
✅ This template is built for:
- Angel network managers tracking 10–200 active deals across sectors and regions
- Independent angel investors who want portfolio-level returns and deal status visibility
- Family offices and seed-stage funds analyzing deal flow by funding stage and industry
- Startup accelerators and incubators monitoring portfolio company performance
- Finance professionals building investment reports for LP updates or board presentations
❌ This template is NOT for:
- Enterprise VC firms needing SOC 2-compliant, multi-team SaaS platforms with API integrations
- Users without Power BI Desktop installed (free download required)
- Teams needing real-time live data streaming — this dashboard uses static/refreshable datasets
⚙️ How to Use the Business Angel Networks Dashboard in Power BI
- Download and unzip the .zip file from your purchase confirmation email.
- Open the .pbix file in Power BI Desktop (free from microsoft.com/powerbi).
- Review sample data — familiarize yourself with the data model and column structure.
- Replace sample data with your own deal records in the source Excel or CSV file.
- Click Refresh in Power BI Desktop — all 5 pages, KPI cards, and charts update automatically.
- Apply slicers on any page to filter by sector, region, funding stage, investor type, or deal status.
- Share reports by publishing to Power BI Service or exporting pages to PDF for LP presentations.
💼 Real-World Use Cases
Priya manages a 40-member angel network in Southeast Asia. She uses the Business Angel Networks Dashboard in Power BI to track 80+ portfolio companies across 6 sectors. Each quarter she filters by region and funding stage to prepare LP update presentations — a task that previously took 3 days of spreadsheet work now takes under an hour.
Michael is an independent angel investor with 25 direct deals. He connects his deal tracker spreadsheet to the Power BI dashboard and instantly sees which sectors deliver the highest returns multiple, which deals are stalled by status, and how his mentorship hours correlate with portfolio company success rates.
A startup accelerator in Berlin tracks 60 cohort companies using this dashboard to benchmark exit rates by region, identify the funding stages with the best post-money valuation growth, and report geographic investment spread to their institutional backers — without paying $2,000/year for a portfolio management SaaS tool.
❓ Frequently Asked Questions
What KPIs does the Business Angel Networks Dashboard in Power BI track?
The Business Angel Networks Dashboard in Power BI tracks 5 headline KPIs: Total Deals, Total Investment, Total Post-Money Valuation, Avg Returns Multiple, and Total Mentorship Hours. These update automatically when you replace the sample data and refresh the Power BI report.
Do I need a Power BI Pro subscription to use this dashboard?
No. The Business Angel Networks Dashboard in Power BI works fully with the free Power BI Desktop application. You only need Power BI Pro or Premium if you want to publish and share the report via Power BI Service with multiple team members in the cloud.
How long does setup take for the Business Angel Networks Dashboard in Power BI?
Setup takes under 10 minutes. Open the .pbix file in Power BI Desktop, connect it to your own deal data source (Excel or CSV), and click Refresh. All 5 dashboard pages, KPI cards, and 20+ visuals update instantly — no DAX coding or Power Query expertise required.
How does this compare to Carta or Visible Capital?
The Business Angel Networks Dashboard in Power BI costs $17.99 as a one-time purchase versus $500–$2,000/year for Carta or Visible Capital. It covers angel-specific KPIs including Returns Multiple, Mentorship Hours, and Exit Rate by Region that most SaaS platforms don’t expose in their base tiers.
Can I customize the dashboard to add my own metrics?
Yes. The .pbix file is fully editable in Power BI Desktop. You can add new DAX measures, create additional visuals, modify existing charts, and add pages to match your specific angel network’s reporting requirements.
What data format does this dashboard use?
The Business Angel Networks Dashboard in Power BI uses an Excel-linked data model by default. You can replace the source Excel file with your own deal records following the same column structure, or reconnect to any Power BI-compatible data source including CSV, SQL, or SharePoint lists.
Is there an Excel version of this dashboard available?
Yes. The Business Angel Networks Dashboard in Excel is also available on NextGenTemplates with pivot-driven charts and slicers for users who prefer working in Microsoft Excel.
👤 About the Author
Built by PK — Microsoft Certified Professional with 15+ years of Excel, Google Sheets, and Power BI experience. Founder of NextGenTemplates, reaching 300K+ subscribers across YouTube channels (@PK-AnExcelExpert, @NextGenTemplates, @NeoTechNavigators). Every template is hand-built and tested before release.
🔗 Explore Related Templates
- 🔹 VC Portfolio Dashboard in Power BI — Track fund-level portfolio performance, IRR, and MOIC across venture investments.
- 🔹 Investor Relations Dashboard in Power BI — Manage LP communications, capital calls, and investor reporting in one Power BI report.
- 🔹 Business Angel Networks Dashboard in Excel — The same 5-page angel network analytics in Microsoft Excel with pivot tables and slicers.
- 🔹 Investment Banking KPI Dashboard in Excel — Deal pipeline, valuation metrics, and revenue tracking for investment banking teams.
📖 Click here to read the Detailed Blog Post
🎥 Visit our YouTube channel for step-by-step video tutorials
👉 YouTube.com/@NextGenTemplates
📅 Last updated: May 2026
Watch the step-by-step video tutorial:
YouTube


Reviews
There are no reviews yet.