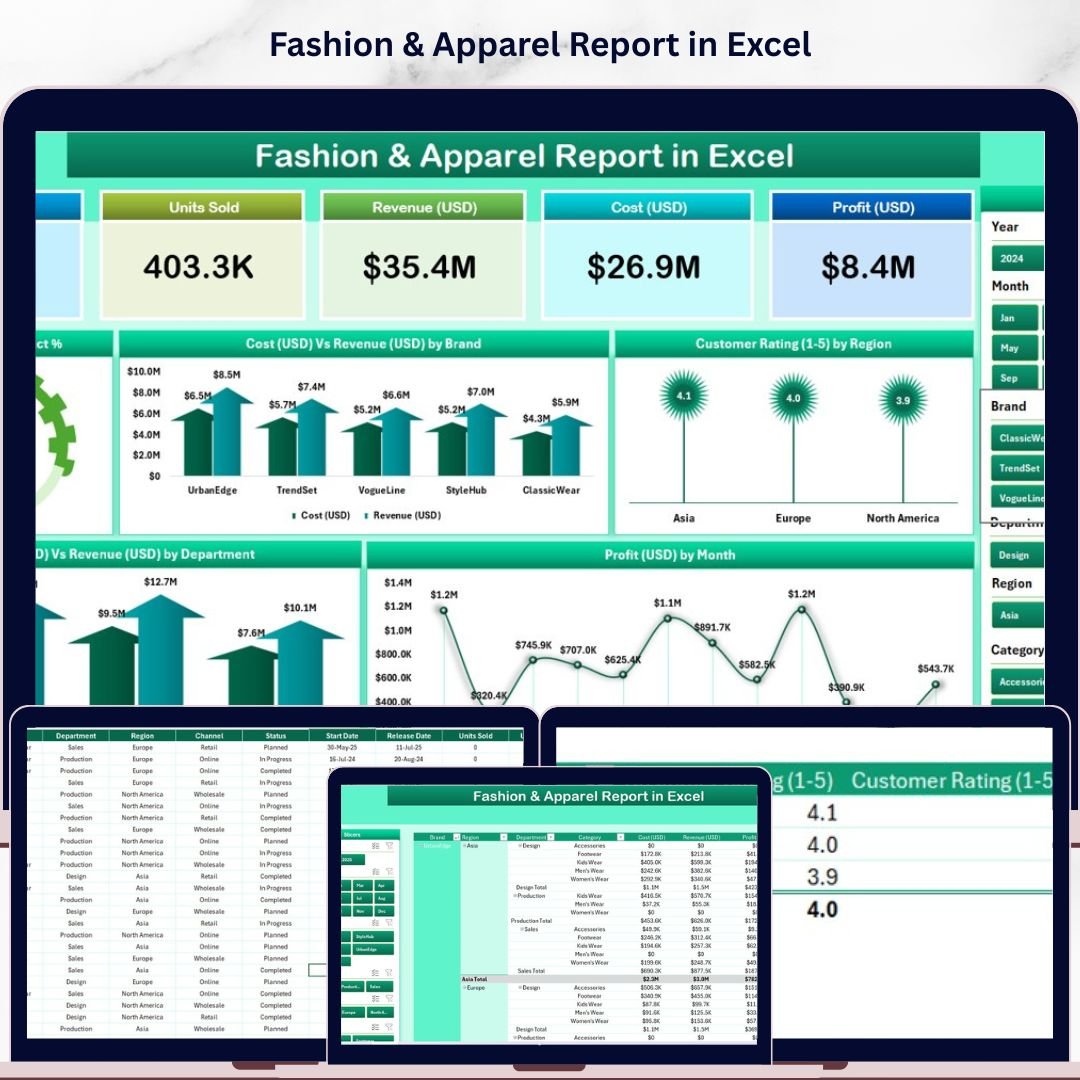

The Fashion & Apparel Report in Excel tracks 5 retail KPIs across 2 dedicated report pages, with 5 pre-built charts covering completion rates, cost versus revenue by brand, customer ratings by region, cost versus revenue by department, and monthly profit trends. Setup takes under 10 minutes — replace the sample data and every chart and KPI card updates automatically.
🌍 Join 8,400+ teams in 40+ countries using NextGenTemplates to replace paid SaaS tools with one-time-purchase Excel, Google Sheets, Power BI, and HTML templates.
✅ Instant download · One-time payment · No subscription · No per-user fees · Lifetime access
🔑 Key Features of Fashion & Apparel Report in Excel
🔹 5 KPI Summary Cards — at-a-glance metrics on the Summary page covering total products, completed product count, total cost, total revenue, and average customer rating across all fashion brands and apparel categories.
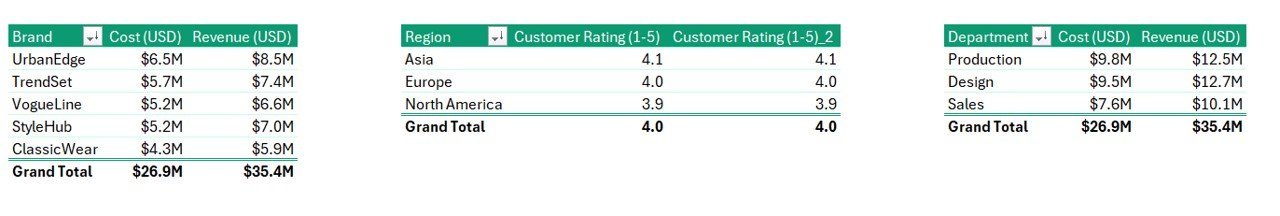
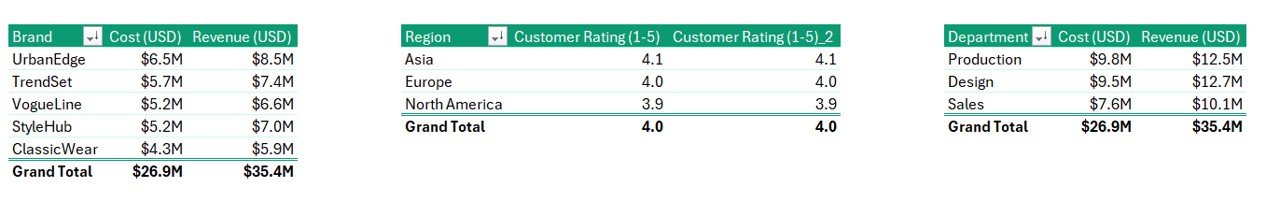
🔹 5 Interactive Charts — Completed Product %, Cost Vs Revenue by Brand, Customer Rating by Region, Cost Vs Revenue by Department, and Profit by Month give fashion retailers and apparel managers a 360° view of brand-level profitability and regional satisfaction. The report tracks 5 key performance indicators that update automatically when new data is entered in the Data Sheet.
🔹 Dynamic Slicers — a right-side slicer on the Summary page and a left-side slicer on the Report page let you filter all charts and tables by brand, department, region, or time period with a single click — no formulas required.
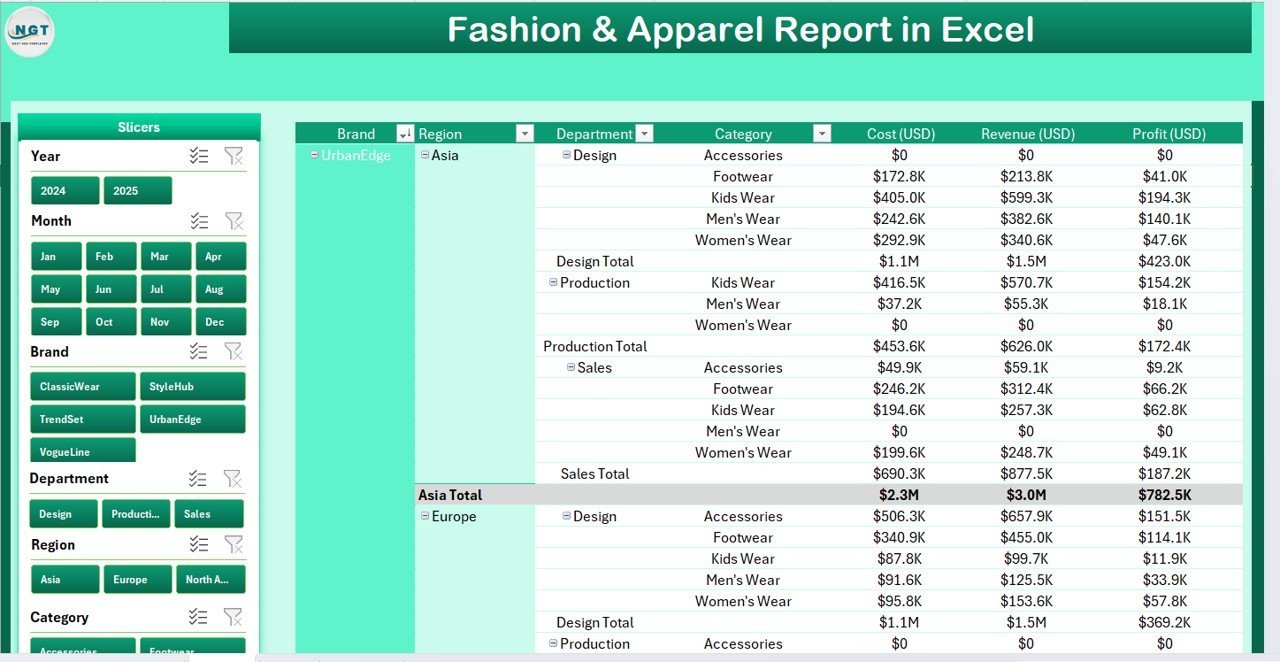
🔹 Information Table on Report Page — a filterable product-level table showing individual SKU statuses, brand assignments, costs, revenues, customer ratings, and region for detailed drill-down across your full apparel catalog.
🔹 Data Sheet + Support Sheet — clean data entry sheet for logging fashion products, plus a reference support sheet for lookup values (brands, departments, regions, statuses) that drives dropdown consistency across the file.
📦 What’s Inside the Fashion & Apparel Report in Excel
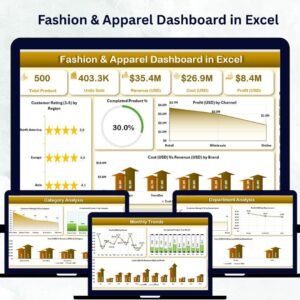
Page 1 — Summary Page: The main reporting view features five KPI cards along the top showing headline metrics at a glance. A right-side slicer panel filters all charts simultaneously. Five charts form the analytical core: Completed Product % (overall fulfillment rate), Cost Vs Revenue by Brand (brand-level financial performance), Customer Rating by Region (geographic satisfaction distribution), Cost Vs Revenue by Department (apparel category profitability), and Profit by Month (monthly profit trend).
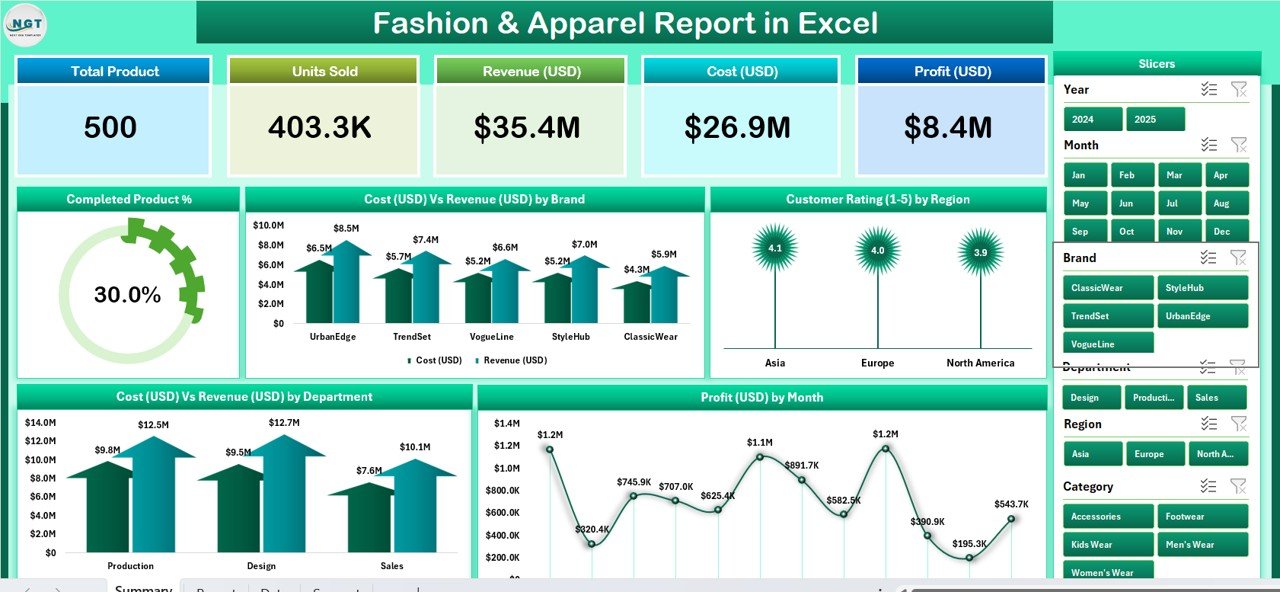
Summary Page — 5 KPI Cards, Right-Side Slicer, and 5 Charts
Page 2 — Report Page: A filterable information table with a left-side slicer. Drill into individual fashion products — brand assignments, costs, revenues, completion status, customer ratings, and region. Ideal for weekly merchandising reviews and brand performance meetings.

Report Page — Left-Side Slicer and Information Table
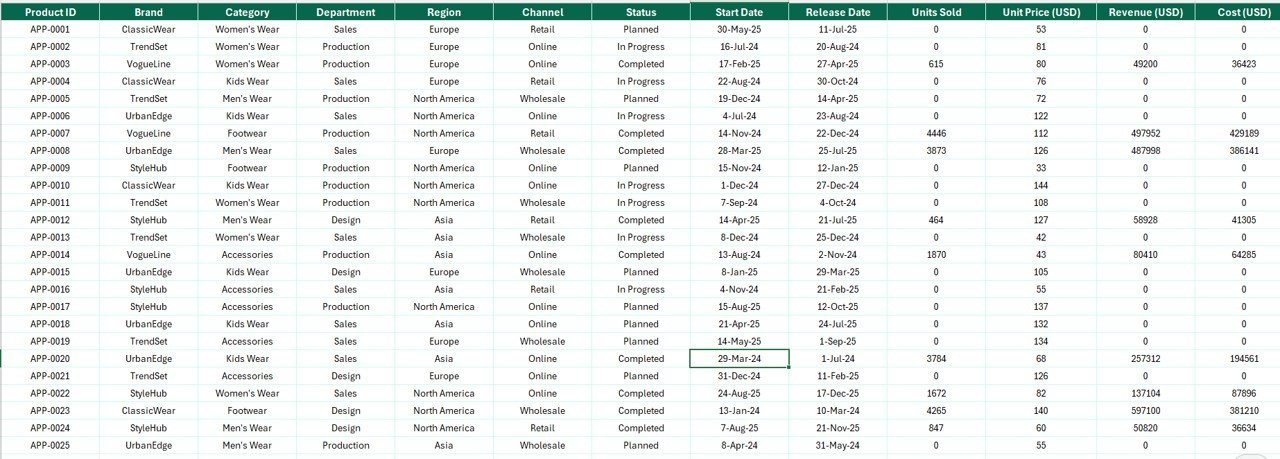
Data Sheet: All raw apparel and product data lives here. Add new fashion items, update statuses, enter actual costs, log revenues, and track customer ratings. Every other page references this sheet dynamically — no copy-paste needed.
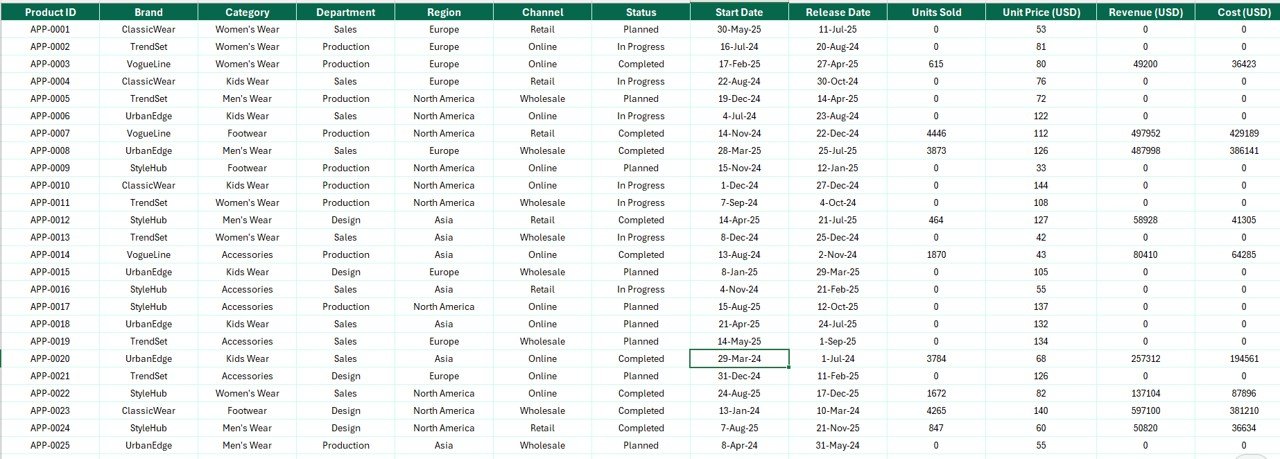
Data Sheet — Clean Data Entry for All Fashion Products
Support Sheet: Contains lookup reference tables for brands, departments, regions, and status values. Update the support sheet to customize dropdown options throughout the file without touching any formulas.
Support Sheet — Reference Tables for Dropdown Values
📊 Fashion & Apparel Report in Excel vs. Google Sheets Version vs. Paid SaaS — Where This Fits
| Feature | Fashion & Apparel Report in Excel | Google Sheets Equivalent | Shopify Reports / Lightspeed Retail |
|---|---|---|---|
| Cost | $7.99 one-time | Free (manual build) | $29–$299/month |
| Platform | Microsoft Excel (offline + online) | Cloud only | SaaS (cloud only) |
| Setup time | Under 10 minutes | 10–15 min | Days + onboarding |
| Slicer-based filtering | ✅ Pre-built | Limited | ✅ Yes (paid tier) |
| Cost Vs Revenue by Brand | ✅ 5 pre-built charts | Manual build required | ✅ Paid tier only |
| Customer Rating by Region | ✅ Yes | Manual build required | Add-on required |
| Offline access | ✅ Full offline use | Limited | ❌ No |
| Year-1 cost (5 users) | $7.99 total | $0 but no pre-built charts | $1,740–$17,940/year |
For fashion brands, apparel retailers, and merchandising teams that need professional reporting without monthly SaaS fees, the Fashion & Apparel Report in Excel sits in the sweet spot.
👥 Who This Template Is For — and Who It’s Not For
✅ This template is built for:
- Fashion brand owners and apparel retailers tracking brand-level cost, revenue, and profit margins across multiple categories
- Merchandising managers who need weekly or monthly reporting on product performance, completion rates, and customer ratings
- Boutique store managers running multi-region operations who want a single-file overview of brand performance and regional satisfaction
- Wholesale apparel businesses presenting profit-by-month trends and brand contribution to leadership without paying $29–$299/month for SaaS reports
❌ This template is NOT for:
- Enterprise fashion retailers with 1,000+ SKUs needing real-time POS integration and multi-store inventory sync (use Shopify Plus or Lightspeed Retail)
- Teams requiring automated reorder-point notifications or supplier purchase order generation built directly into the report
⚙️ How to Use the Fashion & Apparel Report in Excel
- Download and open the file in Microsoft Excel 2016 or later.
- Go to the Support Sheet and customize brand names, departments, regions, and status values to match your fashion business.
- Enter your product data in the Data Sheet — one row per product with cost, revenue, brand, region, department, status, and customer rating.
- Use the slicers on the Summary and Report pages to filter all charts and the information table instantly by brand, department, or region.
- Export the Summary Page as PDF using File → Export for professional buyer or leadership reporting.
💼 Real-World Use Cases
Anjali runs a fashion boutique in Bengaluru with three retail locations. Every Monday morning she opens the Fashion & Apparel Report in Excel, enters last week’s product sales and customer ratings, and uses the Cost Vs Revenue by Brand chart to identify which fashion brands drove the highest margin — and which underperformers to negotiate harder with at the next buying season.
Marcus oversees merchandising for an apparel chain with stores across four regions. His team handles 200–400 active SKUs per season. He uses the Customer Rating by Region chart to flag regions where satisfaction has dipped, and the Profit by Month chart to share monthly profit trends with the leadership team in operations reviews — without paying for an enterprise retail BI tool.
❓ Frequently Asked Questions
What KPIs does the Fashion & Apparel Report in Excel track?
The Fashion & Apparel Report in Excel tracks 5 KPIs: Completed Product %, Cost Vs Revenue by Brand, Customer Rating by Region, Cost Vs Revenue by Department, and Profit by Month. All metrics update automatically when you add or edit data in the Data Sheet.
Do I need macros or add-ins to use this template?
No. The Fashion & Apparel Report in Excel uses only native Excel features — pivot charts, slicers, and standard formulas. No macros, VBA, or add-ins are required. It works in Excel 2016, 2019, 2021, and Microsoft 365.
Can I add more brands, departments, or regions to the report?
Yes. Add new entries to the Support Sheet dropdown lists, then enter corresponding product data in the Data Sheet. The charts and slicers automatically pick up the new values — no formula edits or chart configuration needed.
How does this compare to Shopify Reports or Lightspeed Retail for fashion analytics?
The Fashion & Apparel Report in Excel costs $7.99 once versus $29–$299 per month for SaaS retail tools. It covers the core reporting needs — cost vs revenue by brand, customer ratings, profit trends — without subscriptions, per-user fees, or POS integration overhead.
Can I export the report as a PDF to share with buyers or leadership?
Yes. Use Excel’s built-in File → Export → Create PDF/XPS to export the Summary or Report page as a polished PDF. The layout is designed to print cleanly on A4 or Letter paper for buyer meetings and executive reviews.
Is this template compatible with Microsoft 365 online?
The template is optimized for Excel desktop (2016+). Microsoft 365 online supports most features, but slicer interaction and some chart formatting may differ slightly from the desktop version of the Fashion & Apparel Report in Excel.
👤 About the Author
Built by PK — Microsoft Certified Professional with 15+ years of Excel, Google Sheets, and Power BI experience. Founder of NextGenTemplates, reaching 300K+ subscribers across YouTube channels (@PK-AnExcelExpert, @NextGenTemplates, @NeoTechNavigators). Every template is hand-built and tested before release.
🔗 Explore Related Templates
Looking for more Excel Report Templates? Here are popular picks from the fashion and retail department:
- Fashion & Apparel KPI Dashboard in Excel — full KPI dashboard with slicers and multiple analysis pages for fashion brand management
- Fashion & Apparel Dashboard in Excel — comprehensive dashboard with deeper drill-down for apparel performance tracking
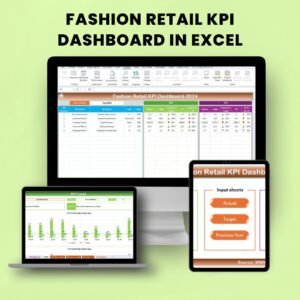
- Fashion Retail KPI Dashboard in Excel — retail-focused KPI scorecard for boutique chains and apparel stores
Also available as: Fashion & Apparel KPI Dashboard in Power BI · Fashion KPI Scorecard in Google Sheets
Explore our full range of Excel Dashboard Templates for retail, merchandising, and apparel operations.
📖 Click here to read the Detailed Blog Post
🎥 Visit our YouTube channel for step-by-step video tutorials
👉 YouTube.com/@NextGenTemplates
📅 Last updated: May 2026


Reviews
There are no reviews yet.