

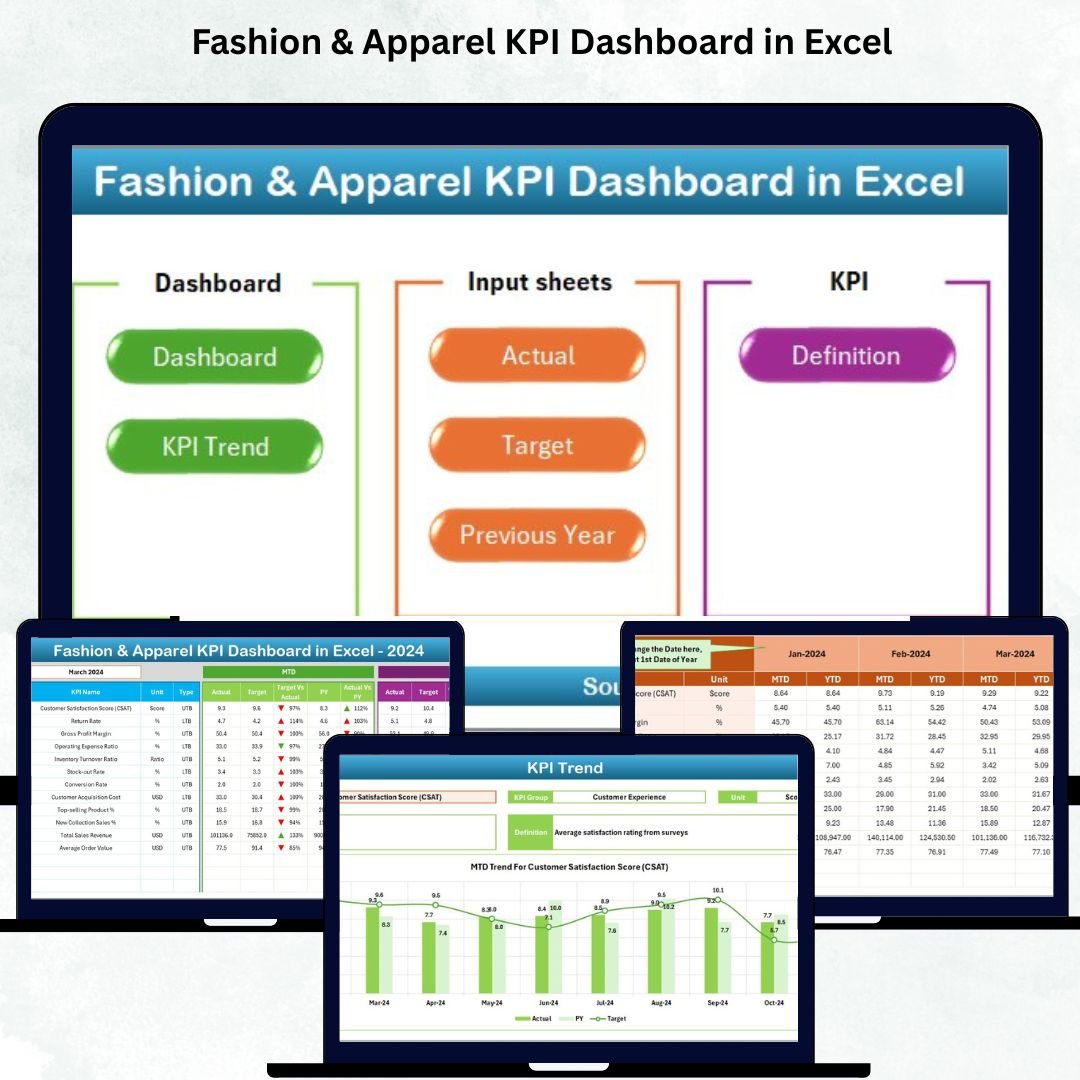


In the ever-changing world of fashion, data is the new runway star 🌟. Every successful fashion brand — from high-end designers to emerging boutiques — depends on accurate insights to make informed decisions. The Fashion & Apparel KPI Dashboard in Excel is your ultimate solution to monitor, measure, and master every business metric — all from one powerful, easy-to-use Excel file 💼👗.Fashion & Apparel KPI Dashboard in Excel
This ready-to-use dashboard transforms raw data into elegant visuals and interactive charts, helping you track sales, manage stock, evaluate performance, and boost profitability — without needing any coding or expensive software.
✨ Key Features of the Fashion & Apparel KPI Dashboard in Excel
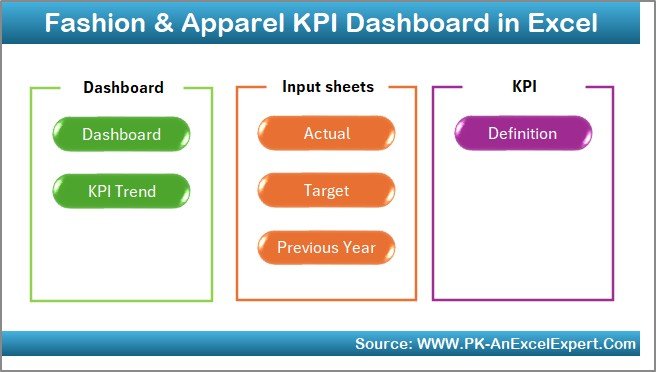
✅ 7 Pre-Built Sheets for End-to-End Analysis: Includes Summary, Dashboard, Trend, Actual Numbers, Target, Previous Year, and KPI Definition Sheets for a complete workflow.
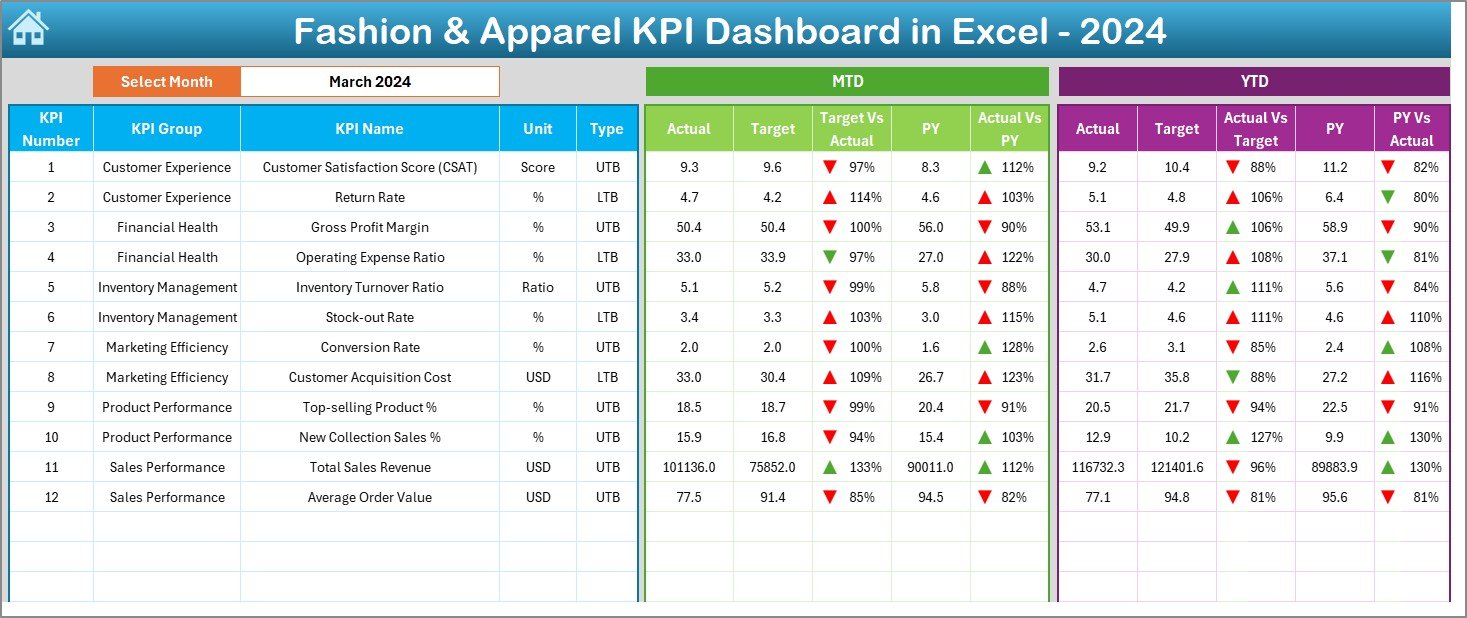
📊 Dynamic Dashboard: Instantly visualize Month-to-Date (MTD) and Year-to-Date (YTD) KPIs with real-time updates and colorful trend indicators.
🧭 One-Click Navigation Buttons: Move effortlessly between pages using easy navigation links designed for quick access.
📈 Visual Performance Insights: See progress through conditional formatting — green arrows for improvement and red for decline.
📅 Time-Saving Automation: Automatically updates all charts and tables as soon as you input your latest data.
💡 Customizable for Any Fashion Brand: Perfect for retail, wholesale, export, or e-commerce businesses.
💰 Cost-Effective & Offline Ready: 100% Excel-based — no need for cloud tools or coding skills.
🧩 What’s Inside the Fashion & Apparel KPI Dashboard in Excel
This Excel file is built with precision to simplify your fashion business analysis. Inside, you’ll find:
👚 Summary Page: Your main control center with six navigation buttons to jump between key pages.
📊 Dashboard Sheet: The heart of the file — visualize Actual, Target, and Previous Year data instantly.
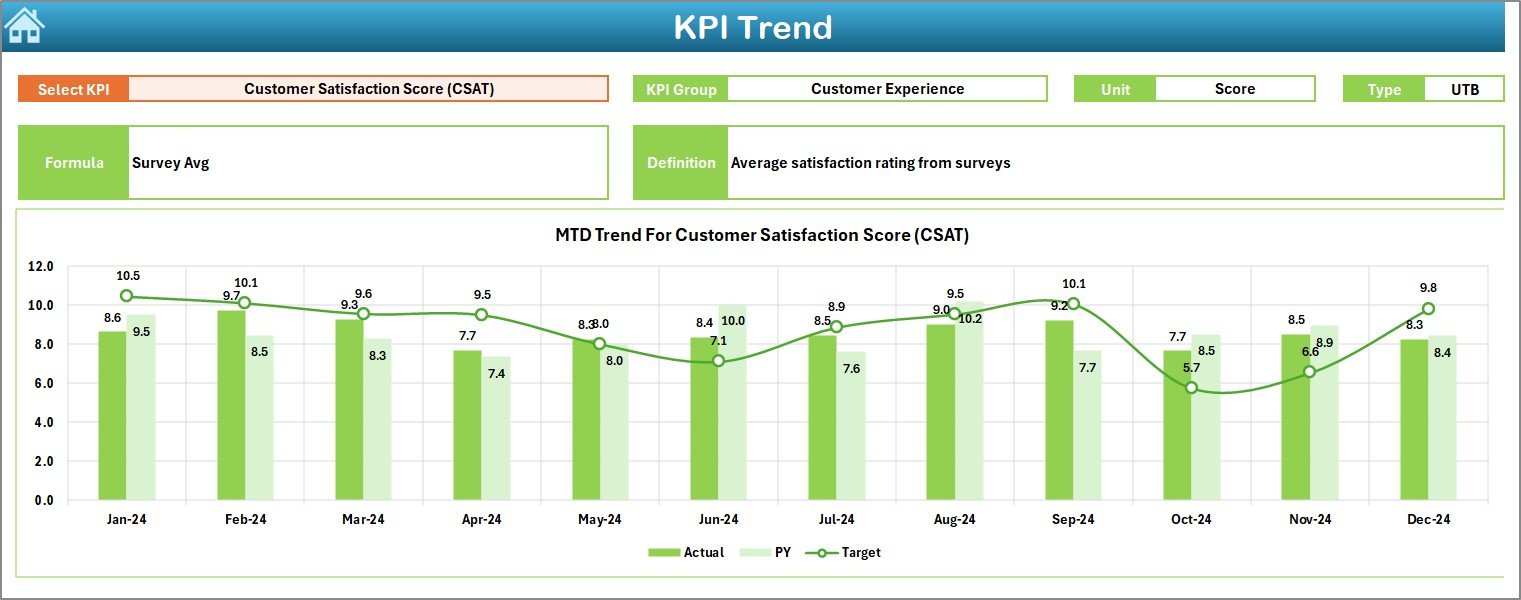
📉 Trend Sheet: Analyze month-by-month performance trends with KPI-based drop-down selections.
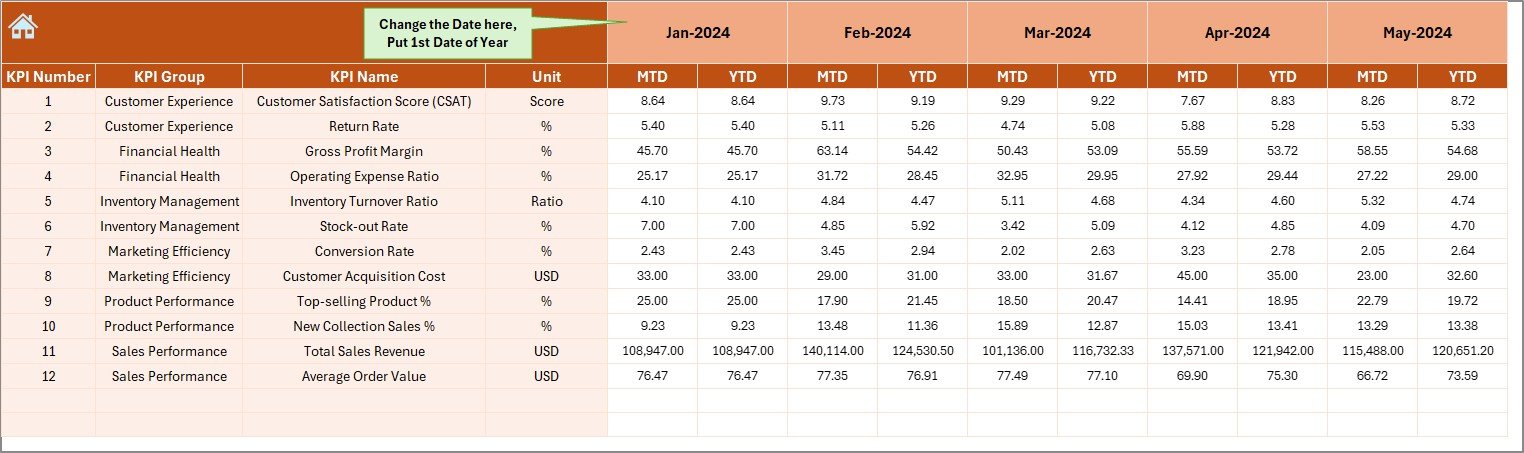
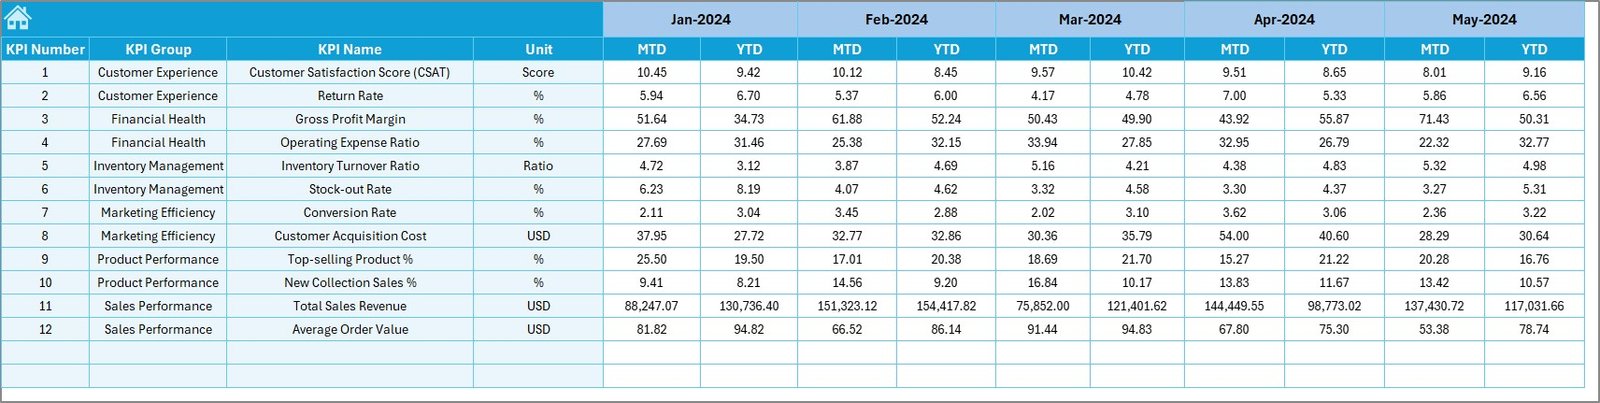
🧾 Actual Numbers Input Sheet: Enter real-time business data to power your dashboard automatically.
🎯 Target Sheet: Define monthly and yearly targets for each KPI to stay aligned with your business goals.
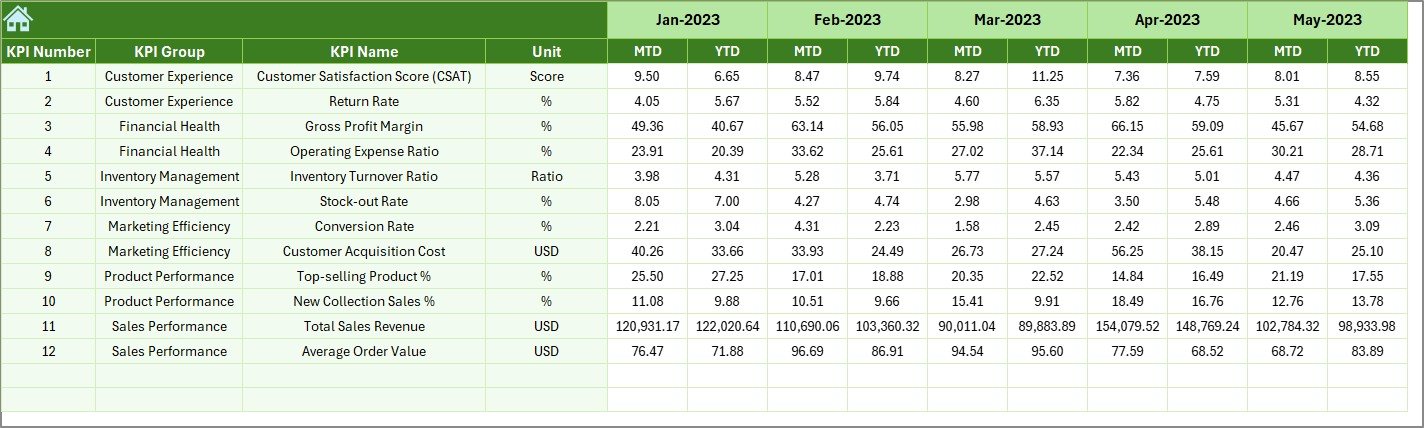
📆 Previous Year Numbers Sheet: Benchmark against historical data for year-over-year comparison.Fashion & Apparel KPI Dashboard in Excel ..
📘 KPI Definition Sheet: Acts as your reference guide — listing KPI name, unit, formula, and type (UTB/LTB).
Together, these sheets offer a complete performance management system tailored for the fashion industry.
🪄 How to Use the Fashion & Apparel KPI Dashboard in Excel
1️⃣ Download and Open the Template
Get started instantly — no setup required.
2️⃣ Define Your KPIs
Add or edit KPIs in the KPI Definition sheet according to your business.
3️⃣ Set Monthly Targets
Enter MTD and YTD goals in the Target Sheet for your chosen metrics.
4️⃣ Input Real Data
Record your actual numbers in the Actual Numbers Input Sheet.
5️⃣ Add Previous Year Data
Include historical data for trend comparison.
6️⃣ Review Performance
Open the Dashboard sheet to see your KPIs visualized beautifully.
7️⃣ Track Long-Term Trends
Use the Trend Sheet to identify growth opportunities or performance gaps.
💡 Within minutes, your Excel file turns into a fully interactive performance dashboard — giving you clarity, confidence, and control.
👥 Who Can Benefit from This Fashion & Apparel KPI Dashboard in Excel
💼 Fashion Retailers: Track sales, profit, and stock turnover with precision.
🏭 Apparel Manufacturers: Monitor production output, efficiency, and material costs.
🛍️ E-commerce Clothing Brands: Evaluate online conversion, returns, and engagement rates.
🎨 Design Studios: Analyze customer preferences and seasonal design performance.
🌎 Export Houses: Compare regional performance and shipment targets.
📊 Consultants & Analysts: Get a ready framework for client reporting and business reviews.
Whether you’re running a luxury label, a boutique brand, or an online store, this dashboard provides the insights you need to stay in style — both creatively and financially.
🔗 Click here to read the Detailed Blog Post
Watch the step-by-step video tutorial:
📺 Visit our YouTube channel to learn step-by-step video tutorials
Compatibility and Requirements
- Works in Microsoft Excel desktop (Excel 2016 or later, or Microsoft 365).
- The Trend sheet uses drop-down selections, and the navigation buttons move between sheets.
- Microsoft’s guide Create a drop-down list explains the Excel feature this file is built on.
Frequently Asked Questions
Which sheets are in the file?
Seven: Summary, Dashboard, Trend, Actual Numbers Input, Target, Previous Year Numbers and KPI Definition.
Does it show MTD and YTD results?
Yes. The Dashboard sheet shows Month-to-Date and Year-to-Date values against target and previous year.
What do UTB and LTB mean in the KPI Definition sheet?
They mark the KPI type: UTB means upper the better and LTB means lower the better, so the arrows show the right direction.
Can I add my own fashion KPIs?
Yes. Add or edit KPIs in the KPI Definition sheet, then enter targets and actual numbers for them.
Related Fashion and Apparel Templates
- Fashion and Apparel KPI Dashboard in Power BI: the Power BI edition
- Fashion and Apparel Dashboard in Excel: a sales and operations dashboard
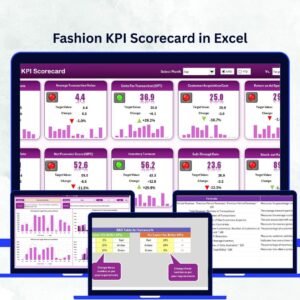
- Fashion KPI Scorecard in Excel: a scorecard view of fashion KPIs
- Apparel Manufacturing KPI Dashboard in Excel: for garment production
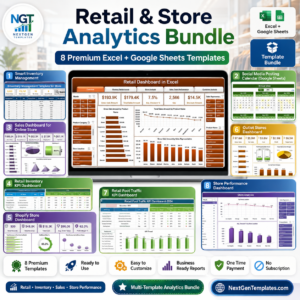
- Retail and Store Analytics Bundle: 8 premium retail templates in one bundle
Browse all Excel KPI dashboards or the Excel dashboards.








Reviews
There are no reviews yet.