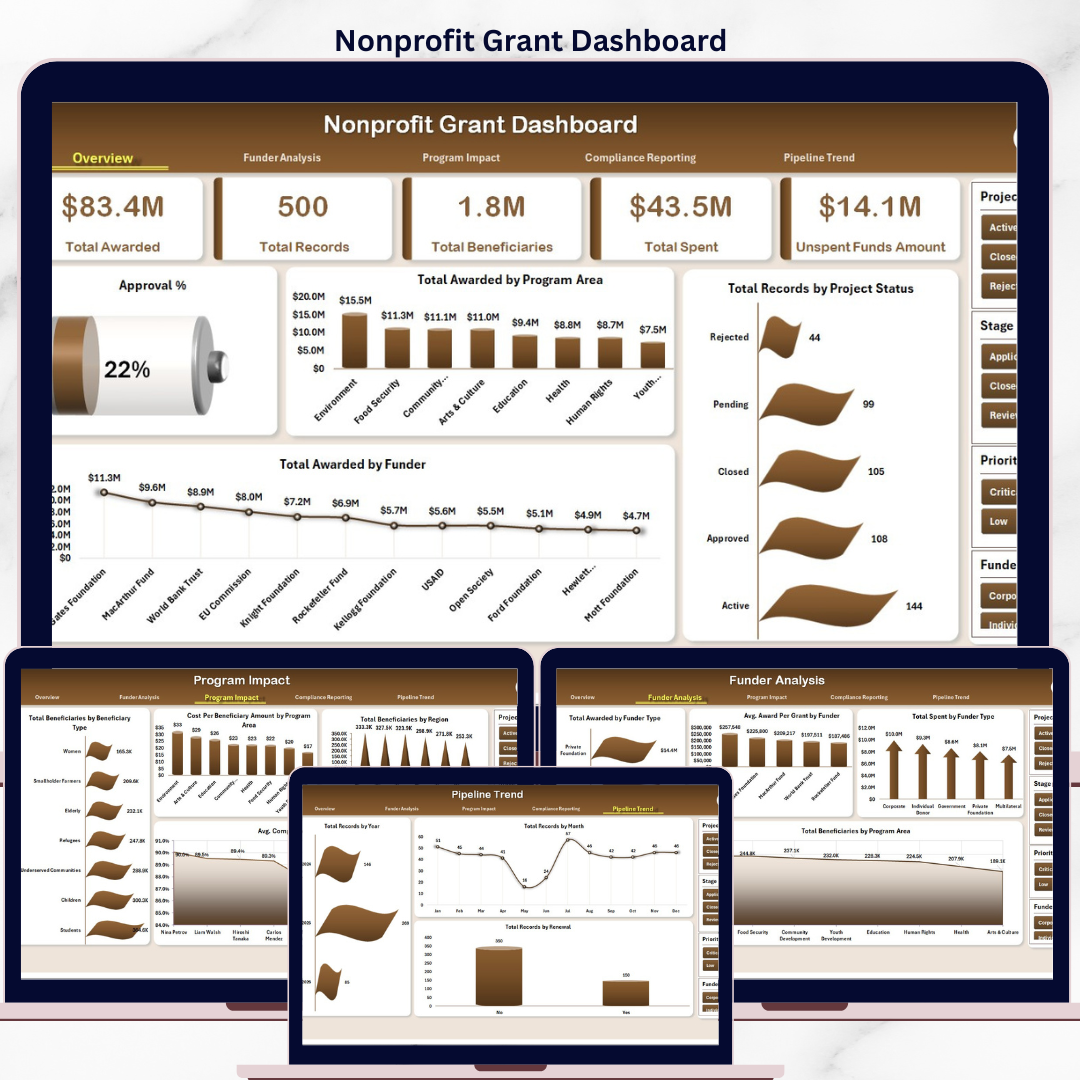


The Nonprofit Grant Dashboard in Excel monitors 5 critical KPIs across 5 interactive analysis pages, with 17 pre-built charts powered by Excel pivot tables and slicers. Your team can filter the entire dashboard instantly by program area, funder type, project status, or grant manager — setup takes under 10 minutes.
🌍 Join 8,400+ nonprofits, foundations, and NGOs in 40+ countries using NextGenTemplates to manage operations with one-time-purchase templates — replacing costly SaaS subscriptions.
✅ Instant download · One-time payment · No subscription · No per-user fees · Lifetime access
🔑 Key Features of the Nonprofit Grant Dashboard in Excel
🔹 5 KPI summary cards — This dashboard tracks Total Awarded, Total Records, Total Beneficiaries, Total Spent, and Unspent Funds Amount in one consolidated view. These five metrics give grant managers an immediate picture of funding health and program reach at a glance.
🔹 17 pre-built charts — Visualizations cover every critical dimension: approval rates, award distribution by program area and funder, project status breakdowns, beneficiary segmentation, cost per beneficiary, compliance scoring, burn rate by grant manager, and pipeline trends by year and month.
🔹 Slicer-powered interactivity — Multi-level slicers let users filter the entire dashboard instantly. No formulas to edit — click a slicer to see filtered results across all charts and KPI cards simultaneously.
🔹 Pivot-table architecture — A hidden Support Sheet houses all pivot tables. Click Data → Refresh All in the Excel Ribbon after updating your data and every chart, KPI card, and analysis view refreshes in seconds.
🔹 Compliance and burn rate tracking — The Compliance Reporting page tracks grants by stage and priority, calculates Burn Rate % by Grant Manager, and shows Total Requested by Month — keeping your team audit-ready year-round.
📦 What’s Inside the Nonprofit Grant Dashboard in Excel
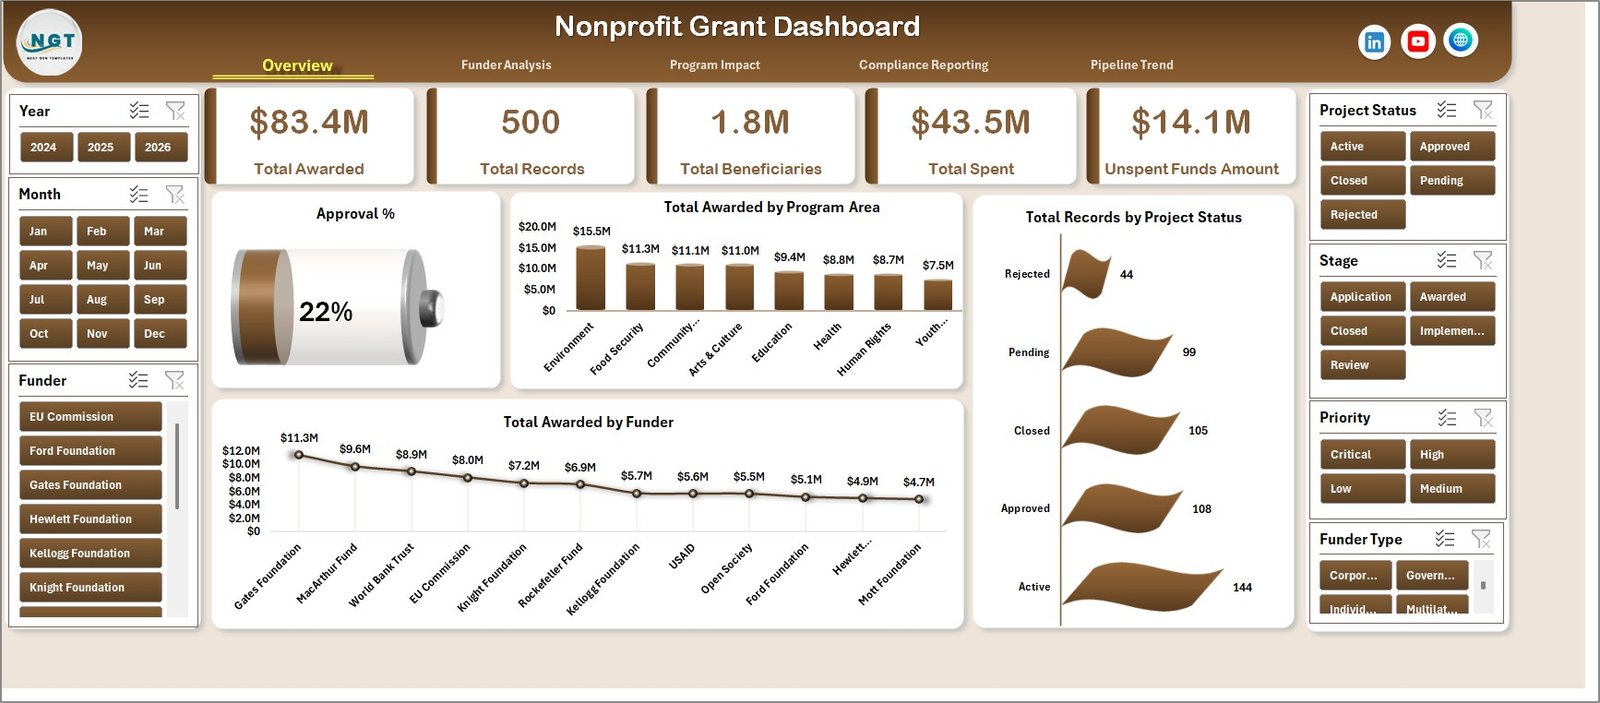
Nonprofit Grant Dashboard — Overview Page
The dashboard contains 7 worksheet tabs covering 5 analysis pages plus a structured Data Sheet and a hidden Support Sheet:
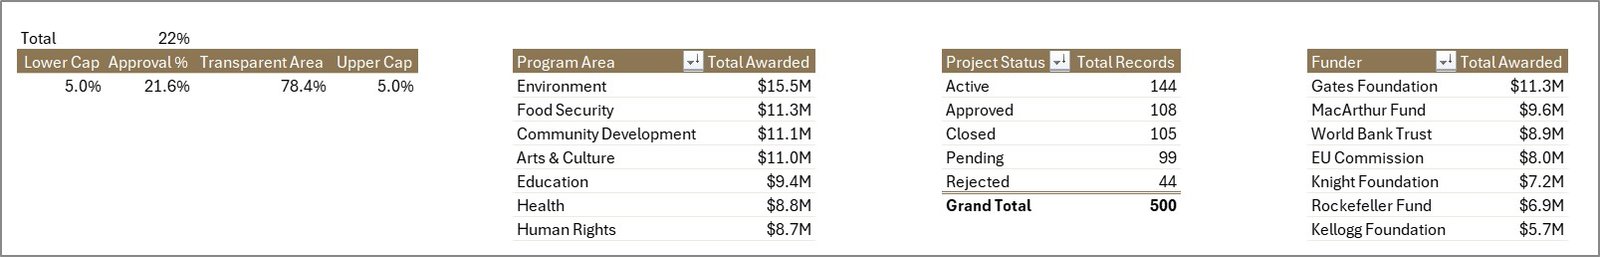
📊 Overview Page — The executive summary view. Five KPI cards (Total Awarded, Total Records, Total Beneficiaries, Total Spent, Unspent Funds Amount) sit at the top with dynamic slicers. Charts include Approval %, Total Awarded by Program Area, Total Records by Project Status, and Total Awarded by Funder.

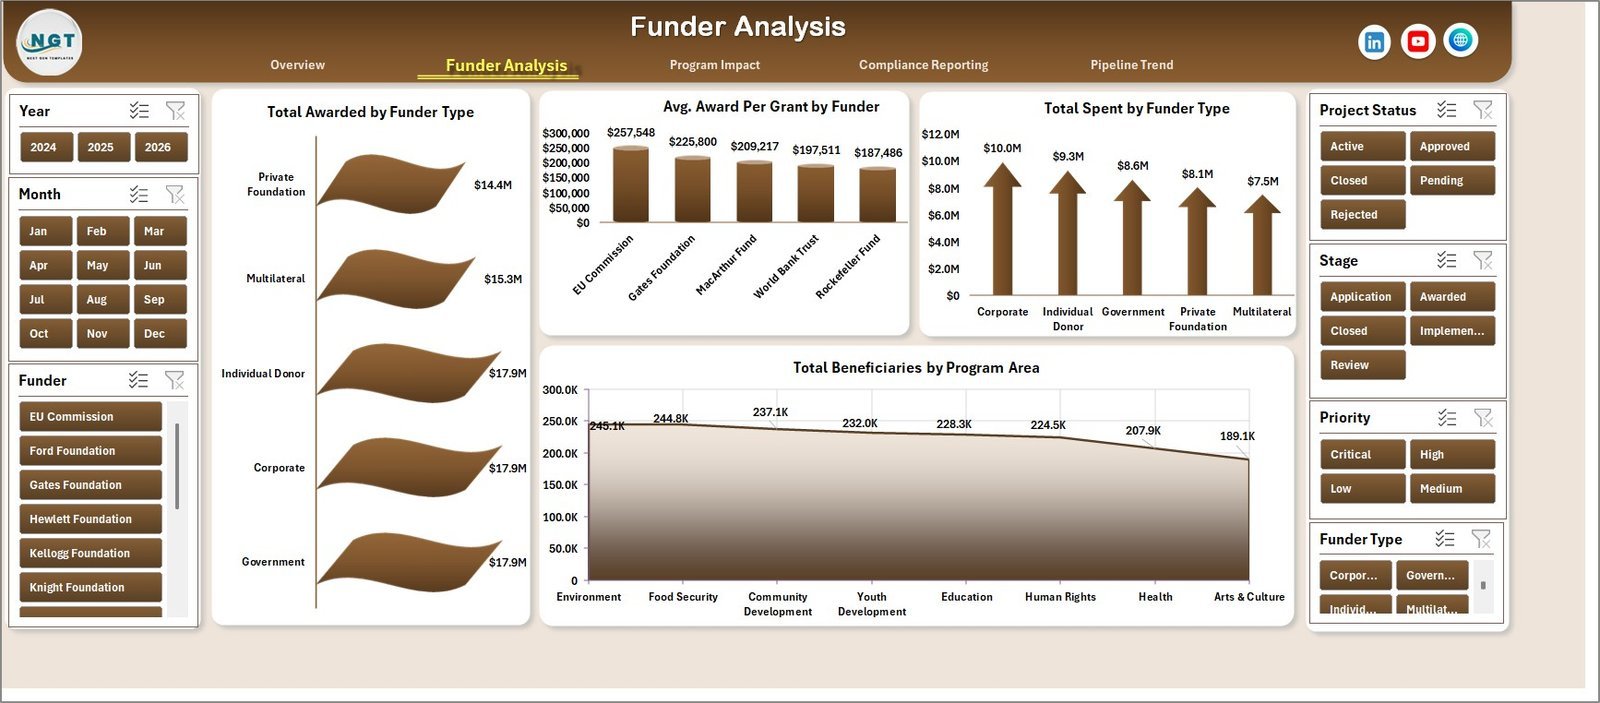
Nonprofit Grant Dashboard — Funder Analysis Page
💰 Funder Analysis Page — Four charts analyze your funder landscape: Total Awarded by Funder Type, Avg. Award Per Grant by Funder, Total Spent by Funder Type, and Total Beneficiaries by Program Area.

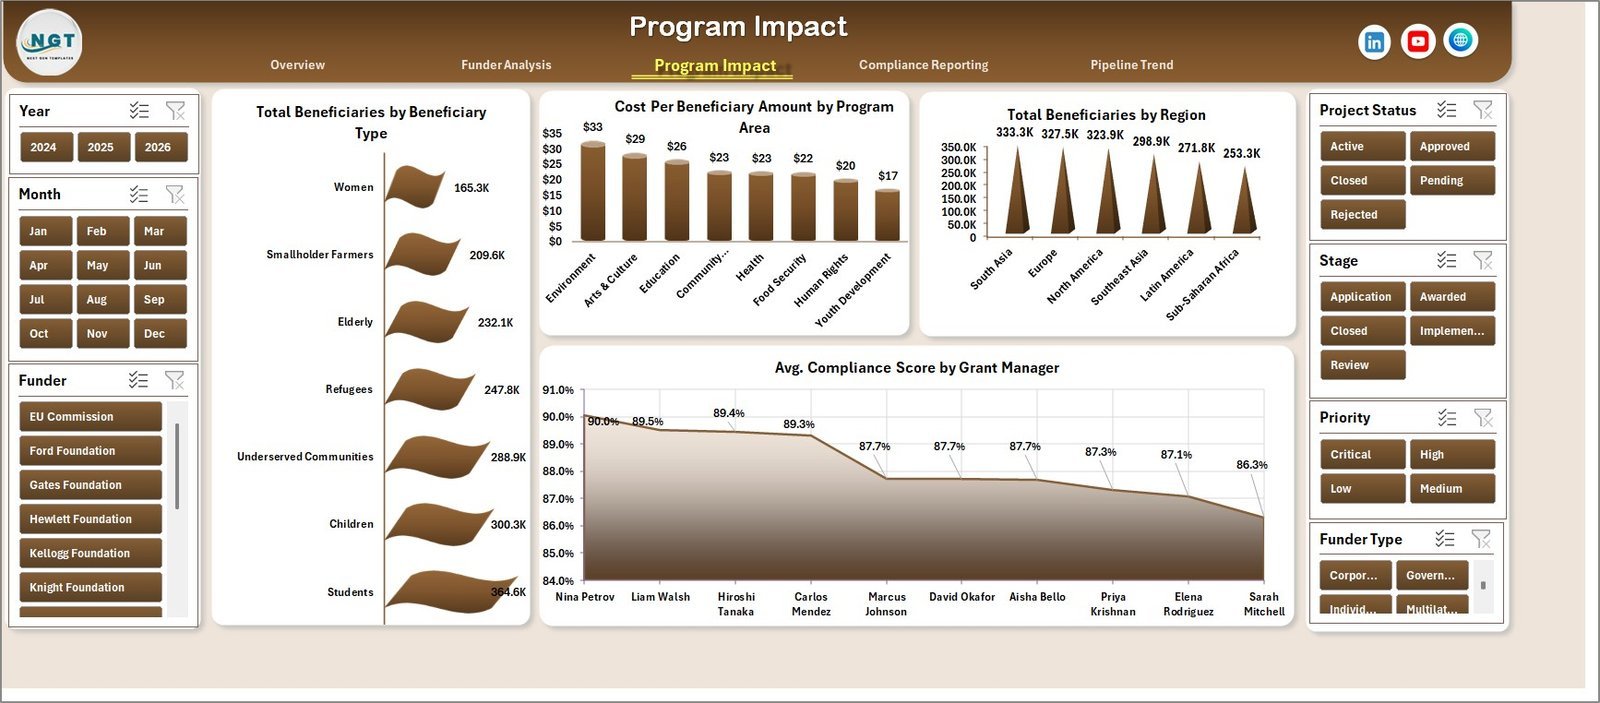
Nonprofit Grant Dashboard — Program Impact Page
🌱 Program Impact Page — Measures reach and cost-effectiveness: Total Beneficiaries by Beneficiary Type, Cost Per Beneficiary Amount by Program Area, Total Beneficiaries by Region, and Avg. Compliance Score by Grant Manager.
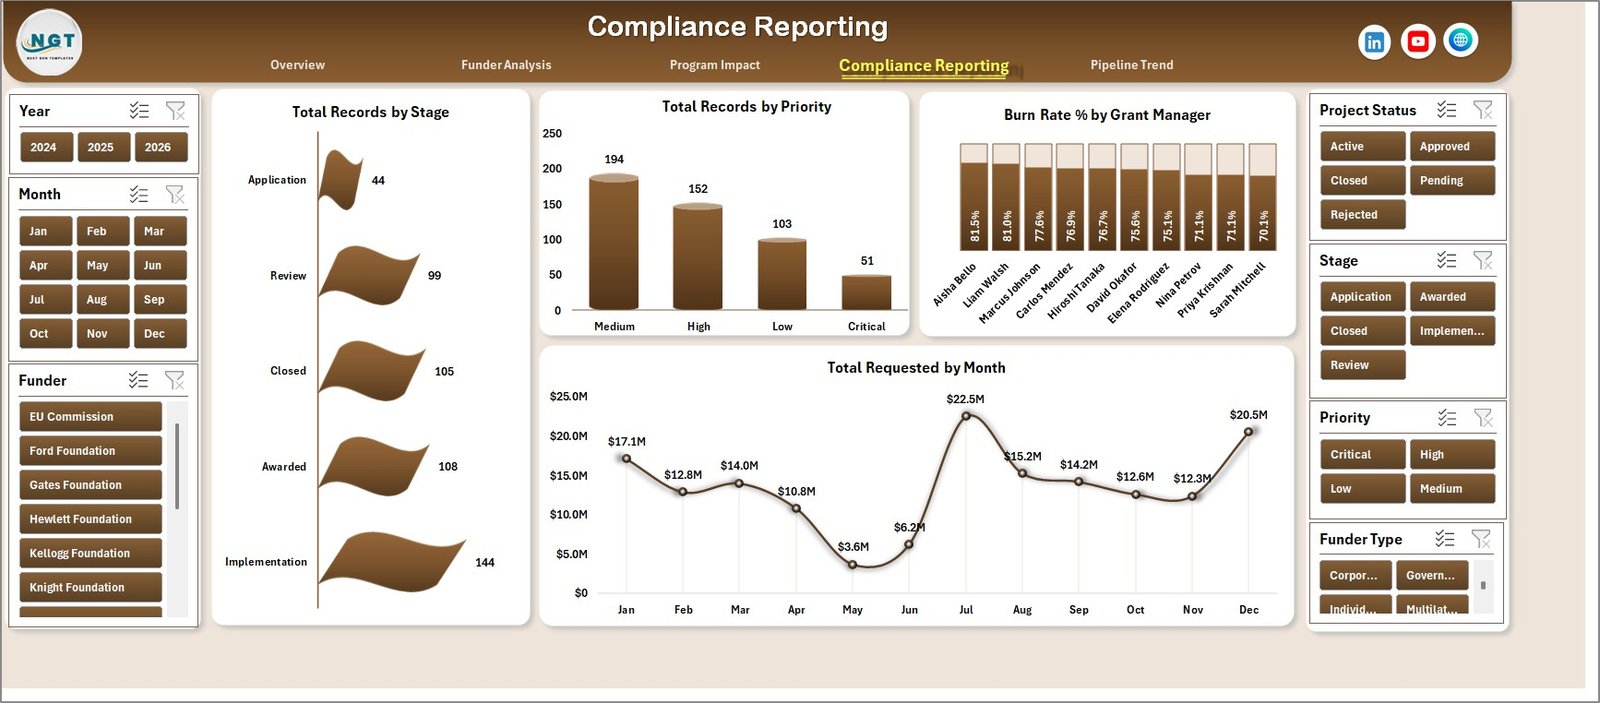
Nonprofit Grant Dashboard — Compliance Reporting Page
📋 Compliance Reporting Page — Keeps your team grant-ready: Total Records by Stage, Total Records by Priority, Burn Rate % by Grant Manager, and Total Requested by Month.
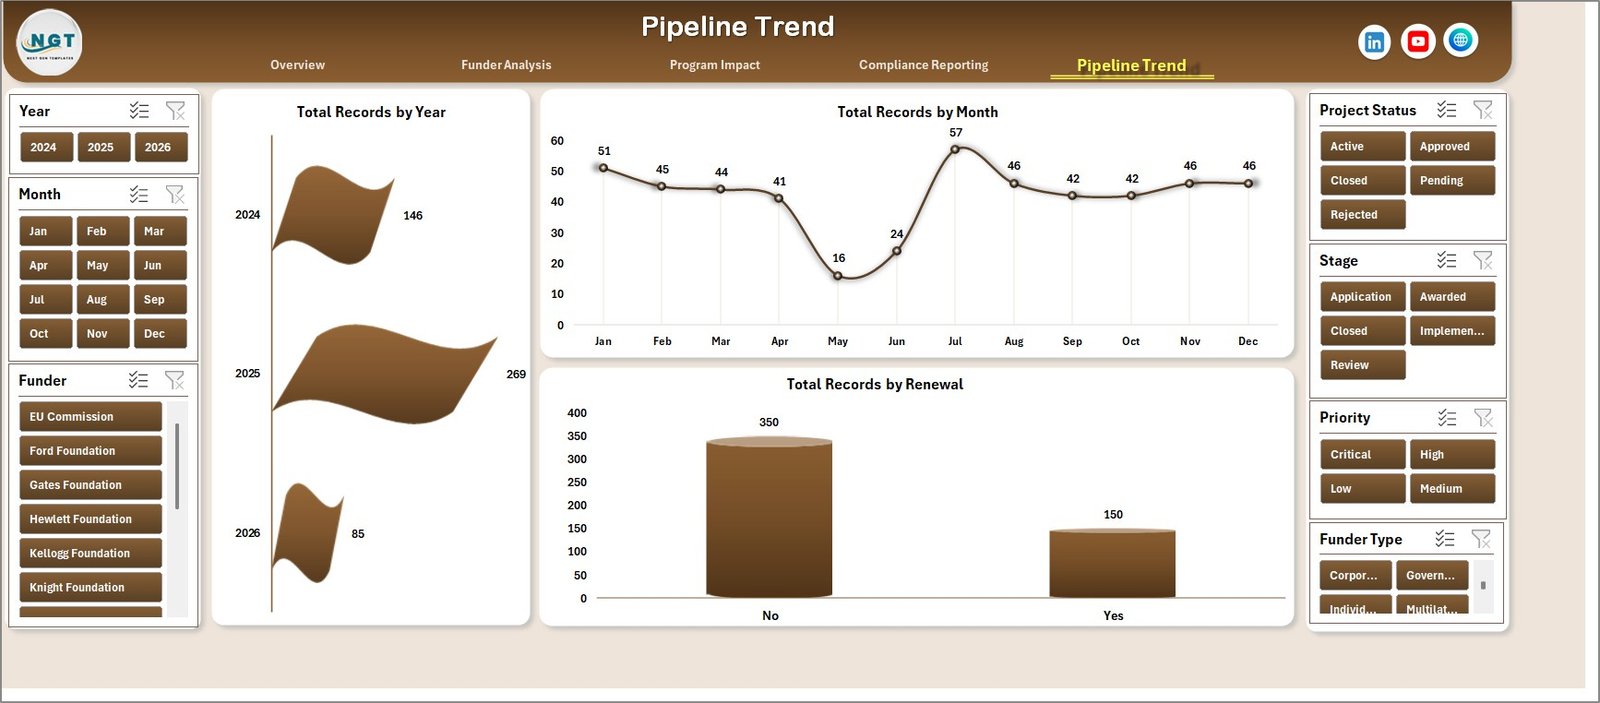
Nonprofit Grant Dashboard — Pipeline Trend Page
📈 Pipeline Trend Page — Tracks your grant pipeline over time: Total Records by Year, Total Records by Month, and Total Records by Renewal — essential for forecasting and annual reporting.
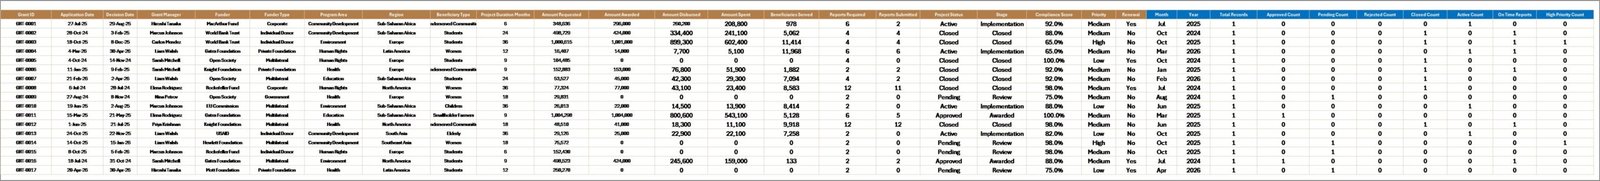
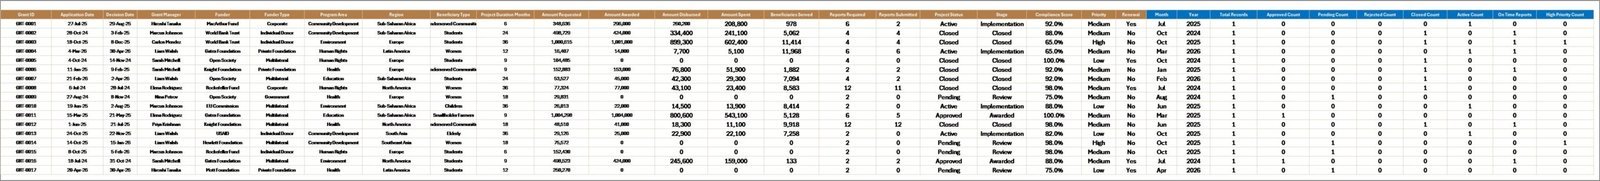
Nonprofit Grant Dashboard — Data Sheet Tab
📝 Data Sheet — Enter all your grant data here in the standardized column format. All analysis pages pull directly from this sheet.
Nonprofit Grant Dashboard — Support Sheet Tab
⚙️ Support Sheet — Contains all pivot tables that power the dashboard charts. Keep it hidden in production. After adding data, click Data → Refresh All to update every visual instantly.
📊 Nonprofit Grant Dashboard in Excel vs. Google Sheets Alternative vs. Paid Grant SaaS — Where This Fits
| Feature | Nonprofit Grant Dashboard in Excel | Google Sheets Grant Template | Submittable / Fluxx (Paid SaaS) |
|---|---|---|---|
| Cost | $17.99 one-time ✅ | Free (basic, no pre-built charts) | $500–$2,000+ per year |
| Platform | Microsoft Excel ✅ | Google Sheets (browser only) | Cloud SaaS (requires internet) |
| Setup time | Under 10 minutes ✅ | Build from scratch (hours) | Days to weeks of configuration |
| Pre-built charts | 17 charts included ✅ | None pre-built | Custom reporting module |
| Offline access | Works offline ✅ | Browser required | Cloud only |
| Compliance tracking | Burn rate, stage, priority ✅ | Manual setup only | Built-in workflow tools |
| Customizable fields | Fully editable ✅ | Yes (manual) | Limited by plan tier |
| Year-1 cost (5 users) | $17.99 total ✅ | $0 (no charts) | $2,500–$10,000+ |
For nonprofits that need structured grant tracking with compliance reporting — without a SaaS subscription — the Nonprofit Grant Dashboard in Excel sits in the sweet spot.
👥 Who This Template Is For — and Who It’s Not For
✅ This template is built for:
- Nonprofit grant managers and program directors tracking 5–100+ active grants
- Foundations and NGOs reporting to boards, funders, or government agencies
- Grant writers who need compliance and pipeline visibility before renewal season
- Finance teams at nonprofits reconciling spend against awarded grant amounts
- Organizations transitioning from paper-based or basic spreadsheet grant tracking
❌ This template is NOT for:
- Enterprise foundations managing 1,000+ grants requiring multi-user cloud access with audit trails
- Teams needing applicant-facing portals or grant submission intake workflows
- Teams with no Microsoft Excel installation (consider a Google Sheets version instead)
⚙️ How to Use the Nonprofit Grant Dashboard in Excel
- Download and unzip the file, then open it in Microsoft Excel (2016 or later recommended).
- Navigate to the Data Sheet tab and replace the sample data with your organization’s grant records.
- Go to the Excel Ribbon and click Data → Refresh All to update all pivot tables.
- Use the slicers on each analysis page to filter results by program area, funder, status, or date range.
- Hide the Support Sheet tab before sharing the dashboard with stakeholders.
💼 Real-World Use Cases
Maria runs grants management at a 40-person environmental nonprofit. She uses the Nonprofit Grant Dashboard in Excel to present monthly funding summaries to her board — showing Total Awarded vs. Total Spent via the Unspent Funds card, and using the Funder Analysis page to identify which funders provide the highest average award per grant. She replaced a $1,200/year subscription tool with this $17.99 download.
David is a grants officer at an international development foundation. He tracks 60+ active grants across multiple program areas and regions. The Program Impact page’s Total Beneficiaries by Region and Cost Per Beneficiary charts give him the data he needs for donor impact reports in minutes, not hours.
Priya manages compliance for a healthcare nonprofit receiving government grants. She uses the Compliance Reporting page to track Burn Rate % by Grant Manager, ensuring no grant ends the year underspent or overspent. The Stage and Priority charts flag high-priority items at a glance every Monday morning.
❓ Frequently Asked Questions
What KPIs does the Nonprofit Grant Dashboard in Excel track?
The Nonprofit Grant Dashboard in Excel tracks 5 key performance indicators: Total Awarded, Total Records, Total Beneficiaries, Total Spent, and Unspent Funds Amount. All five KPI cards update automatically when you refresh the pivot tables after updating the Data Sheet.
How many charts does this Excel grant dashboard include?
The dashboard includes 17 pre-built charts across 5 analysis pages — covering funder distribution, program area performance, beneficiary segmentation, compliance burn rates, and year-over-year pipeline trends. Every chart is pivot-powered and updates instantly on Data Refresh.
How long does setup take for the Nonprofit Grant Dashboard in Excel?
Setup takes under 10 minutes. Open the file in Excel, navigate to the Data Sheet, paste your grant records following the existing column format, then click Data → Refresh All. Every chart, KPI card, and analysis view updates instantly — no formula editing required.
Do I need any special Excel skills or add-ins to use this dashboard?
No add-ins or VBA coding skills are required. The dashboard works with standard Microsoft Excel 2016 and later. Basic Excel familiarity is sufficient — the pivot tables and slicers are pre-configured, so just replace the sample data and refresh.
How does this compare to Submittable or Fluxx for grant management?
Submittable and Fluxx are cloud SaaS platforms typically costing $500–$2,000+ per year, designed for applicant intake and grantee portals. The Nonprofit Grant Dashboard in Excel is built for internal tracking and compliance reporting at a one-time cost of $17.99, with no subscriptions or per-user fees.
Can I add more grant records or customize the dashboard fields?
Yes. Add as many rows as needed to the Data Sheet following the existing column structure. The pivot tables pick up new data automatically on Refresh. You can also modify chart titles, add slicers, or expand data columns to fit your organization’s specific grant tracking requirements.
Is this suitable for tracking grants from multiple funders and program areas?
Yes. The Funder Analysis page breaks down Total Awarded by Funder Type and Avg. Award Per Grant by Funder. The Program Impact page shows Total Beneficiaries by Program Area. Slicers let you filter simultaneously across funders, program areas, regions, and grant managers.
👤 About the Author
Built by PK — Microsoft Certified Professional with 15+ years of Excel, Google Sheets, and Power BI experience. Founder of NextGenTemplates, reaching 300K+ subscribers across YouTube channels (@PK-AnExcelExpert, @NextGenTemplates, @NeoTechNavigators). Every template is hand-built and tested before release.
🔗 Explore Related Templates
Looking for more Excel Dashboard Templates? Here are some popular picks:
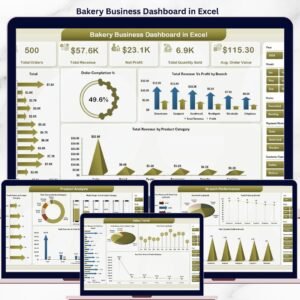
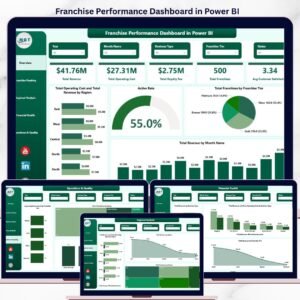
🔹 Corporate Sponsorship Request Tracker in Excel — Track sponsorship proposals, approvals, and disbursements across corporate funders.
🔹 Investment Banking KPI Dashboard in Excel — Monitor deal pipelines, financial KPIs, and team performance in Excel.
🔹 Vocational Training KPI Scorecard in Excel — Ideal for nonprofits running workforce development and training programs.
📖 Click here to read the Detailed Blog Post
🎥 Visit our YouTube channel for step-by-step video tutorials
👉 YouTube.com/@NextGenTemplates
Watch the step-by-step video tutorial:


Reviews
There are no reviews yet.