
The Consulting Report in Excel tracks 5 consulting KPIs across 4 structured sheets, with 5 pre-built charts and slicer-based filters covering Completed Project %, In Progress Project % by Region, Revenue by Department, Client Satisfaction by Consultant, and Client Satisfaction by Month. Setup takes under 10 minutes — paste your project records into the Data Sheet and every chart, KPI card, and report table updates automatically.
🌍 Join 8,400+ teams in 40+ countries using NextGenTemplates to replace paid SaaS tools with one-time-purchase Excel, Google Sheets, Power BI, and HTML templates.
✅ Instant download · One-time payment · No subscription · No per-user fees · Lifetime access
🔑 Key Features of Consulting Report in Excel
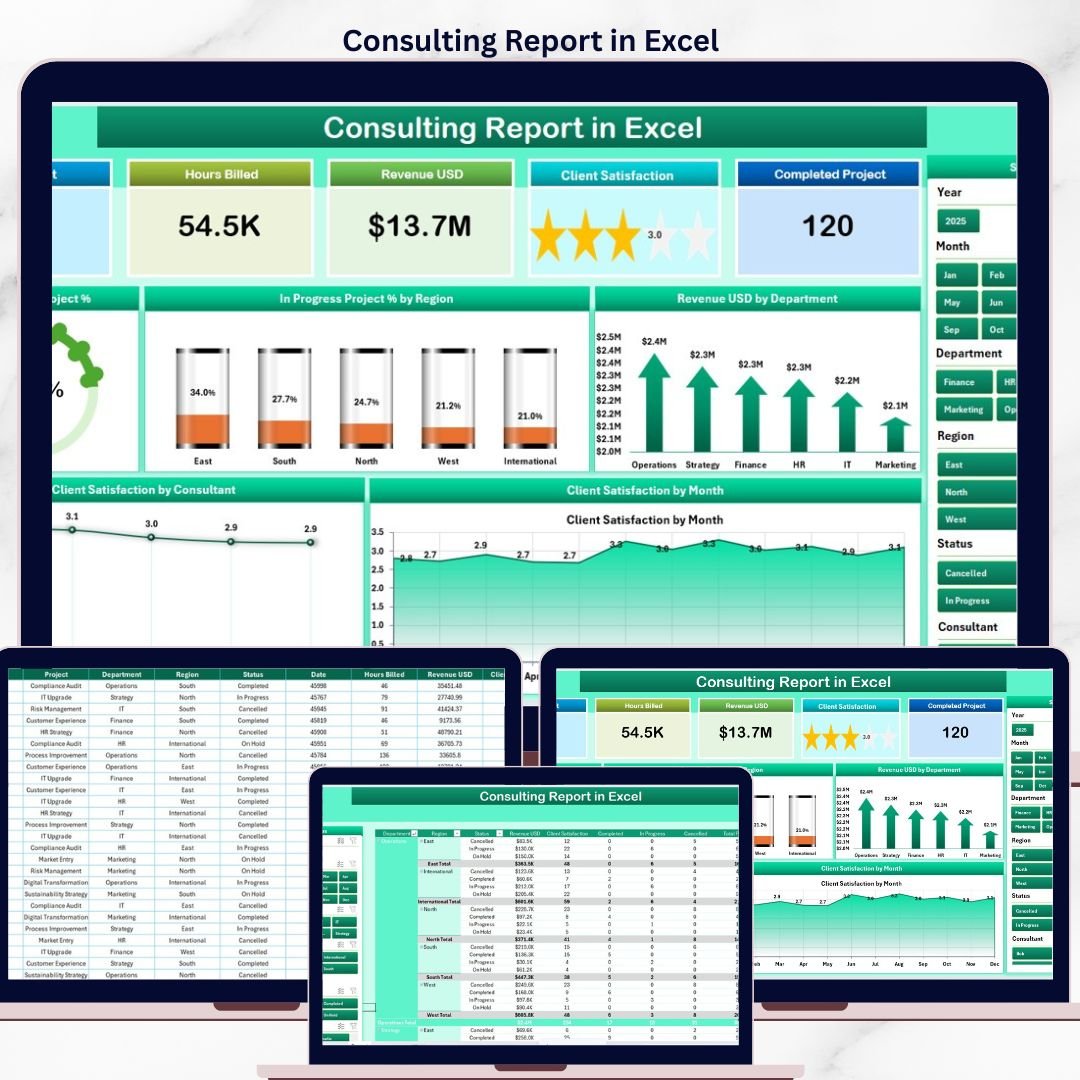
📊 5 KPI Cards on Summary Page – The top of the Summary Page displays 5 interactive KPI cards covering Total Projects, Completed Projects, In Progress Projects, Total Revenue, and Average Client Satisfaction. Each card recalculates instantly when you filter using the right-side slicer, giving consulting partners and engagement managers a real-time snapshot of firm-wide performance across every active client engagement.
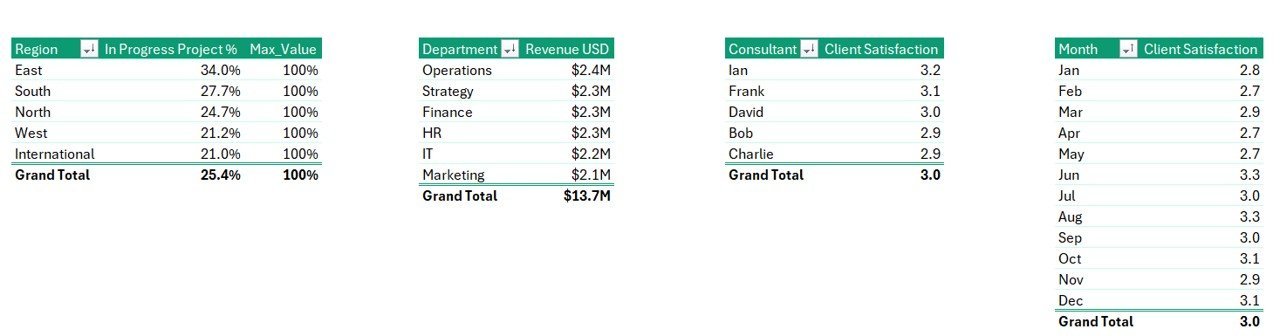
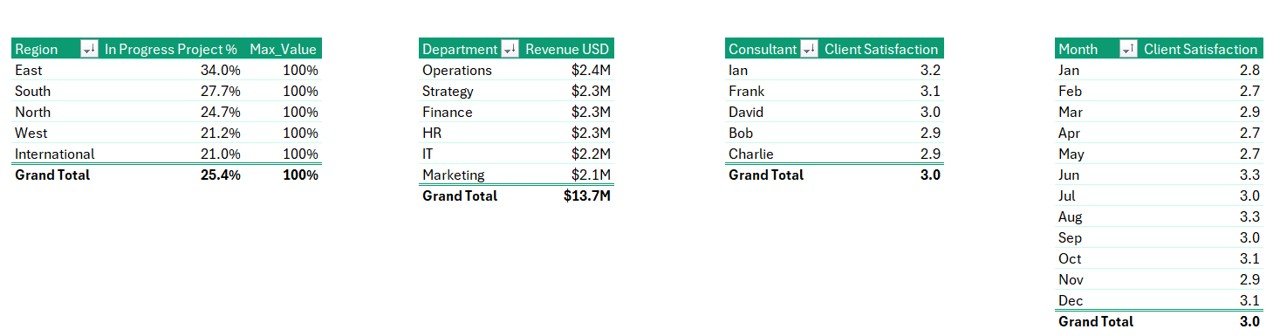
📈 5 Interactive Charts on Summary Page – The Summary Page visualizes Completed Project %, In Progress Project % by Region, Revenue by Department, Client Satisfaction by Consultant, and Client Satisfaction by Month in one consolidated view. All charts connect to the right-side slicer, so filtering by region, department, or consultant updates every chart simultaneously.
🔍 Dedicated Report Page with Information Table – A separate Report Page shows a record-level information table with a left-side slicer for filtering projects by client, consultant, region, department, or status. Engagement leads use this page to drill into individual project records for billing review, scope tracking, and client follow-up.
📋 Structured Data Sheet – A dedicated Data sheet keeps all consulting project records in a clean, repeatable format. Paste your project data in the same structure and the entire report — Summary page charts, KPI cards, and Report page table — auto-refreshes with no formula rewrites or manual pivot rebuilds.
🛠️ Support Sheet for Configuration – A Support Sheet stores lookup lists, consultant names, departments, regions, and helper calculations that feed the dashboard. Extend or customize dropdowns and category lists here, and every other sheet respects the updated configuration automatically.
This report consolidates project pipeline tracking, consultant utilization analysis, regional revenue breakdown, and monthly client satisfaction trends into one Excel file — eliminating the need for separate Professional Services Automation tools or paid consulting SaaS like the ones competing with our Excel Dashboard Templates catalog.
📦 What’s Inside the Consulting Report in Excel
📌 Summary Page – The main page of the report displays 5 KPI cards across the top (Total Projects, Completed, In Progress, Total Revenue, Average Client Satisfaction) and a right-side slicer for dynamic filtering. Five charts visualize Completed Project %, In Progress Project % by Region, Revenue by Department, Client Satisfaction by Consultant, and Client Satisfaction by Month.
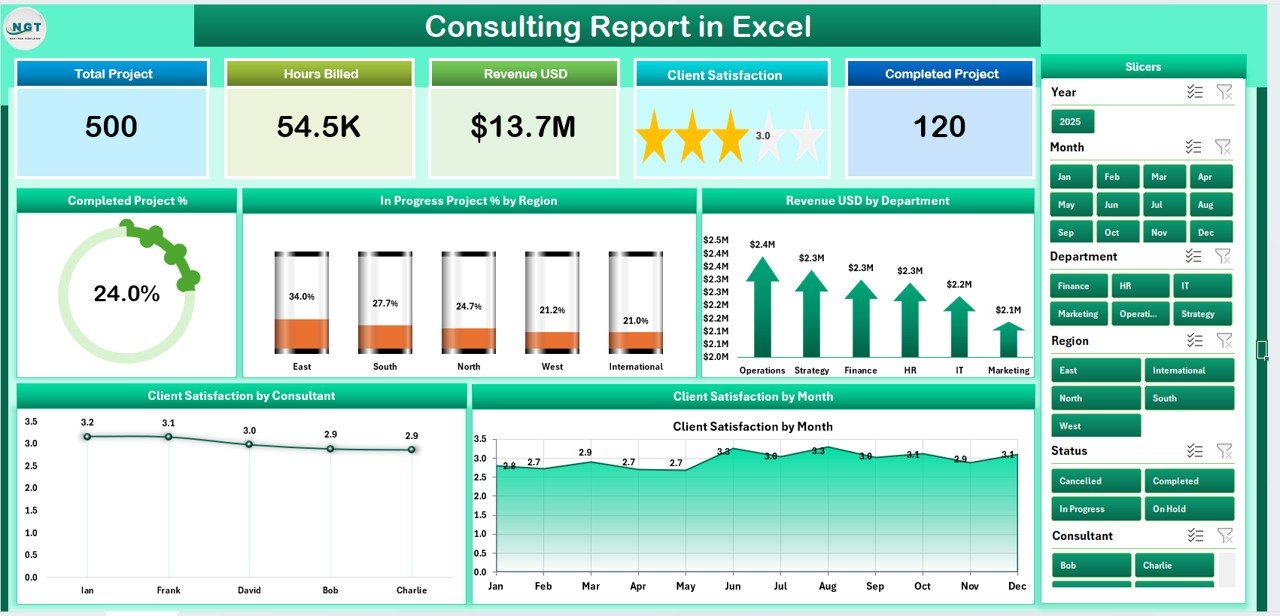
Consulting Report in Excel – Summary Page
📌 Report Page – A dedicated reporting page with a left-side slicer and a full information table. Consulting leads use this page to filter projects by client, consultant, region, department, or status, and drill into individual project records for billing, scope review, and engagement follow-up.
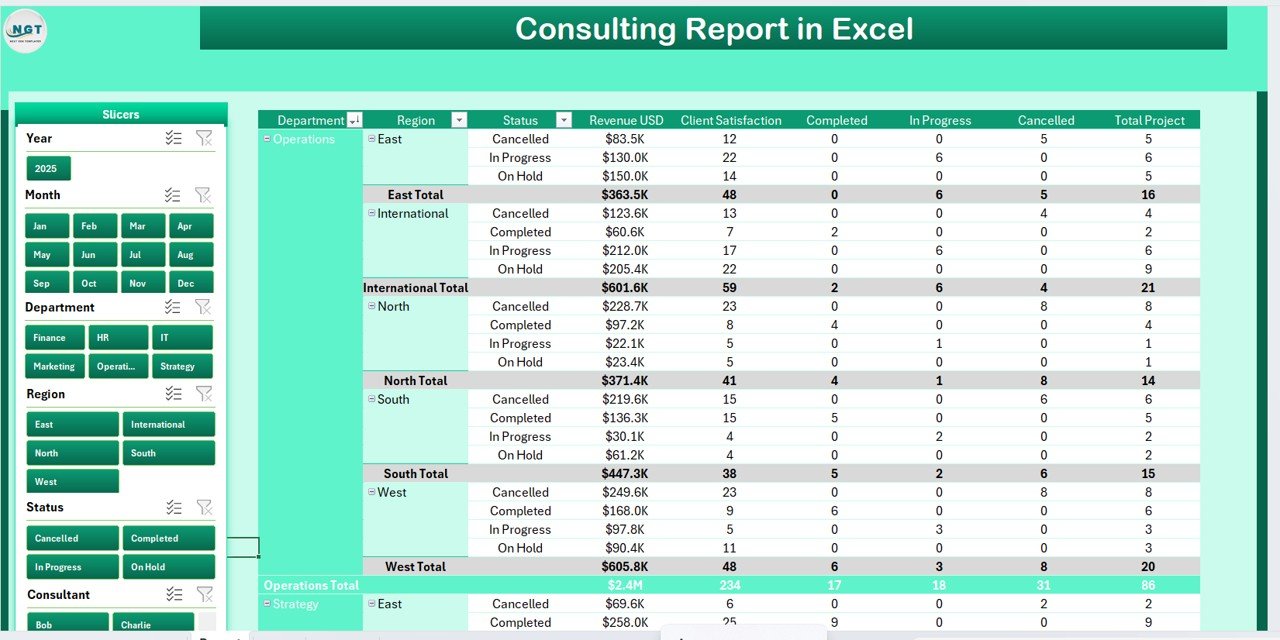
Report Page with Information Table
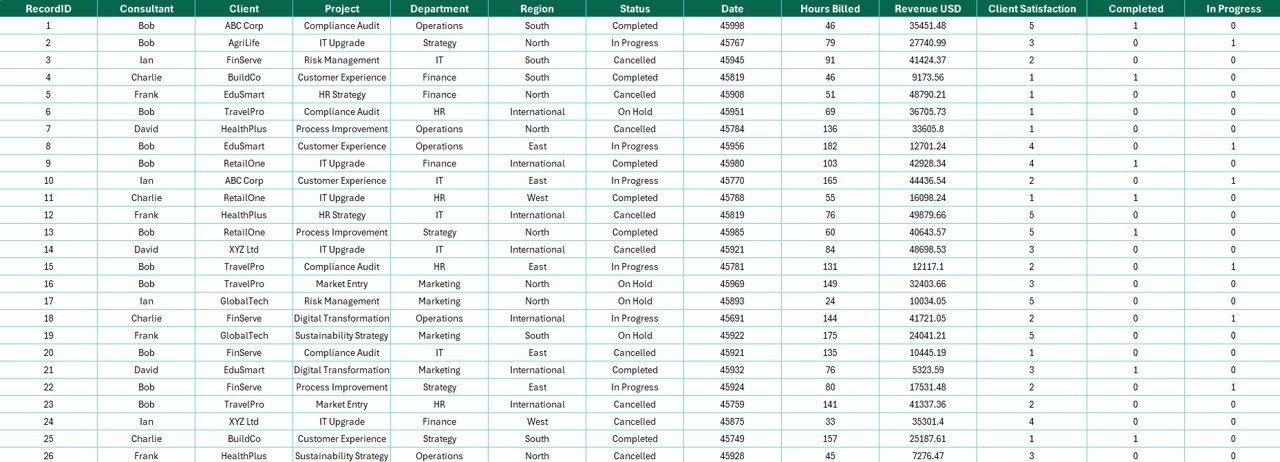
📌 Data Sheet – The raw data entry sheet where you add consulting project records in the same structured format. Fields typically include Project ID, Client Name, Consultant, Department, Region, Project Status, Start Date, End Date, Revenue, and Client Satisfaction Score. Replace the sample data and every chart, KPI card, and report table updates.
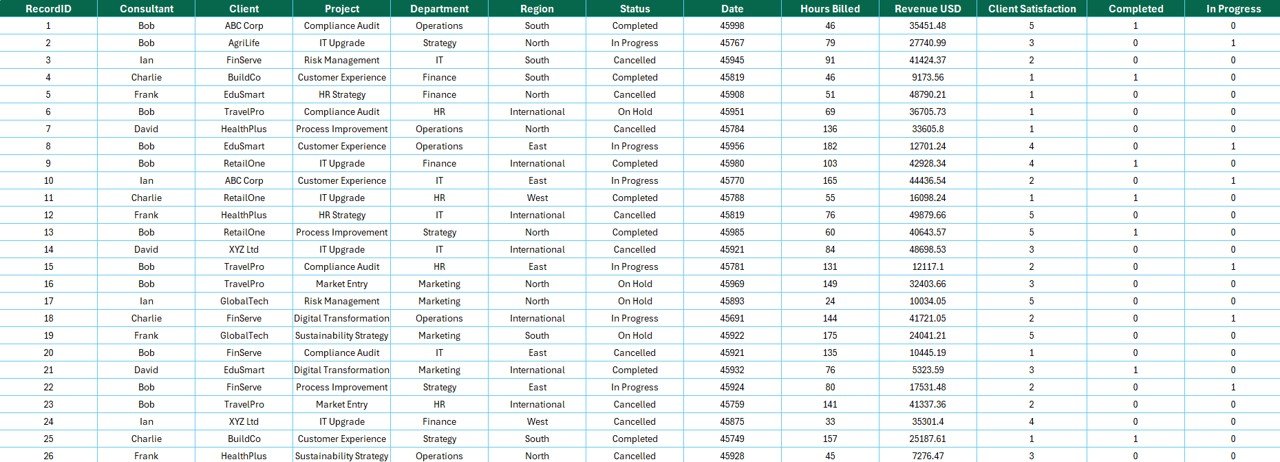
Data Sheet Tab
📌 Support Sheet – Stores lookup lists, consultant names, department categories, region names, project status values, and supporting helper calculations that drive the dashboard. Edit this sheet to customize categories, add new consultants or departments, and the entire report respects the updated configuration.
Support Sheet
📊 Consulting Report in Excel vs. Google Sheets Equivalent vs. Mavenlink / Scoro / BigTime — Where This Fits
| Feature | Consulting Report in Excel | Google Sheets Equivalent | Mavenlink / Scoro / BigTime |
|---|---|---|---|
| Cost | $7.99 one-time | $6.99 one-time | $25–150 / user / month |
| Platform | Microsoft Excel (desktop) | Google Sheets (browser) | Web SaaS (subscription) |
| Setup Time | Under 10 minutes | Under 10 minutes | 2–8 weeks onboarding |
| Offline Access | ✅ Full offline use | Requires internet | ❌ Cloud-only |
| Slicer-Based Filtering | ✅ Native Excel slicers | Filter views only | Built-in filter panels |
| Customizable Fields | ✅ Fully editable | ✅ Fully editable | Limited without admin plan |
| Share with Link | Requires OneDrive / SharePoint | ✅ One-click sharing | ✅ Role-based access |
| Year-1 Cost (5 users) | $7.99 total | $6.99 total | $1,500–$9,000 / year |
| Client Satisfaction Tracking | ✅ Built-in (by consultant + month) | Varies by template | ✅ Survey-integrated |
For consulting firms that want a complete project, revenue, and client satisfaction report without paying $25–150 per user per month for Mavenlink or Scoro, the Consulting Report in Excel sits in the sweet spot.
👥 Who This Template Is For — and Who It’s Not For
✅ This template is built for:
- Consulting firm partners and managing directors tracking project pipeline, revenue, and consultant utilization across 5–500 active engagements
- Engagement managers running multi-region practices who need project completion percentages, region-wise revenue, and consultant-level client satisfaction in one workbook
- Solo consultants and 2–10 person boutique firms who want PSA-style reporting without paying $50+ per user per month for Mavenlink, Scoro, or Kantata
- Operations leads at professional services firms preparing monthly partner-meeting reports with Revenue by Department and Client Satisfaction trend charts
- Finance teams in consulting firms who need a single Excel file covering project status, revenue mix, and client experience metrics
❌ This template is NOT for:
- Enterprise consulting firms needing full PSA workflows with timesheet ingestion, automated invoicing, and SOC 2 / ISO 27001 audit trails
- Agencies requiring real-time two-way sync with Jira, HubSpot, or QuickBooks (this report uses paste-based data entry)
- Teams that already live entirely in Google Workspace — pick a Google Sheets dashboard equivalent for browser-native collaboration
⚙️ How to Use the Consulting Report in Excel
- Open the file in Microsoft Excel (desktop) — enable editing when prompted.
- Go to the Data Sheet tab and replace the sample rows with your own consulting project records.
- Update the Support Sheet if you need to add new consultants, departments, regions, or project statuses to the dropdown lists.
- Open the Summary Page — all 5 KPI cards and 5 charts refresh automatically from the Data Sheet.
- Use the right-side slicer on the Summary Page to filter by region, department, consultant, or status for targeted partner reviews.
- Open the Report Page and use the left-side slicer to drill into the information table for project-level detail.
- Save and share the workbook via OneDrive, SharePoint, or email for partner-meeting review.
💼 Real-World Use Cases
Priya runs a 22-person management consulting firm in Bengaluru. She uses the Consulting Report in Excel to track 60+ active client engagements across 4 regions, monitor Revenue by Department week over week, and present a monthly partner-meeting report on Client Satisfaction by Consultant — without paying $39 per user per month for Mavenlink.
Daniel leads a boutique strategy consultancy of 6 people in Toronto. He replaced 3 separate spreadsheets with this single workbook, filters by “In Progress” status using the slicer during his Friday review, and shares the Summary Page snapshot with his investors quarterly. The Client Satisfaction by Month chart became his core retention metric.
Sofia is an independent IT consultant working with 8 mid-size clients across Europe. She duplicates this template per client portfolio, customizes the Support Sheet with their department and region lists, and delivers a branded consulting performance report — turning a $7.99 template into a recurring deliverable that previously required a $400/month BigTime license per client.
❓ Frequently Asked Questions
What KPIs does the Consulting Report in Excel track?
The Consulting Report in Excel tracks 5 core KPIs on the Summary Page: Total Projects, Completed Projects, In Progress Projects, Total Revenue, and Average Client Satisfaction. All metrics update automatically when you replace the sample data with your own consulting project records in the Data Sheet.
Can I filter the report by consultant, region, or department?
Yes. The Summary Page has a right-side slicer and the Report Page has a left-side slicer. Both let you filter by consultant, region, department, project status, or client. All KPI cards, charts, and the information table update simultaneously when a filter is applied.
How does this compare to Mavenlink, Scoro, or BigTime?
The Consulting Report in Excel costs $7.99 one-time versus $25–150 per user per month for Mavenlink, Scoro, or BigTime. It covers the same project status, revenue, and client satisfaction reporting without ongoing subscription costs, lengthy onboarding, or per-user fees, and works fully offline on Windows and Mac.
How long does setup take?
Setup for the Consulting Report in Excel takes under 10 minutes. Open the file, paste your project data into the Data Sheet, update the Support Sheet dropdowns if needed, and every chart, KPI card, and report table updates automatically.
Can I add more consultants or departments?
Yes. The Support Sheet holds all consultant, department, region, and project status lookup lists. Add rows to extend these lists, and the Summary Page charts, Report Page table, and slicers respect the updated configuration immediately.
Does this template work on Mac?
Yes. The Consulting Report in Excel works on both Windows and Mac versions of Microsoft Excel. Slicers, charts, and formulas all function natively without add-ins. Excel for the web also supports viewing the report, with slicer functionality depending on your Microsoft 365 plan.
Can I track Client Satisfaction by individual consultant?
Yes. The Consulting Report in Excel includes a dedicated Client Satisfaction by Consultant chart on the Summary Page. Apply the slicer by region or department to view satisfaction scores for a subset of consultants, helping partners identify both top performers and engagement-quality risks.
👤 About the Author
Built by PK — Microsoft Certified Professional with 15+ years of Excel, Google Sheets, and Power BI experience. Founder of NextGenTemplates, reaching 300K+ subscribers across YouTube channels (@PK-AnExcelExpert, @NextGenTemplates, @NeoTechNavigators). Every template is hand-built and tested before release.
🔗 Explore Related Templates
📊 Technology Report in Excel – A sibling Excel report focused on technology operations, with the same Summary + Report Page + Data + Support Sheet structure.
📊 Administration Report in Excel – Track service requests, escalations, and completion percentages across departments and regions in the same 4-sheet report format.
📊 Data Analytics Dashboard Report in Excel – A complementary Excel report ideal for consulting firms running data analytics service lines for clients.
📊 Compliance and Audit Dashboard in Power BI – Step up to Power BI when you need richer interactivity, drillthrough, and cross-report filtering on consulting compliance data.
📊 Browse all Excel Dashboard Templates →
📖 Click here to read the Detailed Blog Post
🎥 Visit our YouTube channel for step-by-step video tutorials
👉 YouTube.com/@NextGenTemplates
Watch the step-by-step video tutorial:


Reviews
There are no reviews yet.