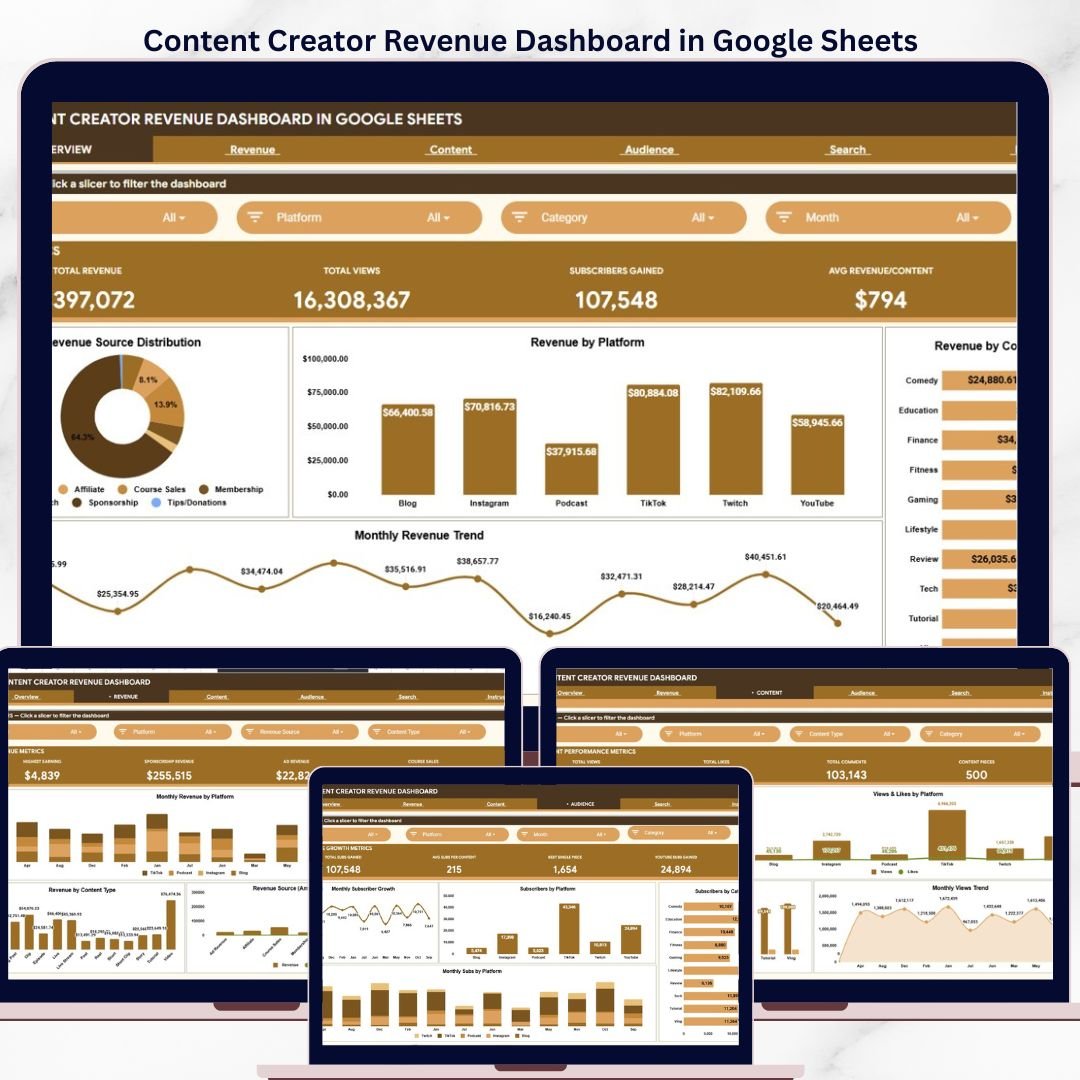
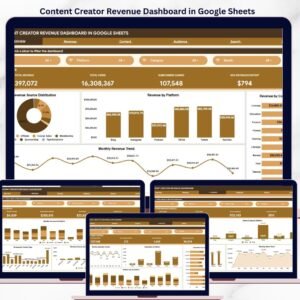
The Content Creator Revenue Dashboard in Google Sheets tracks 4 revenue KPIs across 6 interactive sheets, with 8 pre-built charts, multiple slicers for filtering, a dedicated Search sheet for instant content lookups, and a structured Data sheet for 500+ rows of content performance records. Setup takes under 10 minutes — paste your content data into the Data sheet, and every card, chart, and slicer updates automatically via Google Apps Script formulas.
🌍 Join 8,400+ teams in 40+ countries using NextGenTemplates to replace paid SaaS tools with one-time-purchase Excel, Google Sheets, Power BI, and HTML templates.
✅ Instant download · One-time payment · No subscription · No per-user fees · Lifetime access
🔑 Key Features of Content Creator Revenue Dashboard in Google Sheets
🔹 4 KPI cards on the Overview page — Total Revenue, Total Views, Subscribers Gained, and Avg Revenue per Content sit across the top of the Overview sheet, giving you a snapshot of your creator business in under 5 seconds. Every card recalculates instantly when you use the slicers to filter by platform, source, category, or month.
🔹 6 purpose-built sheet tabs — Overview, Revenue, Content, Audience, Search, and Data — each focused on a single decision area so no sheet is cluttered and every chart earns its place. This Google Sheets Dashboard follows the same multi-page structure used across all NextGenTemplates dashboards.
🔹 8 analytical charts with slicer-driven filtering — Revenue by Source, Revenue by Platform, Revenue by Content Category, Revenue by Month on the Overview page, plus deeper analyses on each sub-page. Slicers control every chart simultaneously for instant what-if analysis across your content portfolio.
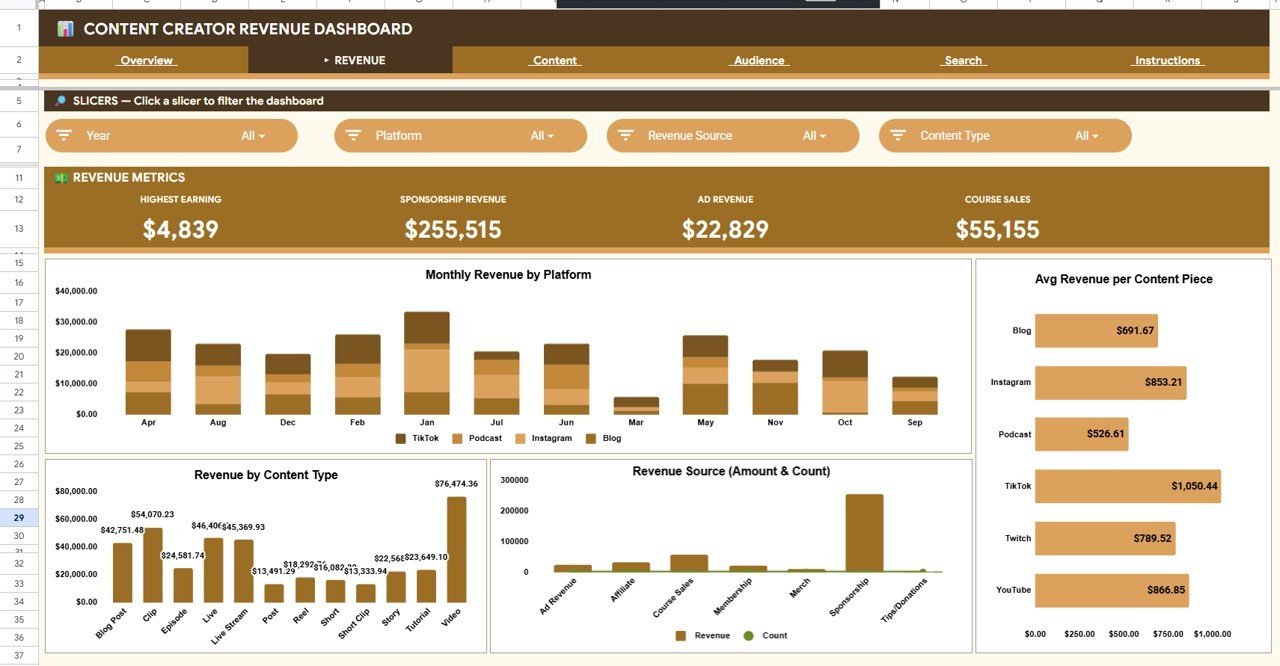
🔹 Revenue page with 8 detailed breakdowns — Highest Earning, Sponsorship Revenue, Ad Revenue, Course Sales, Revenue by Month and Platform, Avg Revenue per Content by Platform, Revenue by Content Type, and Revenue and Count by Revenue Source. This page answers the single most important creator question: where is the money actually coming from?
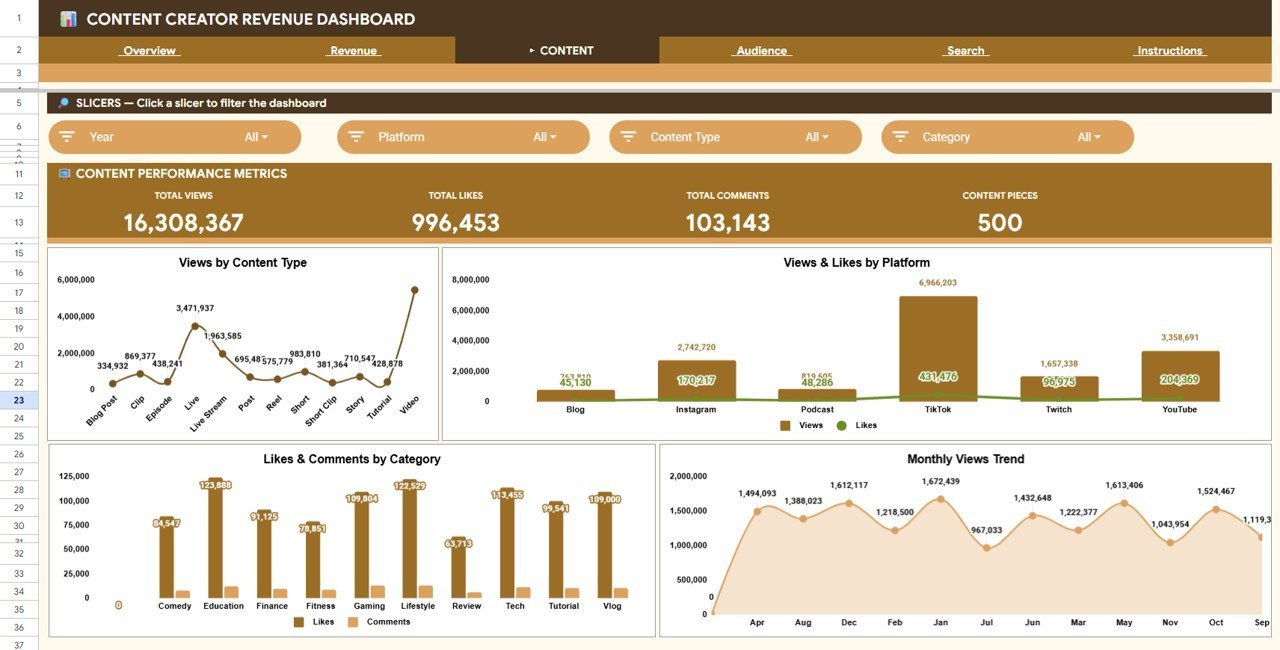
🔹 Content page for engagement tracking — Total Views, Total Likes, Total Comments, Content Pieces, plus Views by Content Type, Views and Likes by Platform, Likes and Comments by Category, and Views by Month.
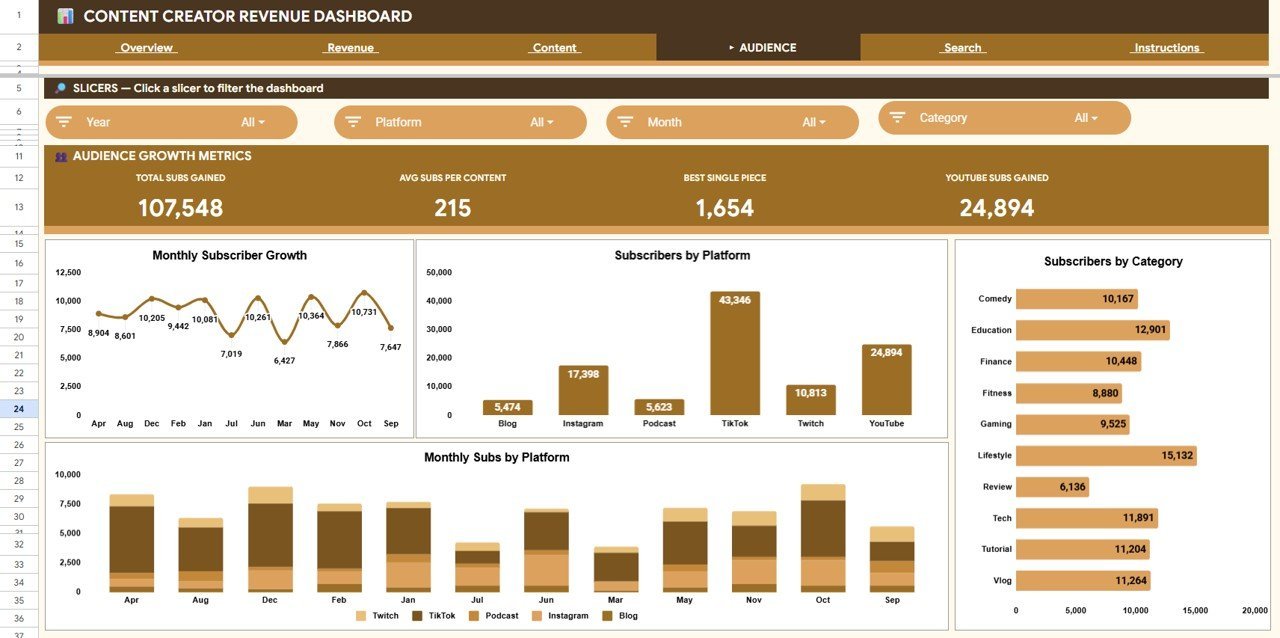
🔹 Audience page for subscriber growth analysis — Total Subs Gained, Avg Subs per Content, Best Single Piece, YouTube Subs Gained, plus Subscribers Gained by Month, Subscribers by Platform, Subscribers by Category, and Subscribers by Month and Platform.
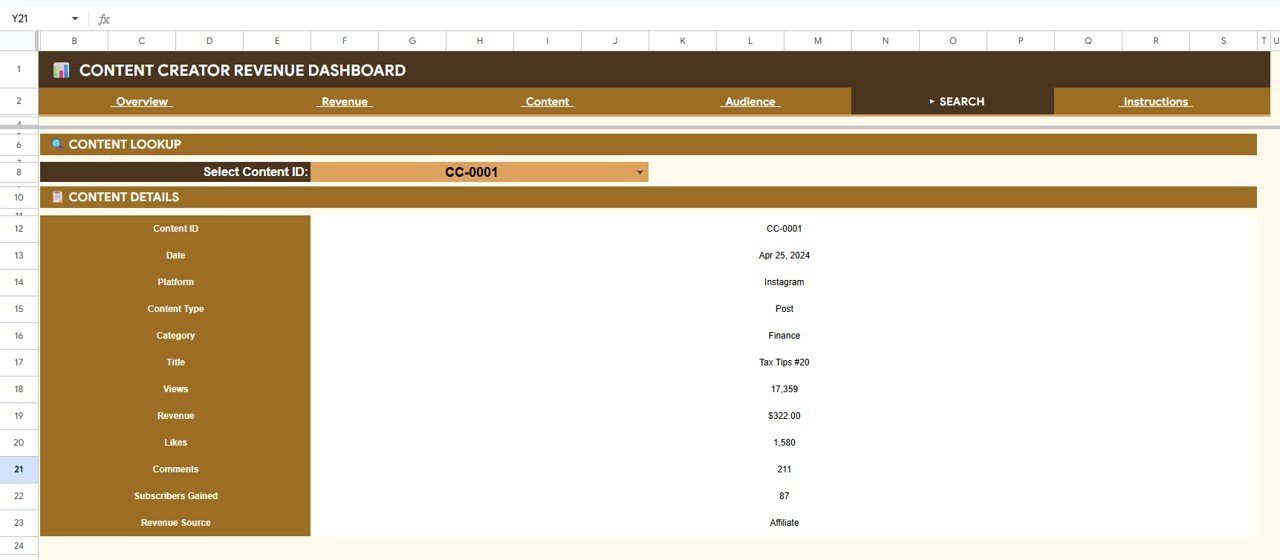
🔹 Search sheet for instant content lookups — select any Content ID from the dropdown and view all details for that specific content piece: date, platform, content type, category, title, views, revenue, likes, comments, subscribers gained, and revenue source.
🔹 Works entirely in Google Sheets — no desktop software to install, no macros to enable. Open the Google Sheets link from the PDF guide, click Make a copy, and start adding your content data immediately.
📦 What’s Inside the Content Creator Revenue Dashboard in Google Sheets
📊 1. Overview Page — 4 KPI cards (Total Revenue, Total Views, Subscribers Gained, Avg Revenue per Content) plus slicers and 4 charts: Revenue by Source shows which income streams generate the most revenue. Revenue by Platform compares YouTube, Instagram, TikTok, podcast, blog, and other channels. Revenue by Content Category segments earnings by topic area. Revenue by Month reveals seasonal patterns in your creator income.
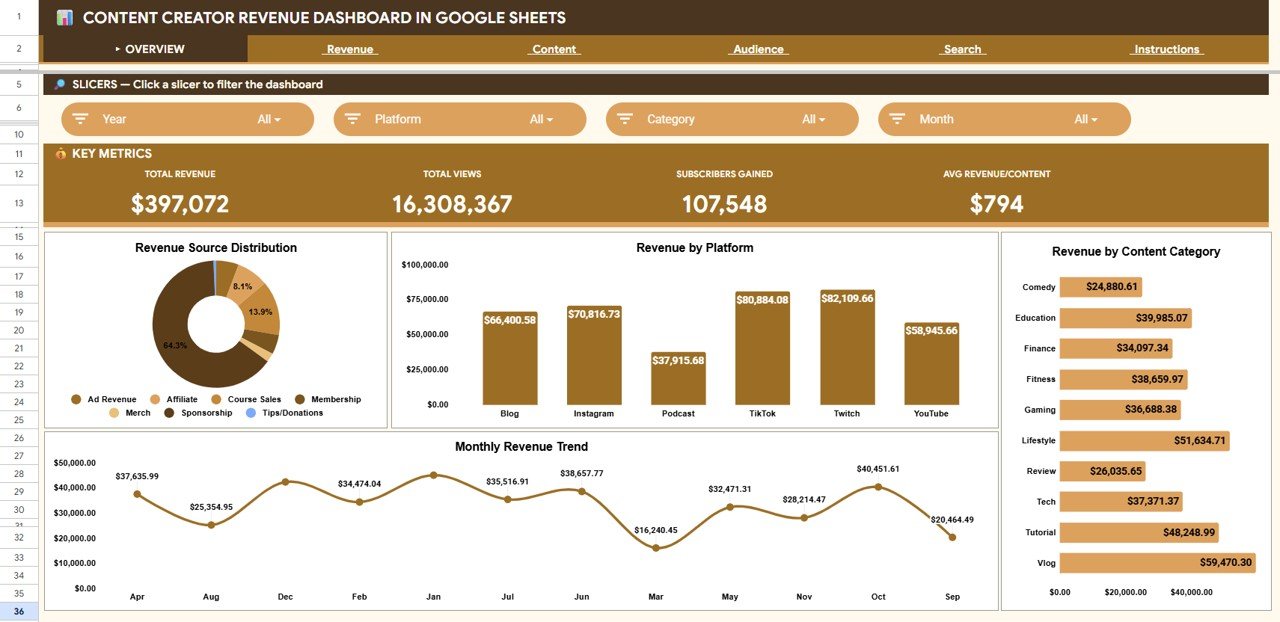
Content Creator Revenue Dashboard in Google Sheets
💰 2. Revenue Page — Deep-dive into monetization with 8 analyses: Highest Earning content piece, Sponsorship Revenue total, Ad Revenue total, Course Sales total, Revenue by Month and Platform trend, Avg Revenue per Content by Platform comparison, Revenue by Content Type breakdown, and Revenue and Count by Revenue Source cross-reference.

Revenue Page
📈 3. Content Page — Engagement analytics with 4 KPI cards (Total Views, Total Likes, Total Comments, Content Pieces) and 4 charts: Views by Content Type, Views and Likes by Platform, Likes and Comments by Category, Views by Month.

Content Page
👥 4. Audience Page — Subscriber growth tracking with 4 KPI cards (Total Subs Gained, Avg Subs per Content, Best Single Piece, YouTube Subs Gained) and 4 charts: Subscribers Gained by Month, Subscribers by Platform, Subscribers by Category, Subscribers by Month and Platform.
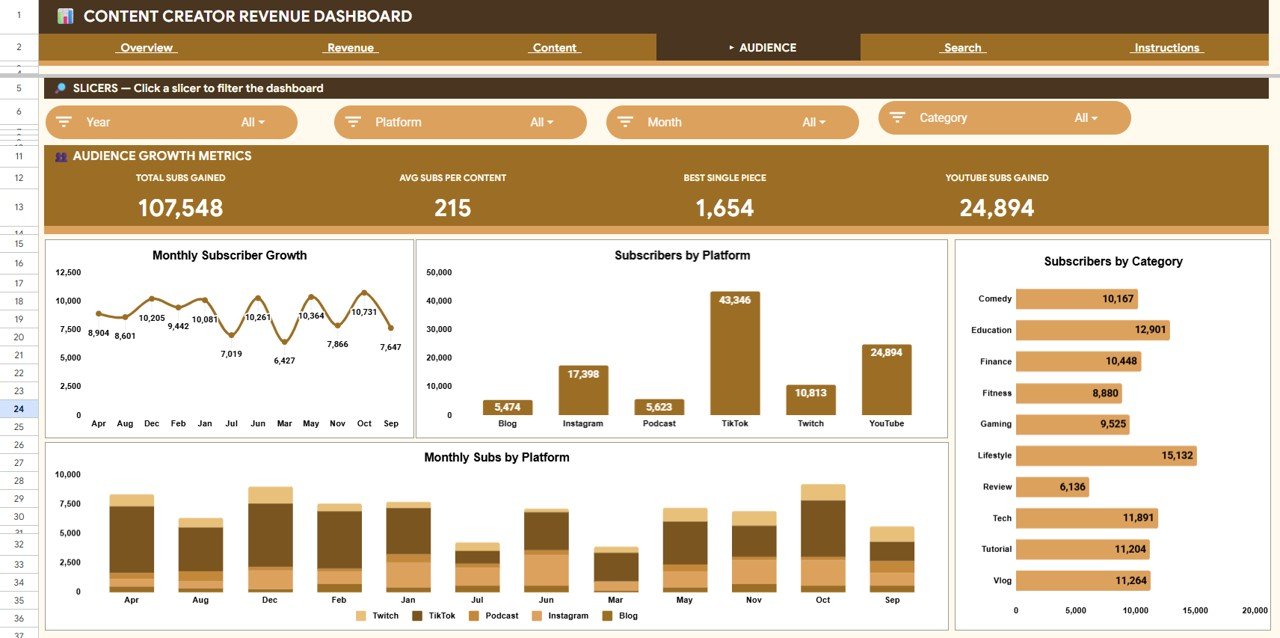
Audience Page
🔍 5. Search Sheet — Select any Content ID from the dropdown and instantly view all details for that content piece including date, platform, content type, category, title, views, revenue, likes, comments, subscribers gained, and revenue source.
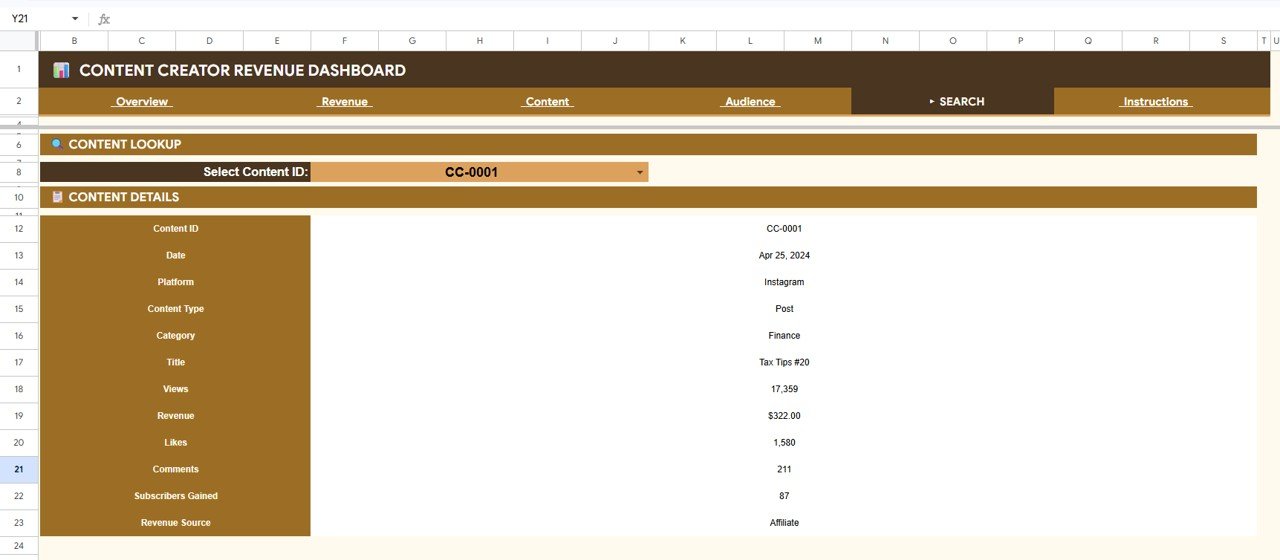
Search Sheet tab
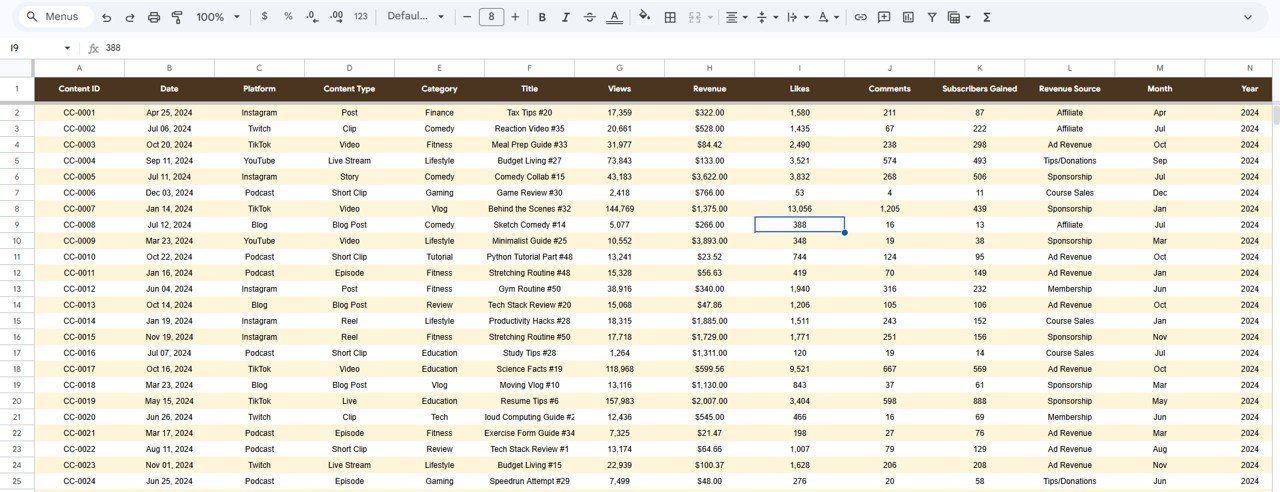
🗂️ 6. Data Sheet — Paste your content performance data here in the same column structure. Every other sheet refreshes from this single source.
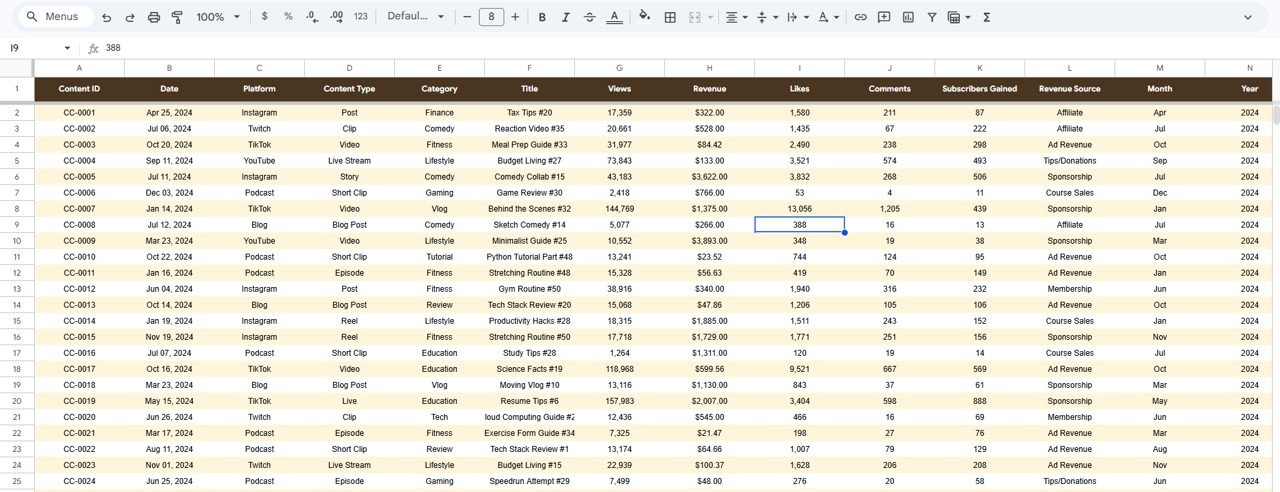
Data Sheet tab
📊 Content Creator Revenue Dashboard in Google Sheets vs. Excel vs. Kajabi / Linktree Pro — Where This Fits
| Feature | Content Creator Revenue Dashboard (Google Sheets) | Microsoft Excel Dashboard | Kajabi / Linktree Pro / Stan Store |
|---|---|---|---|
| Cost | $9.99 one-time | $9.99–$17.99 one-time | $24–$149 / month |
| Platform | Google Sheets (browser) | Microsoft Excel (desktop) | Proprietary cloud SaaS |
| Setup time | Under 10 minutes ✅ | Under 10 minutes | 1–3 hours onboarding |
| Real-time collaboration | Built-in ✅ | Via OneDrive only | Limited |
| Mobile access | Google Sheets app ✅ | Excel mobile (limited) | ✅ |
| Multi-platform tracking | YouTube, TikTok, Instagram, Podcast ✅ | Same capability | Own platform only |
| Content-level lookup | Search sheet with dropdown ✅ | VBA search (Windows only) | Limited analytics |
| Year-1 cost at 1 user | $9.99 total | $9.99–$17.99 total | $288–$1,788 |
| Data ownership | 100% in Google Drive ✅ | 100% local file | Vendor-hosted |
For content creators who want a multi-platform revenue, engagement, and audience dashboard without paying $24–$149 per month for a SaaS tool, the Content Creator Revenue Dashboard in Google Sheets sits in the sweet spot.
👥 Who This Template Is For — and Who It’s Not For
✅ This template is built for:
- YouTubers, podcasters, and bloggers tracking revenue from ads, sponsorships, courses, and affiliate links across 2–5 platforms
- Solo content creators and small creator teams (1–5 people) who want one Google Sheets file consolidating all income and engagement data
- Creators earning $500–$50,000 per month who need monthly revenue reporting for taxes, sponsors, or brand partnerships
- Google Sheets users who prefer browser-based dashboards with real-time sharing over desktop Excel files
❌ This template is NOT for:
- Large media companies or MCNs needing real-time API integrations with YouTube Analytics, Spotify, or TikTok Creator Fund
- Creators who only monetize through one platform and one revenue source — a simpler tracker would suffice
- Users who need automated data ingestion from APIs — this template uses manual data entry
⚙️ How to Use the Content Creator Revenue Dashboard in Google Sheets
- Open the PDF guide from your download and click the Google Sheets link to create your own editable copy in Google Drive.
- Go to the Data sheet and replace the sample rows with your own content performance data — keep the column headers intact.
- Navigate to the Overview page to see your 4 KPI cards and 4 summary charts update automatically.
- Use the slicers at the top to filter by platform, revenue source, content category, or month.
- Switch to the Revenue, Content, or Audience tabs for deeper analysis on monetization, engagement, or subscriber growth.
- Use the Search sheet to look up any individual content piece by its Content ID.
💼 Real-World Use Cases
Anika is a YouTube creator with 85K subscribers in the personal finance niche. She earns from AdSense, two course launches, and 3 brand sponsorships per month. She uses the Content Creator Revenue Dashboard in Google Sheets to track which content category generates the highest revenue per piece — and discovered that her investing tutorials earn 2.4x more per video than budgeting tips, shifting her content calendar accordingly.
Marcus runs a podcast and a blog in the tech review space. He uses the Revenue page to compare sponsorship revenue vs ad revenue vs affiliate income by month, and the Audience page to see that his podcast drives 3x more subscribers per piece than his blog. The dashboard helped him pitch a $2,000/episode sponsor by showing verified reach data across platforms.
Priya manages content for a 3-person creator agency in Bangalore. She copies the dashboard once per client, updates the Data sheet weekly, and uses the Overview page as the monthly reporting deck for each creator — replacing a $49/month analytics SaaS subscription per client.
❓ Frequently Asked Questions
What KPIs does the Content Creator Revenue Dashboard in Google Sheets track?
The Content Creator Revenue Dashboard in Google Sheets tracks 4 headline KPIs — Total Revenue, Total Views, Subscribers Gained, and Avg Revenue per Content — plus 8 supporting charts across revenue source, platform, content category, and monthly trends.
How long does setup take?
Setup takes under 10 minutes. Click the Google Sheets link from the PDF guide, make a copy to your Google Drive, paste your content data into the Data sheet, and every chart and KPI card updates automatically.
Can I track revenue from YouTube, TikTok, Instagram, and podcasts in one dashboard?
Yes. The Data sheet supports any platform — YouTube, TikTok, Instagram, Podcast, Blog, Twitter, LinkedIn, or custom values. Slicers and charts break down metrics by platform automatically.
How does this compare to Kajabi or Linktree Pro analytics?
Kajabi and Linktree Pro charge $24–$149 per month and only track activity on their own platform. This dashboard costs $9.99 one-time, tracks all platforms in one place, and gives you full data ownership in Google Drive.
Does this work on mobile?
Yes. The dashboard opens in the Google Sheets mobile app on iOS and Android. Charts display in read-only mode on mobile, while data entry and filtering work on both phone and tablet.
Can I share this dashboard with my manager or sponsor?
Yes. Since it runs in Google Sheets, you can share it with anyone using a Google account. Set permissions to Viewer for read-only access or Editor for collaborative input.
Can I add more revenue sources or platforms?
Yes. Add new values directly to the Data sheet and the slicers and charts on all pages pick them up automatically. No formula edits needed.
👤 About the Author
Built by PK — Microsoft Certified Professional with 15+ years of Excel, Google Sheets, and Power BI experience. Founder of NextGenTemplates, reaching 300K+ subscribers across YouTube channels (@PK-AnExcelExpert, @NextGenTemplates, @NeoTechNavigators). Every template is hand-built and tested before release.
🔗 Explore Related Templates
💡 Also available as: Content Creator Revenue Dashboard in Power BI — same analytics in a DAX-powered Power BI report.
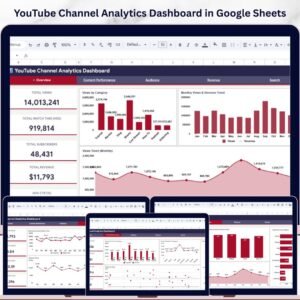
📌 YouTube Channel Analytics Dashboard in Google Sheets — YouTube-focused analytics with deeper channel metrics.
📌 Digital Marketing Campaign Dashboard in Google Sheets — Track campaign performance across paid and organic channels.
📌 Browse all Google Sheets Dashboard Templates on NextGenTemplates.
📖 Click here to read the Detailed Blog Post
Watch the step-by-step video tutorial:
🎥 Visit our YouTube channel for step-by-step video tutorials
👉 YouTube.com/@NextGenTemplates


Reviews
There are no reviews yet.