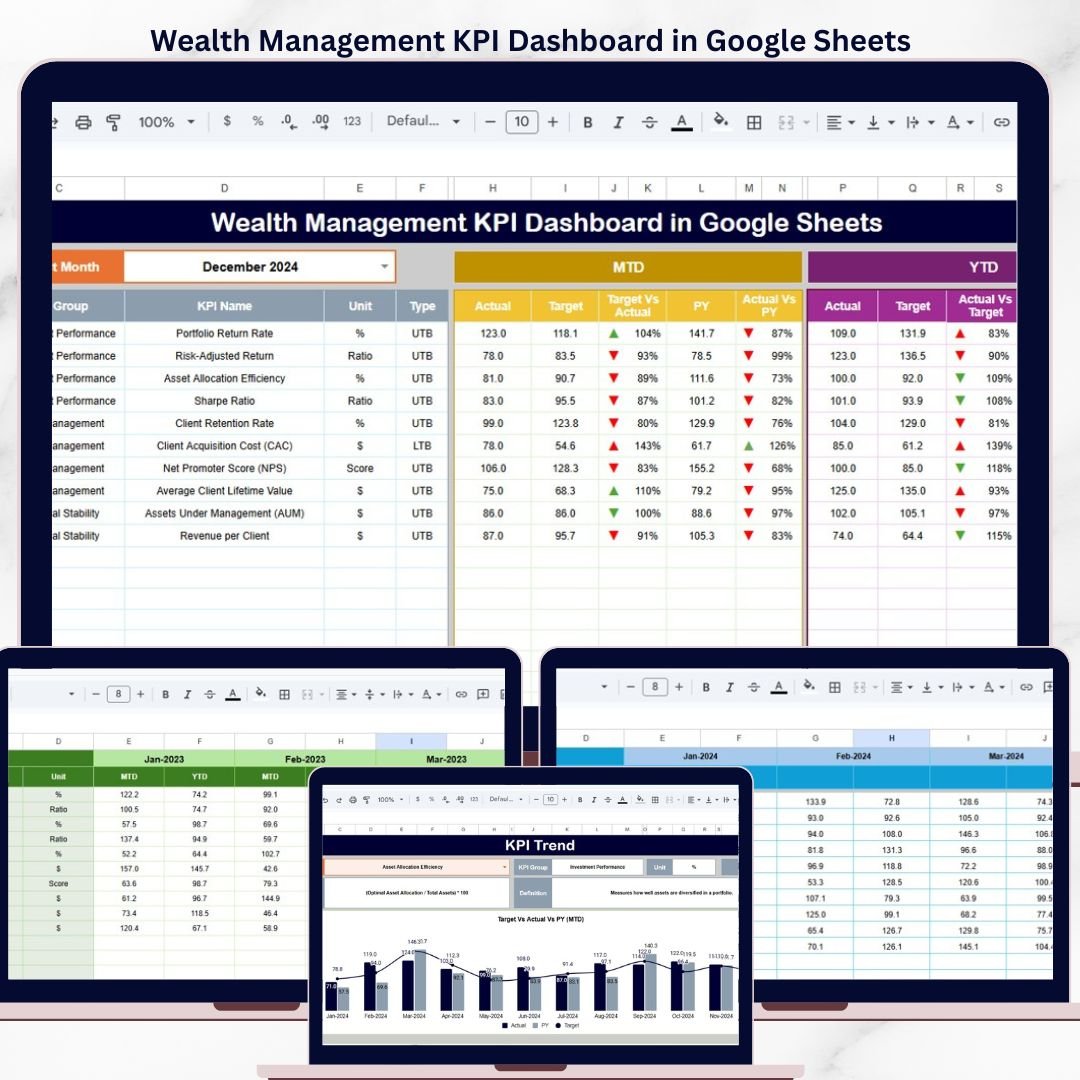


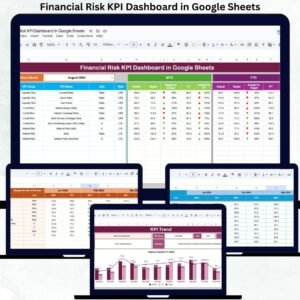
The Wealth Management KPI Dashboard in Google Sheets tracks wealth management KPIs across 6 interactive worksheets, with MTD and YTD performance views, trend analysis charts, and conditional formatting indicators. Setup takes under 10 minutes — just replace the sample data with your actual numbers and the entire dashboard updates automatically.
🌍 Join 8,400+ teams in 40+ countries using NextGenTemplates to replace paid SaaS tools with one-time-purchase Excel, Google Sheets, Power BI, and HTML templates.
✅ Instant download · One-time payment · No subscription · No per-user fees · Lifetime access
🔑 Key Features of Wealth Management KPI Dashboard in Google Sheets
📊 Interactive KPI Dashboard – Select any month from the dropdown on cell D3 and the entire dashboard recalculates MTD Actual, Target, and Previous Year numbers along with YTD equivalents. Conditional formatting arrows instantly show whether each KPI improved or declined compared to targets and prior year.
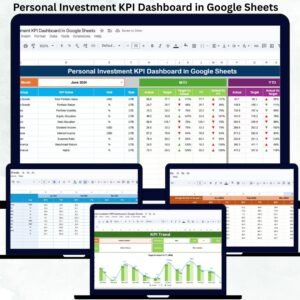
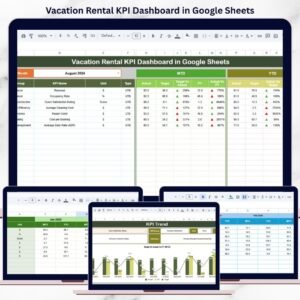
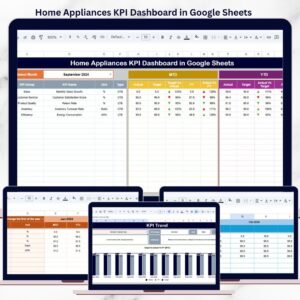
📈 KPI Trend Analysis – A dedicated trend sheet lets you pick any KPI from a dropdown on cell C3 and view its MTD and YTD trend charts for Actual, Target, and PY values, plus the KPI Group, Unit, Type (LTB or UTB), Formula, and Definition.
📋 Structured Data Input – Three separate input sheets for Actual Numbers, Target Numbers, and Previous Year Numbers keep data organized and ensure formula integrity across the dashboard.
📝 KPI Definition Sheet – A master reference sheet where you define each KPI Name, KPI Group, Unit, Formula, KPI Definition, and KPI Type (LTB or UTB), ensuring standardized reporting across your team.
☁️ Cloud-Based Collaboration – Built in Google Sheets for real-time multi-user access, instant updates, and seamless sharing with team members or stakeholders.
📦 What’s Inside the Wealth Management KPI Dashboard
This template includes 6 worksheets designed specifically for tracking wealth management performance metrics:
📊 Dashboard Sheet – The main view showing all KPIs with MTD Actual, Target, PY data plus YTD Actual, Target, PY data. Conditional formatting arrows indicate Target vs Actual and PY vs Actual performance direction. Select any month from the dropdown on range D3.
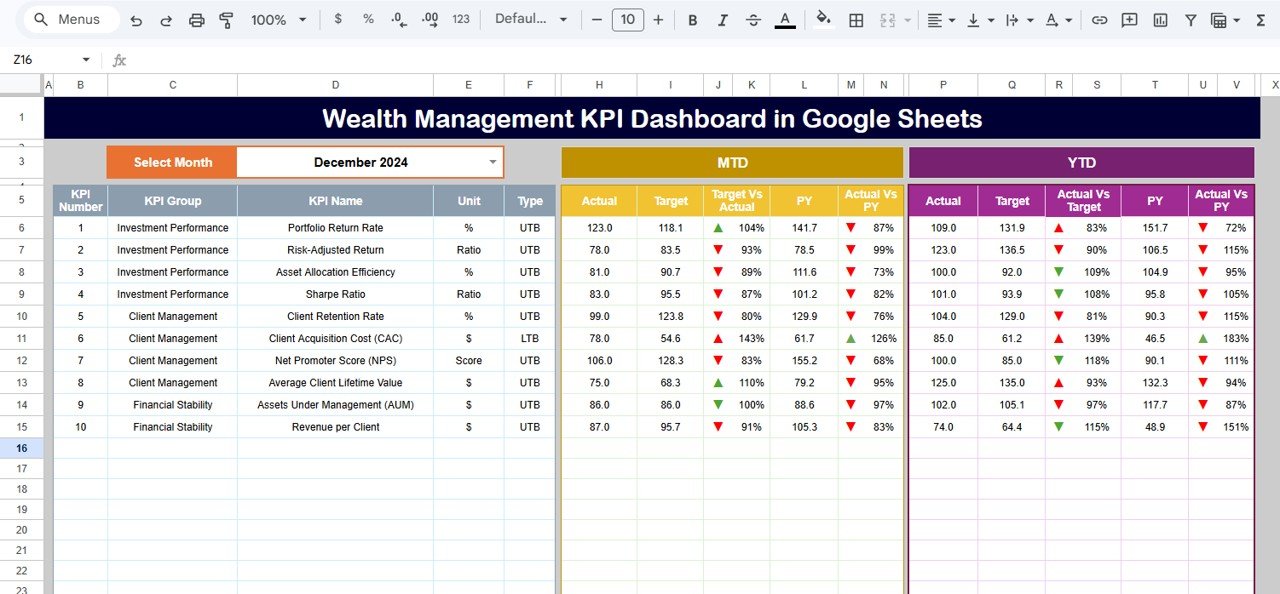 Wealth Management KPI Dashboard in Google Sheets
📈 KPI Trend Sheet – Select any KPI from the dropdown on cell C3 to view the KPI Group, Unit, Type, Formula, Definition, and MTD/YTD trend charts comparing Actual, Target, and Previous Year numbers.
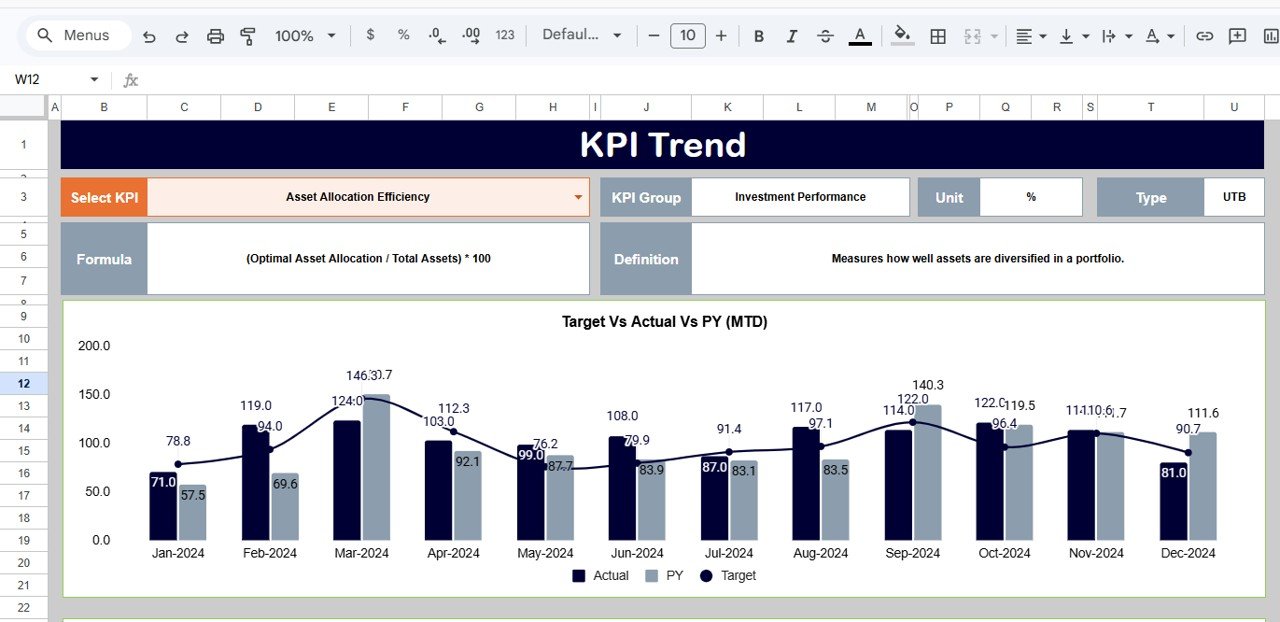 KPI Trend Sheet
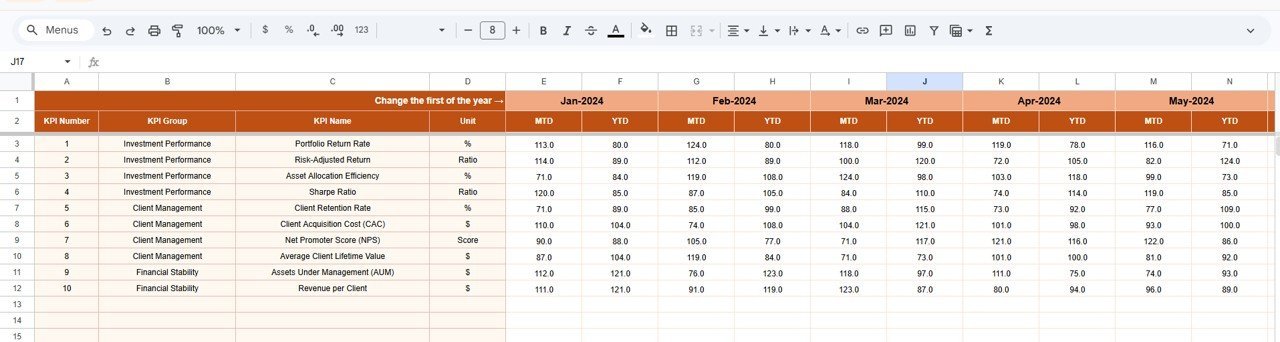
📝 Actual Numbers Input Sheet – Enter YTD and MTD actual values for each KPI per month. Change the first month of the year on range E1 to customize the reporting period.
 Actual Numbers Input Sheet
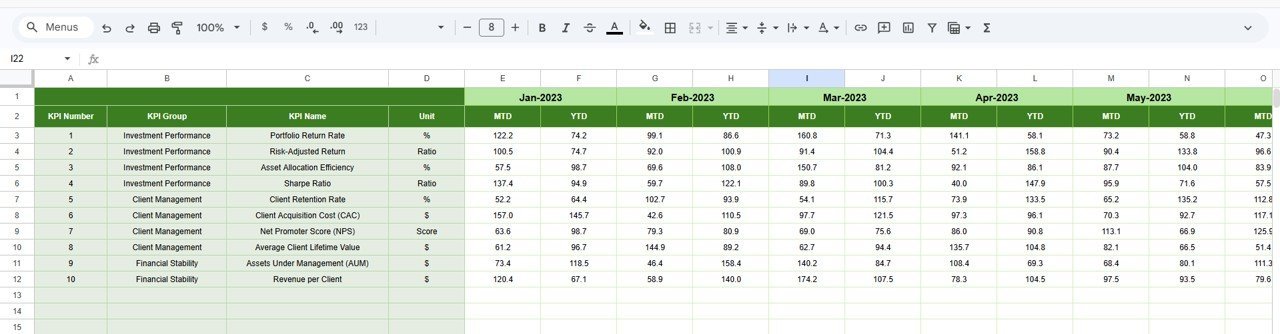
🎯 Target Number Input Sheet – Enter MTD and YTD target numbers for each KPI across all 12 months.
 Target Number Input Sheet
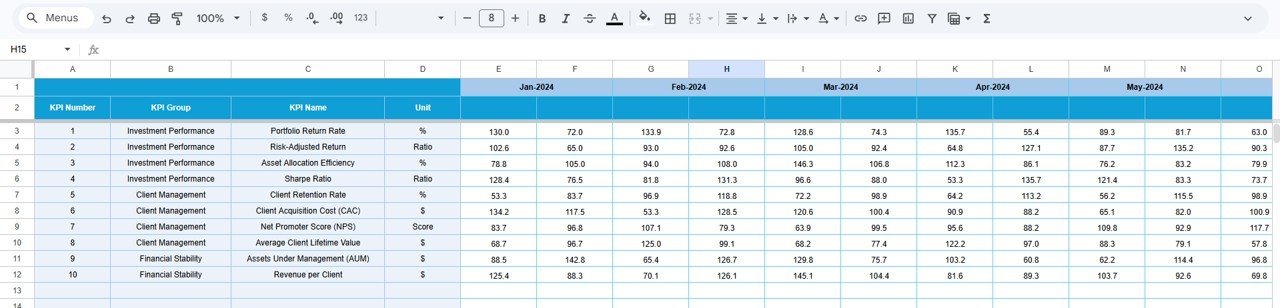
📅 Previous Year Number Sheet – Record prior year KPI values in the same format as the current year for YoY comparison.
 Previous Year Number Input Sheet
📘 KPI Definition Sheet – Define each KPI Name, KPI Group, Unit, Formula, KPI Definition, and KPI Type (LTB or UTB) in the last column.
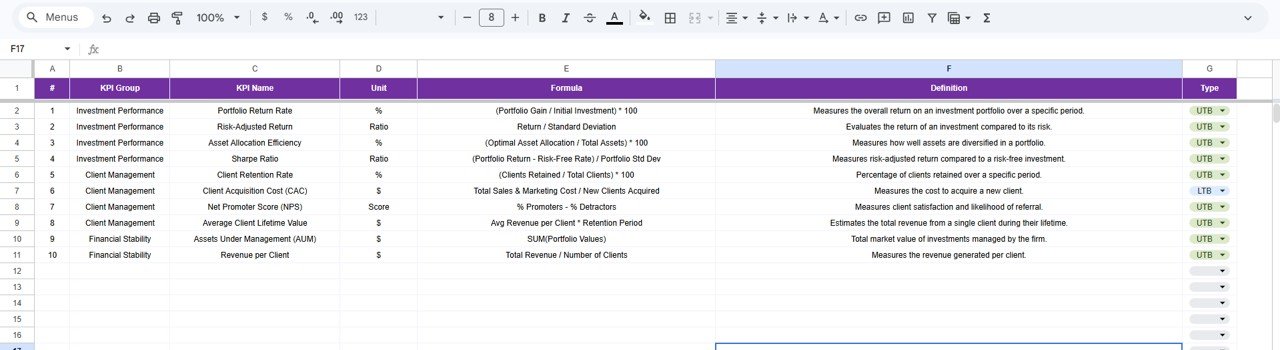 KPI Definition Sheet
📊 Wealth Management KPI Dashboard vs. Microsoft Excel Dashboard vs. Wealthbox CRM — Where This Fits
| Feature | Wealth Management KPI Dashboard (Google Sheets) | Microsoft Excel Dashboard | Wealthbox CRM |
|---|---|---|---|
| Cost | $8.99 one-time | Requires Microsoft 365 ($6.99/mo) | $59/user/month |
| Platform | Google Sheets (free) | Desktop Excel | Cloud SaaS |
| Setup Time | Under 10 minutes | 30-60 minutes | 2-5 days |
| Real-Time Team Collaboration | ✅ Built-in | Limited (OneDrive) | ✅ Yes |
| Mobile Access | ✅ Google Sheets app | Limited | ✅ Yes |
| Customizable KPIs | ✅ Fully editable | ✅ Manual setup | ❌ Fixed modules |
| Share with Link | ✅ One click | ❌ File sharing | ✅ Yes |
| Year-1 Cost at 5 Users | $8.99 total | $419.40 | $3,540 |
| MTD/YTD Trend Charts | ✅ Pre-built | Manual chart setup | ✅ Built-in |
For wealth management teams that want structured KPI tracking without paying $59/user/month for CRM software, the Wealth Management KPI Dashboard in Google Sheets sits in the sweet spot.
👥 Who This Template Is For — and Who It’s Not For
✅ This template is built for:
- Independent financial advisors tracking 10-50 client portfolio KPIs
- Wealth management firms with 2-20 team members who need a shared KPI view
- Family offices monitoring investment performance across asset classes
- Finance students and analysts learning KPI-based portfolio evaluation
❌ This template is NOT for:
- Enterprise wealth management firms needing SOC 2 compliance and SSO integration
- Teams requiring real-time market data feeds or automated API connections
- Organizations needing CRM functionality alongside portfolio tracking
⚙️ How to Use the Wealth Management KPI Dashboard
1️⃣ Open the Google Sheets file and make a copy to your Google Drive.
2️⃣ Go to the KPI Definition sheet and enter your wealth management KPIs, groups, units, formulas, and definitions.
3️⃣ Enter your target numbers in the Target Number Input sheet for each month.
4️⃣ Input actual performance data in the Actual Numbers Input sheet as each month closes.
5️⃣ Record previous year data in the Previous Year Number sheet for year-over-year comparison.
6️⃣ Go to the Dashboard sheet, select a month from the dropdown on D3, and review all KPI performance.
7️⃣ Use the KPI Trend sheet to analyze individual KPI movement over time.
💼 Real-World Use Cases
David runs a boutique wealth advisory firm with 8 advisors. He uses the Wealth Management KPI Dashboard to track client acquisition cost, AUM growth rate, and portfolio return across the team. Each month, his operations manager inputs actual numbers, and David reviews the dashboard in their Monday meeting — replacing a $59/user/month CRM with an $8.99 spreadsheet.
Priya manages a family office overseeing $12M in assets. She tracks 15 KPIs including Sharpe ratio, asset allocation drift, and fee-to-revenue ratio using this dashboard. The YTD trend charts help her present quarterly performance reports to the family — without hiring an analyst or buying financial software.
Marco is a finance student building his portfolio analysis skills. He uses the KPI Definition sheet to learn how wealth management metrics are calculated and tracks simulated portfolio data across all 12 months. The structured layout teaches him exactly how financial professionals evaluate investment performance.Wealth Management KPI Dashboard in Google Sheets
❓ Frequently Asked Questions
What KPIs does the Wealth Management KPI Dashboard track?
The Wealth Management KPI Dashboard in Google Sheets tracks any KPI you define — including Assets Under Management (AUM) growth, portfolio return, client acquisition cost, fee revenue, Sharpe ratio, and asset allocation efficiency. All KPIs update automatically when you enter monthly data.Wealth Management KPI Dashboard in Google Sheets
How long does it take to set up this dashboard?
Setup takes under 10 minutes. Copy the template to your Google Drive, define your KPIs in the KPI Definition sheet, enter target and actual numbers, and the dashboard calculates everything automatically. No formulas or coding needed.
Can I customize the KPIs for my specific wealth management practice?
Yes. The KPI Definition sheet lets you add, remove, or modify any KPI. You control the KPI name, group, unit, formula, definition, and whether it is Lower-the-Better or Upper-the-Better. The dashboard adapts to your definitions.
How does this compare to Wealthbox CRM or Salesforce Financial Cloud?
The Wealth Management KPI Dashboard costs $8.99 one-time versus $59/user/month for Wealthbox or $300+/user/month for Salesforce Financial Cloud. It focuses specifically on KPI tracking and trend analysis rather than full CRM functionality — ideal for teams that need performance monitoring without enterprise software costs.
Can multiple team members access the dashboard simultaneously?
Yes. Built in Google Sheets, the dashboard supports real-time multi-user collaboration. Share it via link or email, and multiple team members can view or edit the data simultaneously without version conflicts.
Does the dashboard support year-over-year comparison?
Yes. The Previous Year Number sheet stores last year’s KPI values. The Dashboard sheet automatically calculates PY vs Actual variance with conditional formatting arrows, giving you instant year-over-year performance visibility.Wealth Management KPI Dashboard in Google Sheets
Is this template suitable for regulatory reporting?
The dashboard is designed for internal KPI monitoring and performance tracking. While it provides structured data for compliance discussions, it is not a regulatory filing tool. You can export data from the sheets to supplement formal regulatory reportsWealth Management KPI Dashboard in Google Sheets
👤 About the Author
Built by PK — Microsoft Certified Professional with 15+ years of Excel, Google Sheets, and Power BI experience. Founder of NextGenTemplates, reaching 300K+ subscribers across YouTube channels (@PK-AnExcelExpert, @NextGenTemplates, @NeoTechNavigators). Every template is hand-built and tested before release.
🔗 Explore Related Templates
📊 Investment Management KPI Scorecard in Google Sheets — Track portfolio return, Sharpe ratio, and investment cost ratios with traffic light indicators and trend analysis.
💰 Net Worth Tracker in Google Sheets — Monitor assets, liabilities, and net worth growth month-over-month with automatic calculations.
✅ Investment Portfolio Checklist in Google Sheets — Track and manage investment-related tasks with progress tracking and deadline monitoring.
📂 Browse all Google Sheets KPI Dashboards for more industry-specific templates.
📖 Click here to read the Detailed Blog Post
🎥 Visit our YouTube channel for step-by-step video tutorials
👉 YouTube.com/@NextGenTemplates


Reviews
There are no reviews yet.