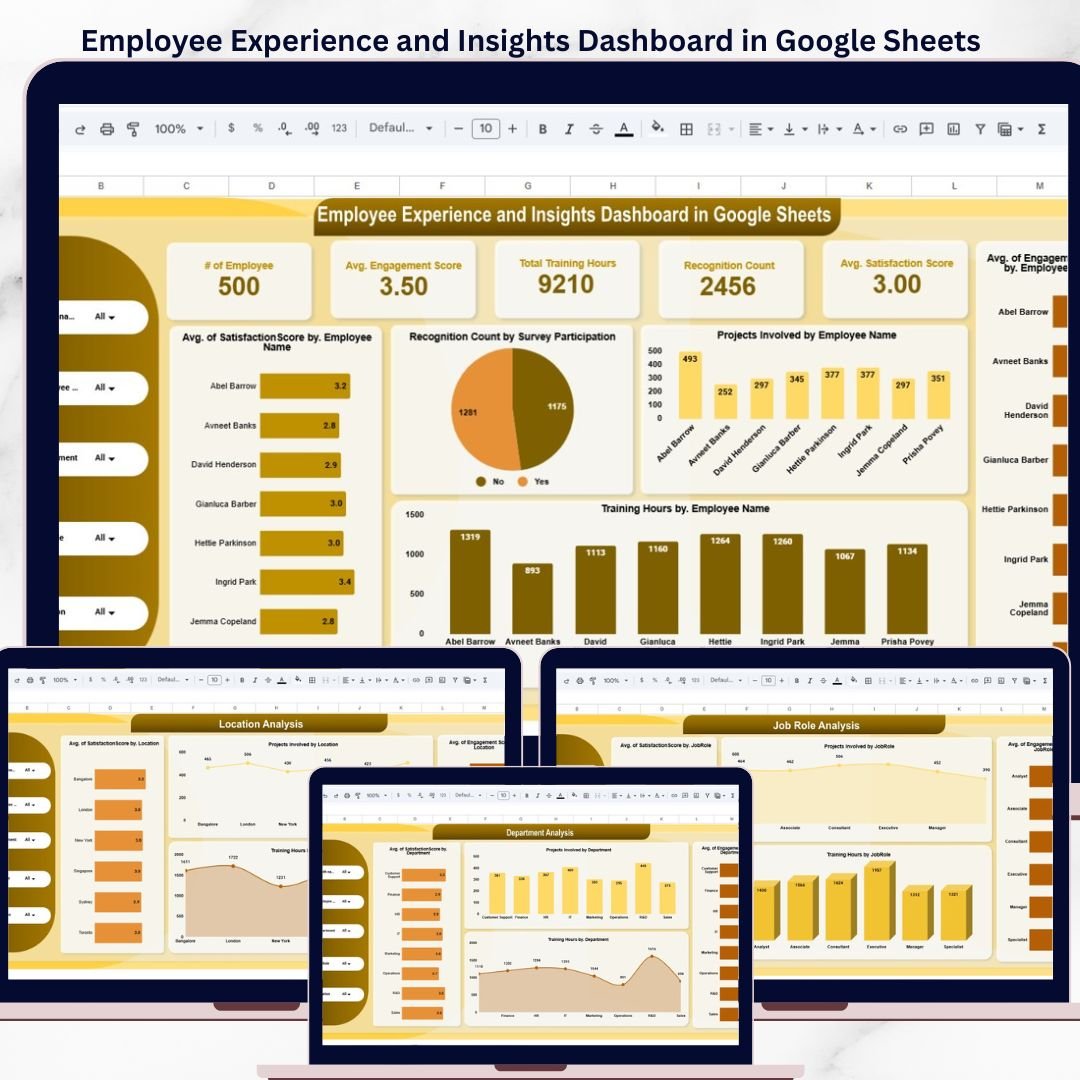

The Employee Experience and Insights Dashboard in Google Sheets tracks 5 core KPIs across 6 interactive pages, with 20+ pre-built charts, slicers, and filters covering engagement scores, satisfaction ratings, training hours, and recognition counts. Setup takes under 10 minutes — just replace the sample data with your own and every chart updates automatically.Employee Experience and Insights Dashboard in Google Sheets
🌍 Join 8,400+ teams in 40+ countries using NextGenTemplates to replace paid SaaS tools with one-time-purchase Excel, Google Sheets, Power BI, and HTML templates.Employee Experience and Insights Dashboard in Google Sheets
✅ Instant download · One-time payment · No subscription · No per-user fees · Lifetime access
🔑 Key Features of Employee Experience and Insights Dashboard in Google Sheets
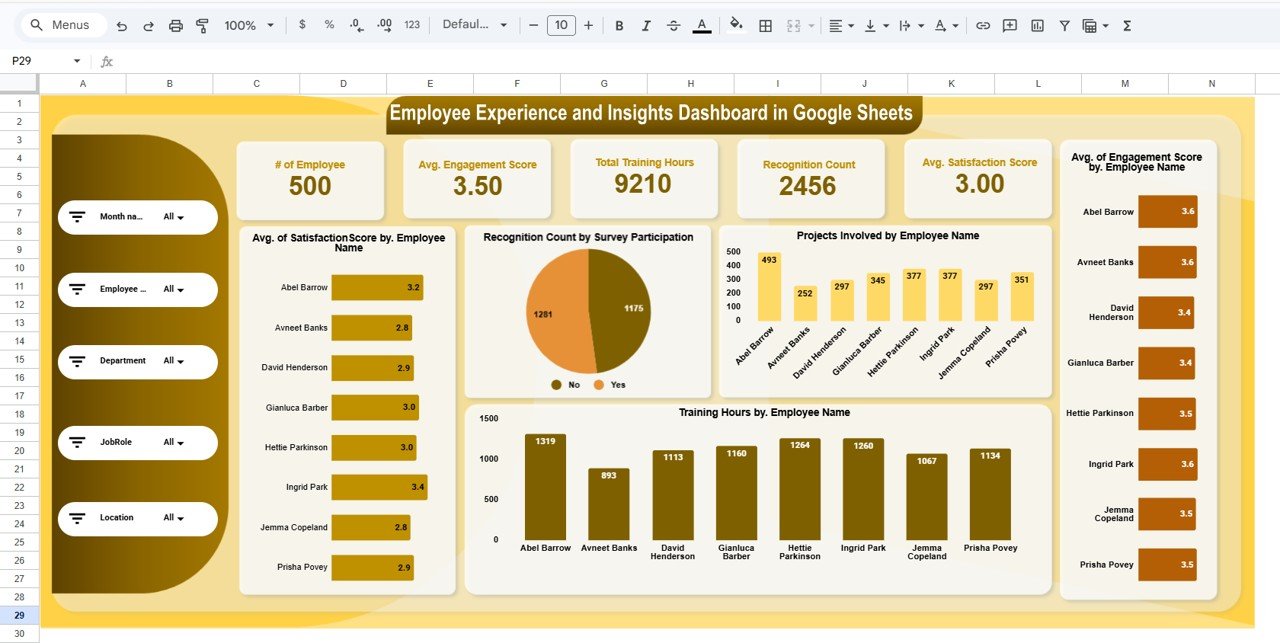
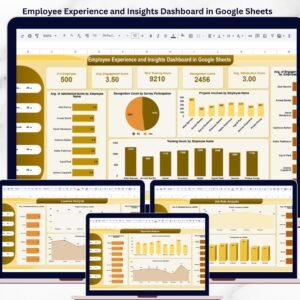
📊 5 KPI Cards on Overview Page – Track # of Employees, Avg. Engagement Score, Total Training Hours, Recognition Count, and Avg. Satisfaction Score in a single view. Each card updates automatically from your raw data.
📈 20+ Interactive Charts – Visualize Avg. Satisfaction Score by Employee Name, Recognition Count by Survey Participation, Projects Involved by Employee Name, Training Hours by Employee Name, and Avg. Engagement Score by Employee Name directly on the overview page. Slicers let you filter the entire dashboard instantly.Employee Experience and Insights Dashboard in Google Sheets
🏢 Multi-Dimensional Analysis Pages – Dedicated Location Analysis, Department Analysis, Job Role Analysis, and Monthly Trend pages break down satisfaction, engagement, training, and project data by each dimension. Every page follows a consistent 4-chart layout for easy comparison.Employee Experience and Insights Dashboard in Google Sheets
🔍 Slicer-Based Filtering – Multiple slicers on the overview page let you filter by department, location, job role, or any combination to see specific segments of your workforce. Results update across all charts simultaneously.Employee Experience and Insights Dashboard in Google Sheets
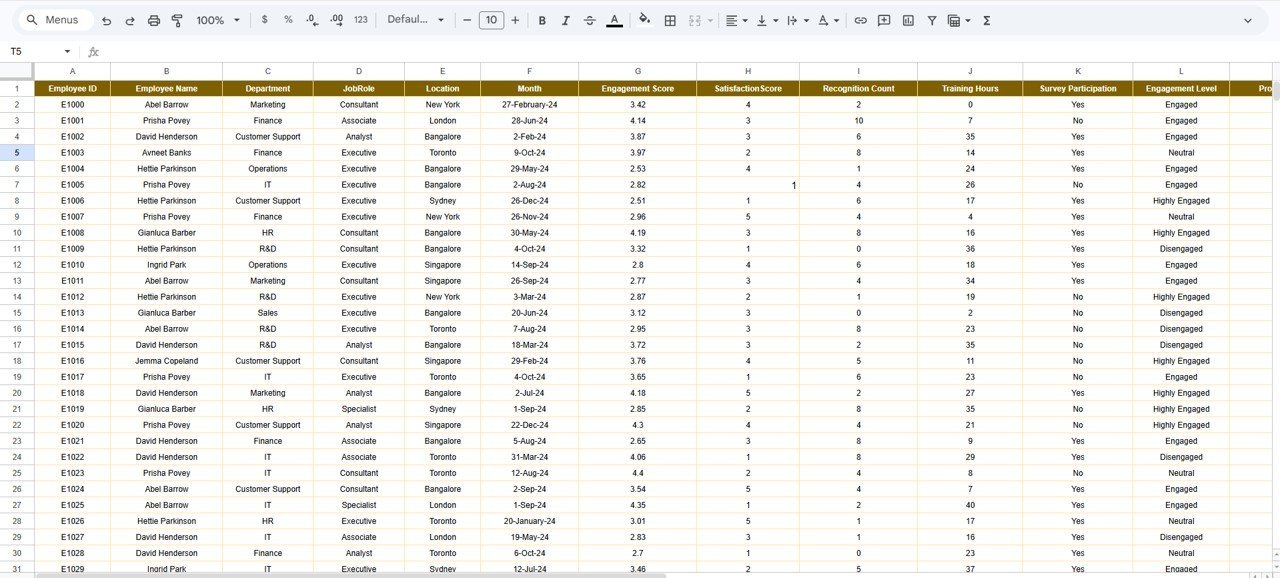
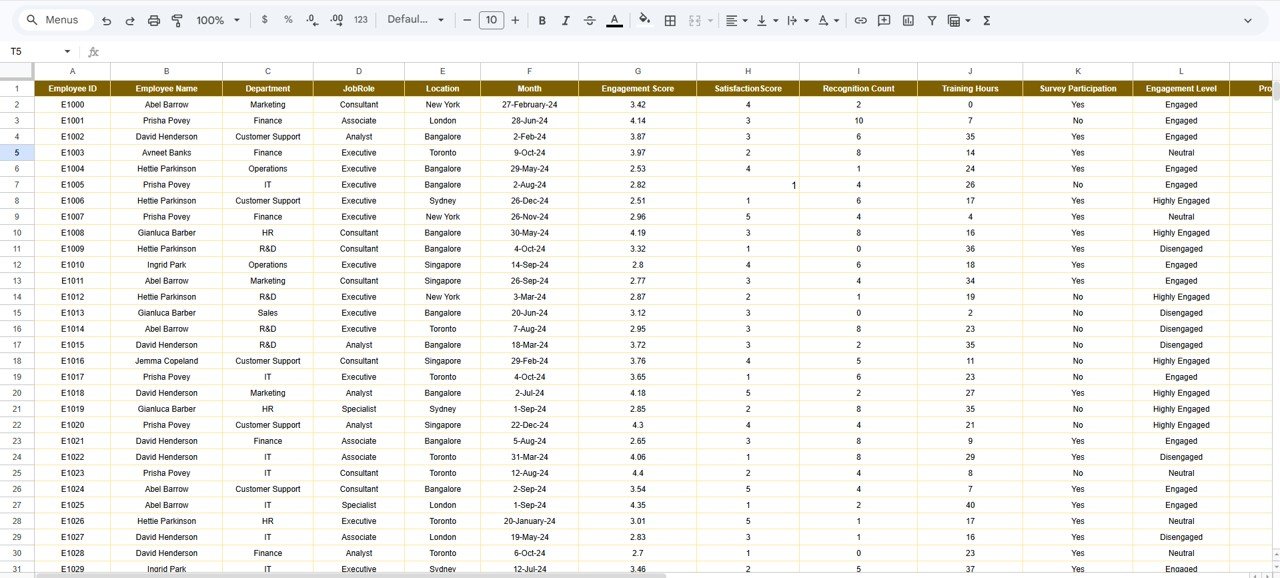
📋 Structured Data Sheet – A dedicated data entry sheet keeps all employee records in one place with a clean, repeatable format. Simply paste your data in the same structure and the entire dashboard auto-refreshes.Employee Experience and Insights Dashboard in Google Sheets
This dashboard consolidates employee engagement scores, satisfaction ratings, training hours, recognition counts, and project involvement into one unified view — eliminating the need for separate HR survey tools or paid engagement platforms like Google Sheets Dashboard Templates.
📦 What’s Inside the Employee Experience and Insights Dashboard
📌 Overview Page – The main dashboard page displays 5 KPI cards (# of Employees, Avg. Engagement Score, Total Training Hours, Recognition Count, Avg. Satisfaction Score) and 5 analytical charts covering satisfaction, recognition, projects, training, and engagement by employee. Multiple slicers enable quick filtering.
 Employee Experience and Insights Dashboard in Google Sheets
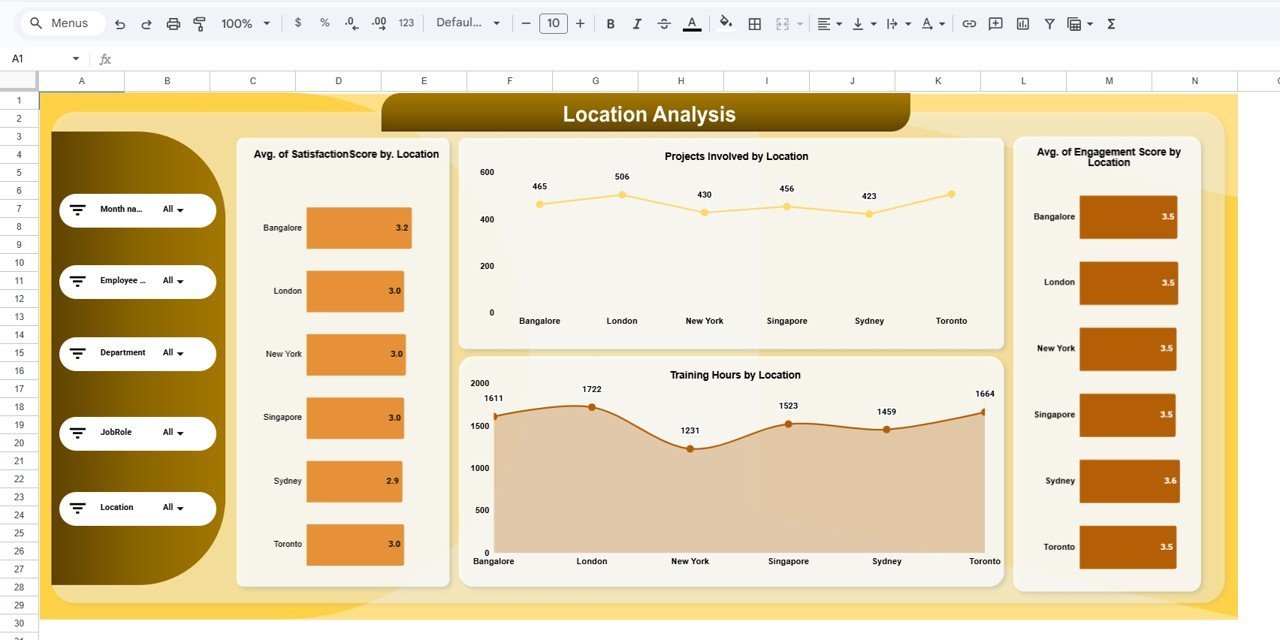
📌 Location Analysis – Breaks down Avg. Satisfaction Score by Location, Projects Involved by Location, Training Hours by Location, and Avg. Engagement Score by Location. Identify which office locations have the highest engagement and where intervention is needed.
 Location Analysis
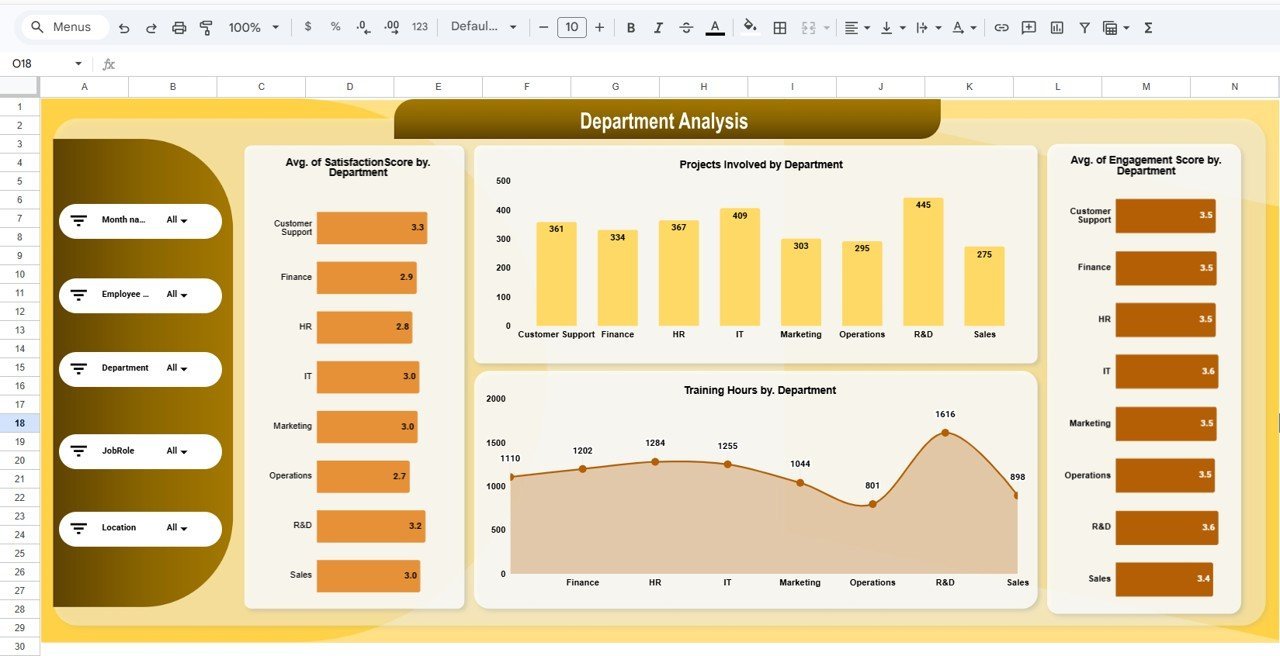
📌 Department Analysis – Charts for Avg. Satisfaction Score by Department, Projects Involved by Department, Training Hours by Department, and Avg. Engagement Score by Department. Spot departmental trends and allocate HR resources effectively.
 Department Analysis
📌 Job Role Analysis – Visualizes Avg. Satisfaction Score by Job Role, Projects Involved by Job Role, Training Hours by Job Role, and Avg. Engagement Score by Job Role. Understand which roles report the highest satisfaction and which need attention.
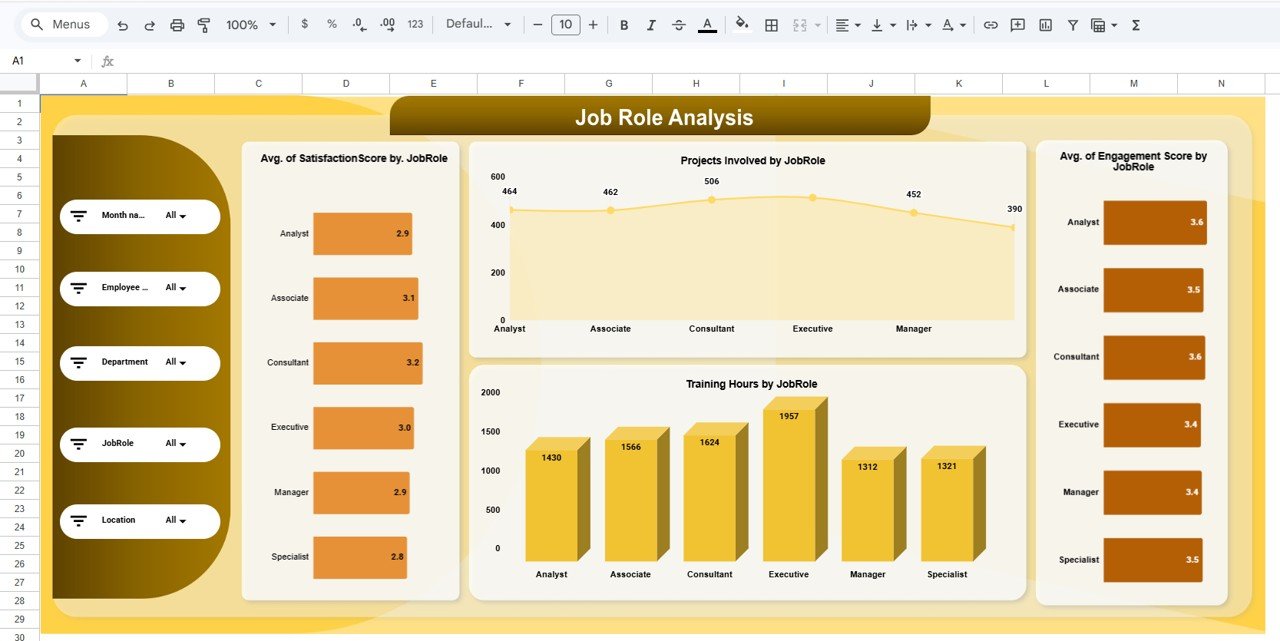 Job Role Analysis
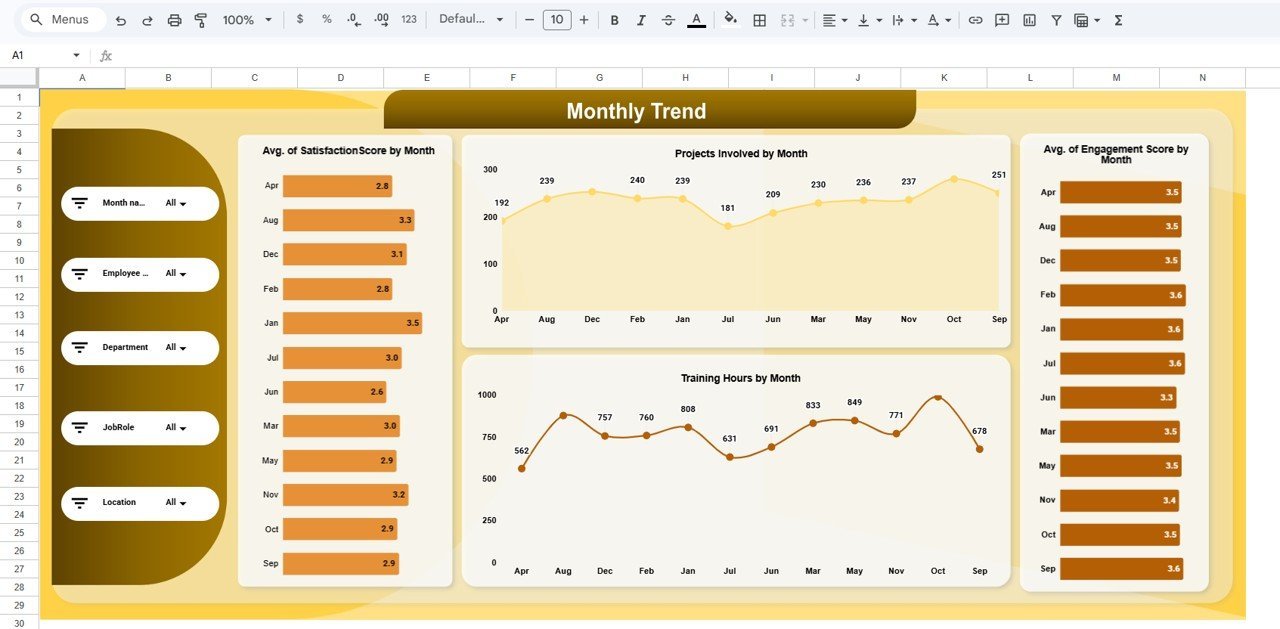
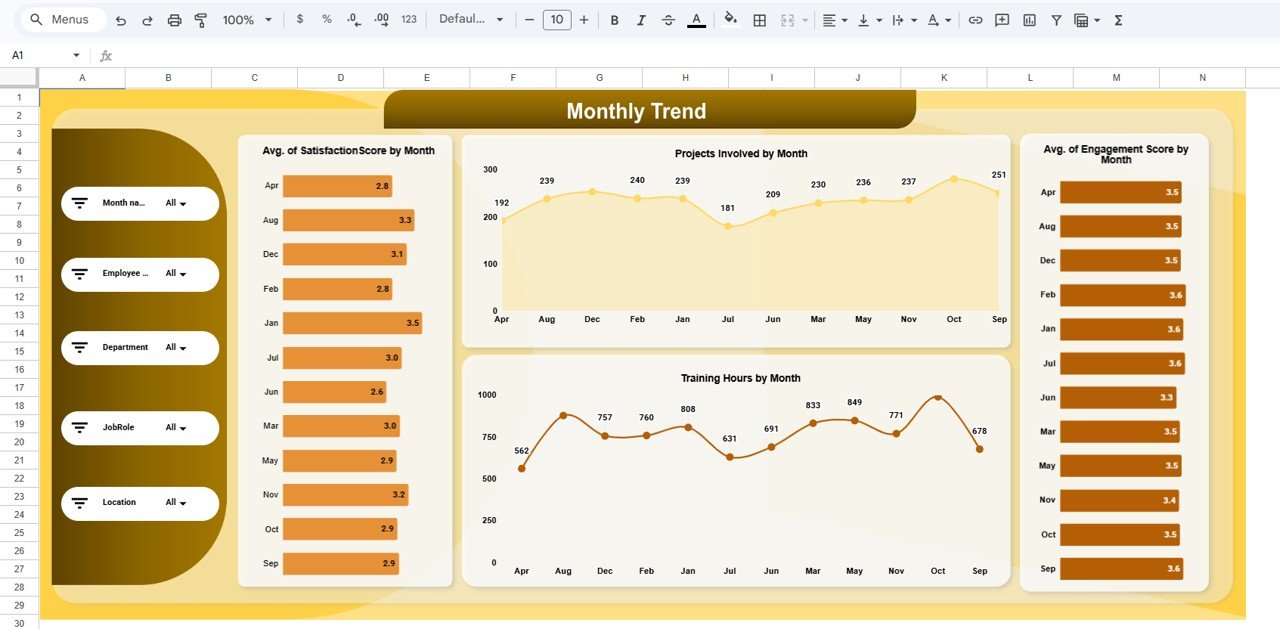
📌 Monthly Trend – Tracks Avg. Satisfaction Score by Month, Projects Involved by Month, Training Hours by Month, and Avg. Engagement Score by Month. Monitor seasonal patterns and the impact of HR initiatives over time.
 Monthly Trend
📌 Data Sheet – The raw data entry sheet where you add employee records in the same structured format. Fields include employee name, department, location, job role, engagement score, satisfaction score, training hours, recognition count, projects involved, and survey participation. Replace the sample data and every dashboard page updates.
 Data Sheet Tab
📊 Employee Experience Dashboard in Google Sheets vs. Excel Dashboard vs. BambooHR — Where This Fits
| Feature | Employee Experience Dashboard (Google Sheets) | Excel Employee Dashboard | BambooHR / Culture Amp |
|---|---|---|---|
| Cost | $9.99 one-time | $15-25 one-time | $6-12 / user / month |
| Platform | Google Sheets (free, browser-based) | Microsoft Excel (license required) | Web app (subscription) |
| Setup Time | Under 10 minutes | 10-15 minutes | 2-4 weeks onboarding |
| Real-Time Collaboration | ✅ Built-in (Google Sheets) | Limited (OneDrive/SharePoint) | ✅ Yes |
| Mobile Access | ✅ Google Sheets app | Limited on mobile | ✅ Yes |
| Customizable Fields | ✅ Fully editable | ✅ Fully editable | Limited customization |
| Share with Link | ✅ One-click sharing | Requires file sharing | Role-based access only |
| Year-1 Cost (5 users) | $9.99 total | $15-25 total | $360-720 / year |
| Multi-Dimension Analysis | ✅ Location, Dept, Role, Monthly | Varies by template | ✅ Yes |
For HR teams that want employee experience visibility without paying $6-12 per user per month, the Employee Experience and Insights Dashboard in Google Sheets sits in the sweet spot.
👥 Who This Template Is For — and Who It’s Not For
✅ This template is built for:
- HR managers at 10-500 person companies tracking engagement and satisfaction trends
- People Operations leads who need a visual summary for leadership without enterprise HR software
- Small business owners monitoring training investment, recognition, and employee sentiment
- Consultants preparing workforce analytics reports for multiple clients
❌ This template is NOT for:
- Enterprise HR teams needing SOC 2 compliance, SSO, and automated survey distribution
- Organizations requiring real-time pulse survey integration (this uses manual data entry)
- Teams needing payroll, benefits administration, or HRIS functionality
⚙️ How to Use the Employee Experience and Insights Dashboard
- Open the PDF guide included in your download — it contains the Google Sheets copy link.
- Click the copy link to create your own editable version in Google Drive.
- Go to the Data Sheet tab and replace the sample data with your actual employee records.
- Navigate to the Overview page — all 5 KPI cards and charts update automatically.
- Use the slicers to filter by department, location, or job role for targeted insights.
- Check the Location, Department, Job Role, and Monthly Trend tabs for dimensional analysis.
- Share with your team using the Google Sheets sharing link for real-time collaboration.
💼 Real-World Use Cases
Priya manages HR at a 120-person IT services firm in Bangalore. She uses the Employee Experience and Insights Dashboard to track engagement scores across 4 office locations, identify which departments have the lowest satisfaction ratings, and present monthly trend reports to the leadership team — without paying $8 per user per month for Culture Amp.Employee Experience and Insights Dashboard in Google Sheets
Marcus runs People Operations at a 45-person marketing agency in Chicago. He replaced a manual spreadsheet with this dashboard to monitor training hours by job role, track recognition counts, and compare engagement trends month over month. The slicer-based filtering saves him 3 hours per week on reporting.Employee Experience and Insights Dashboard in Google Sheets
Elena consults for 6 mid-size manufacturing clients across Europe. She duplicates this template for each client, customizes the data fields, and delivers branded workforce analytics reports — turning a $9.99 template into a recurring consulting deliverable.Employee Experience and Insights Dashboard in Google Sheets
❓ Frequently Asked Questions
What KPIs does the Employee Experience and Insights Dashboard track?
The Employee Experience and Insights Dashboard tracks 5 core KPIs: number of employees, average engagement score, total training hours, recognition count, and average satisfaction score. All metrics update automatically when you replace the sample data.
Can I filter the dashboard by department or location?
Yes. The overview page includes multiple slicers that let you filter by department, location, job role, or any combination. All charts on the page update simultaneously when a filter is applied.
How does this compare to BambooHR or Culture Amp?
The Employee Experience Dashboard costs $9.99 one-time versus $6-12 per user per month for BambooHR or Culture Amp. It covers the same engagement and satisfaction analytics without ongoing subscription costs or lengthy onboarding.Employee Experience and Insights Dashboard in Google Sheets
How long does setup take?
Setup takes under 10 minutes. Open the PDF guide, click the Google Sheets copy link, replace the sample data with your own employee records, and every chart and KPI card updates automatically.Employee Experience and Insights Dashboard in Google Sheets
Can I add more employees or departments?
Yes. The data sheet is fully editable — add as many rows as you need. New departments, locations, or job roles appear automatically in the analysis pages and slicer filters.Employee Experience and Insights Dashboard in Google Sheets
Does the dashboard work on mobile?
Yes. Google Sheets works on any device through the Google Sheets mobile app or browser. You can view, filter, and share the dashboard from your phone or tablet.Employee Experience and Insights Dashboard in Google Sheets
Can I share this dashboard with my team?
Yes. Google Sheets supports real-time collaboration — share with a link and your team can view or edit simultaneously. No additional licenses or per-user fees required.
👤 About the Author
Built by PK — Microsoft Certified Professional with 15+ years of Excel, Google Sheets, and Power BI experience. Founder of NextGenTemplates, reaching 300K+ subscribers across YouTube channels (@PK-AnExcelExpert, @NextGenTemplates, @NeoTechNavigators). Every template is hand-built and tested before release.Employee Experience and Insights Dashboard in Google Sheets
🔗 Explore Related Templates
📊 Workforce Engagement Dashboard in Google Sheets – Track workforce engagement metrics with drill-down analysis by team and department.
📊 HR Engagement Insights Dashboard in Google Sheets – Dedicated HR engagement analytics with survey response tracking and trend charts.
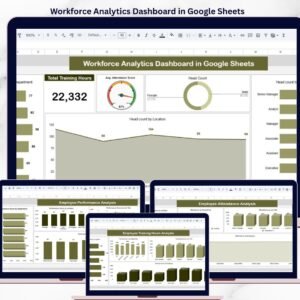
📊 Workforce Analytics Dashboard in Google Sheets – Broader workforce analytics covering headcount, attrition, diversity, and performance metrics.
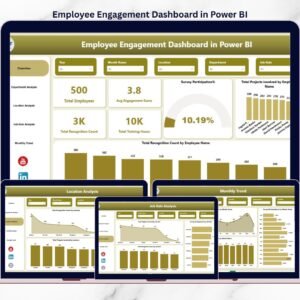
📊 Employee Engagement Dashboard in Power BI – Need Power BI? This version delivers the same engagement insights with Power BI’s advanced visualization capabilities.
📊 Browse all HR & Payroll Templates →
📖 Click here to read the Detailed Blog Post
🎥 Visit our YouTube channel for step-by-step video tutorials
👉 YouTube.com/@NextGenTemplates


Reviews
There are no reviews yet.