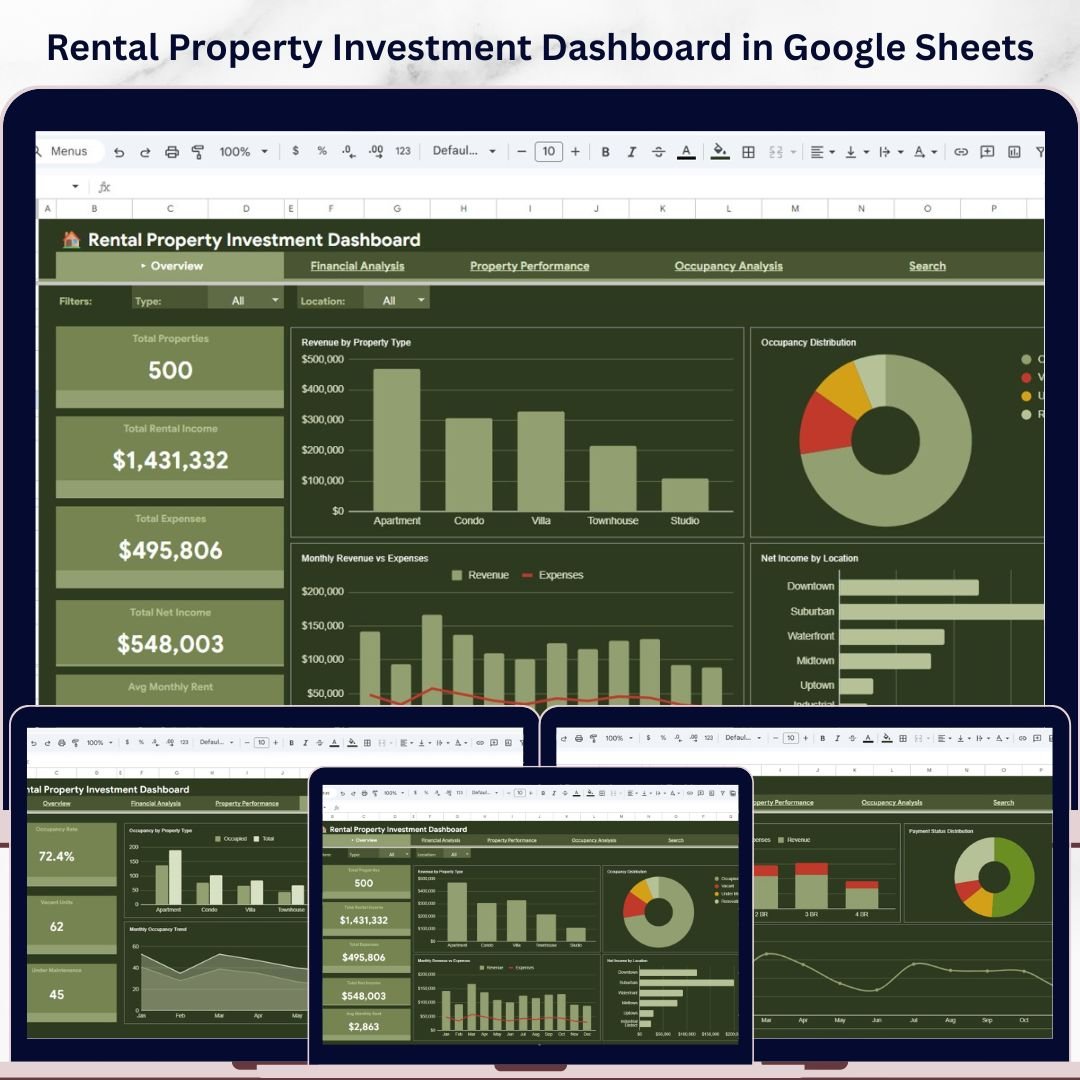

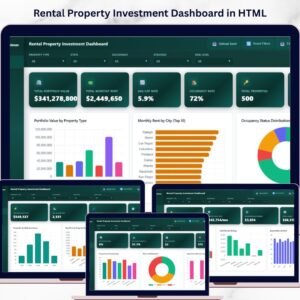
Rental Property Investment Dashboard in Google Sheets is a professionally designed, data-driven dashboard template built for property investors, landlords, real estate portfolio managers, and financial analysts who want to track every critical aspect of their rental property investments from a single, unified Google Sheets interface. This template includes 6 interactive dashboard pages covering overview, financial analysis, property performance, occupancy analysis, a search page, and a data sheet — making it the most comprehensive Google Sheets-based rental property analytics solution available today.
If you have been searching for a modern, cloud-based solution to manage your rental property portfolio without installing any software, the Rental Property Investment Dashboard in Google Sheets is exactly what you need. Simply make a copy in Google Drive, replace the sample data with your own, and start analyzing your property investments instantly. This dashboard transforms raw rental property data into beautiful, actionable visual insights that help you maximize returns and minimize risk 🚀.
🔑 Key Features of Rental Property Investment Dashboard in Google Sheets
📊 6 Interactive Dashboard Pages – The Rental Property Investment Dashboard in Google Sheets includes a comprehensive Overview page, Financial Analysis page, Property Performance page, Occupancy Analysis page, a smart Search page, and a Data sheet for easy data management.
📈 Real-Time KPI Cards – Track Total Properties, Total Rental Income, Total Expenses, Total Net Income, and Avg Monthly Rent at a glance from the overview page with dynamically updating KPI cards.
🔍 Advanced Slicer Filters – Apply quick filters using built-in Google Sheets slicers to view filtered dashboards by property type, location, manager, or any custom criteria instantly.
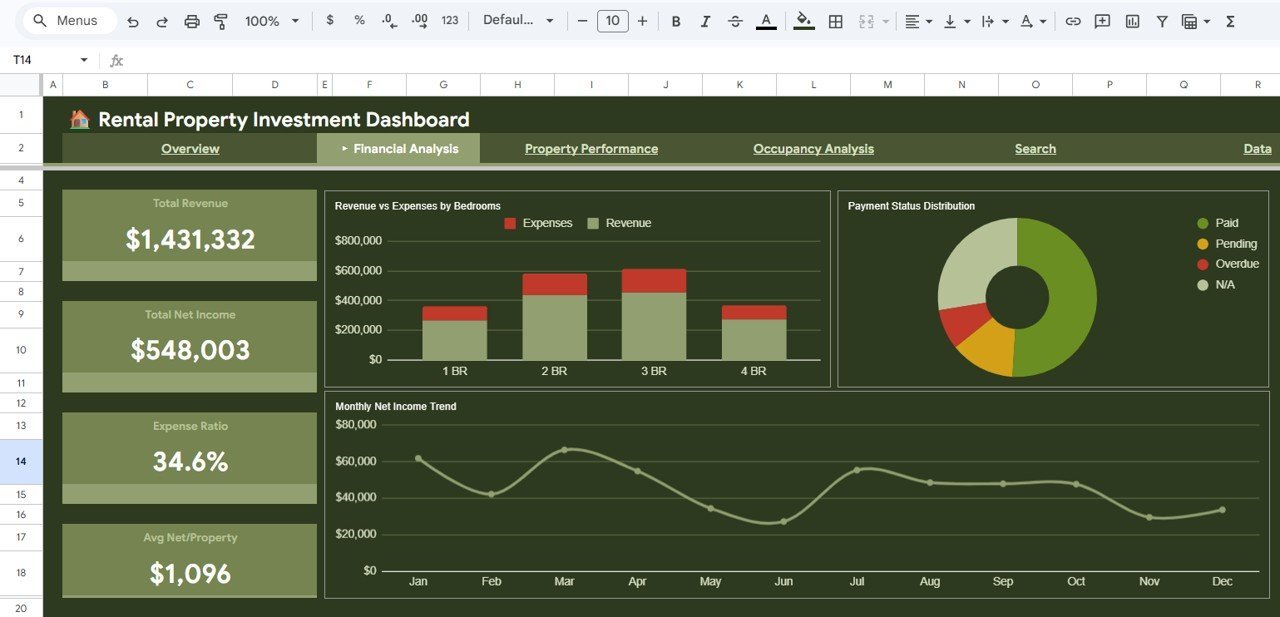
💰 Financial Analysis Module – Deep dive into Total Revenue, Total Net Income, Expense Ratio, Average Net per Property, Revenue vs Expenses by Bedrooms, Payment Status Distribution, and Monthly Net Income Trends.
🏠 Property Performance Tracking – Identify your Highest Rent and Lowest Rent properties, analyze Rent Spread, Revenue by Property Manager, Rent vs Expenses comparisons, and Properties per Manager distribution.
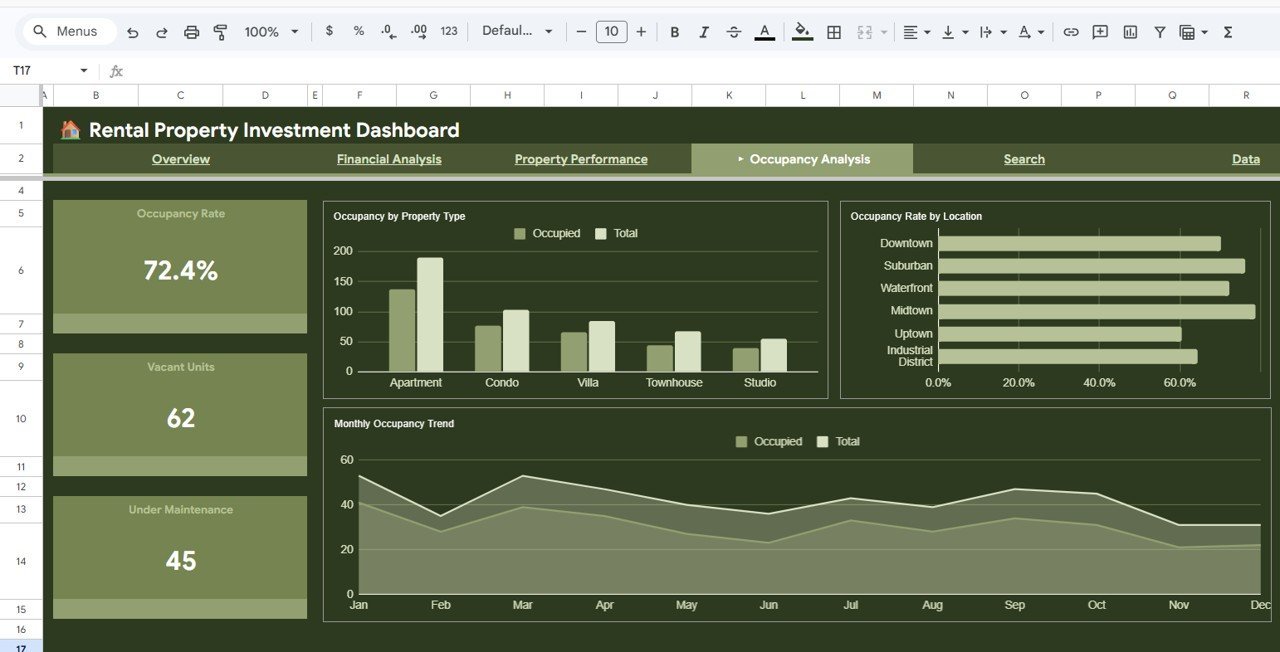
📋 Occupancy Analysis – Monitor Occupancy Rate, Vacant Units, Under Maintenance properties, Occupancy by Property Type, Occupancy Rate by Location, and Monthly Occupancy Trends to optimize your portfolio utilization.
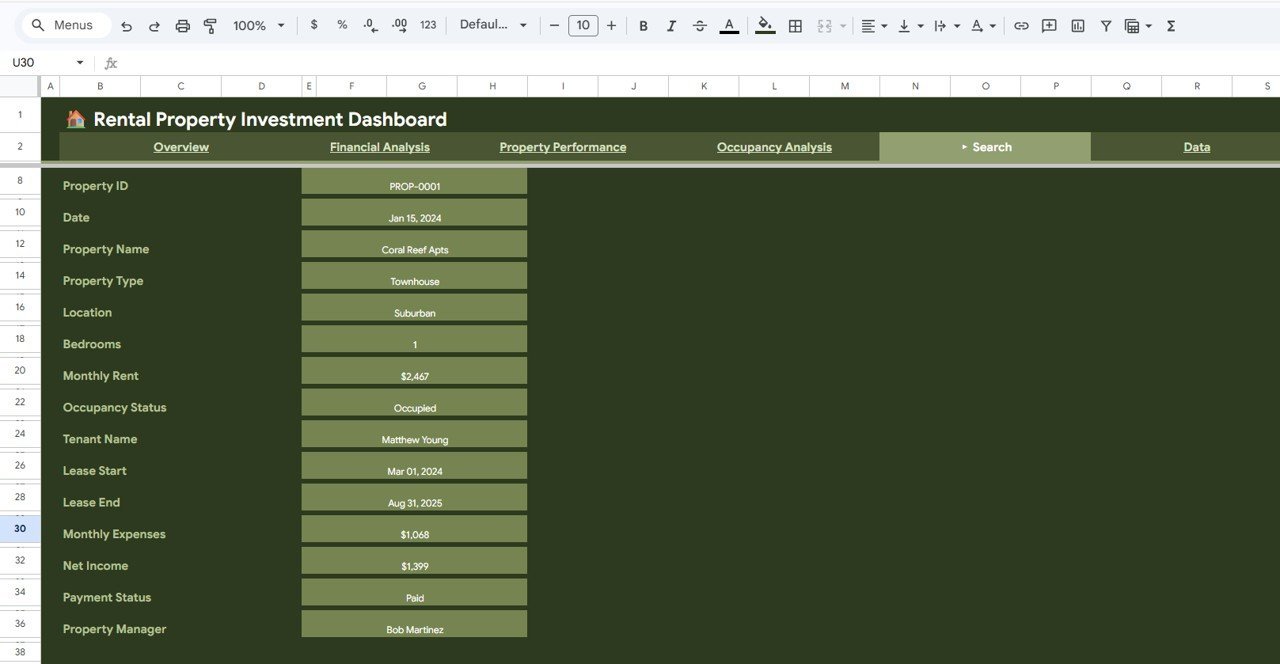
🔎 Smart Search Page – Look up any individual property record by selecting a Property ID to see all key details including Property Name, Type, Location, Bedrooms, Monthly Rent, Occupancy Status, Tenant Name, Lease Dates, Expenses, Net Income, Payment Status, and Property Manager.
☁️ Cloud-Based & Collaborative – Built entirely in Google Sheets so you can access it from anywhere, share with team members, and collaborate in real time without any desktop software installation.
Also explore our related Rental Property Investment Dashboard in Excel and Rental Property Investment Dashboard in Power BI if you prefer other platforms.
📦 What’s Inside the Rental Property Investment Dashboard in Google Sheets
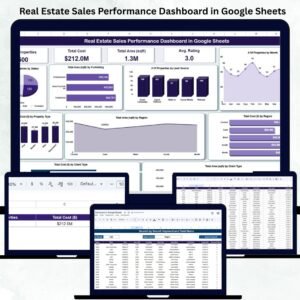
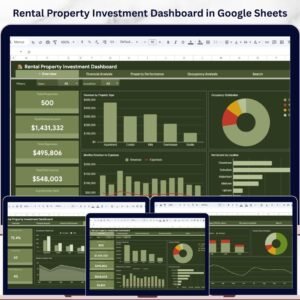
📌 Overview Page – Displays 5 KPI cards (Total Properties, Total Rental Income, Total Expenses, Total Net Income, Avg Monthly Rent) along with Revenue by Property Type, Monthly Revenue vs Expenses, Occupancy Distribution, and Net Income by Location charts with interactive slicers for quick filtering.
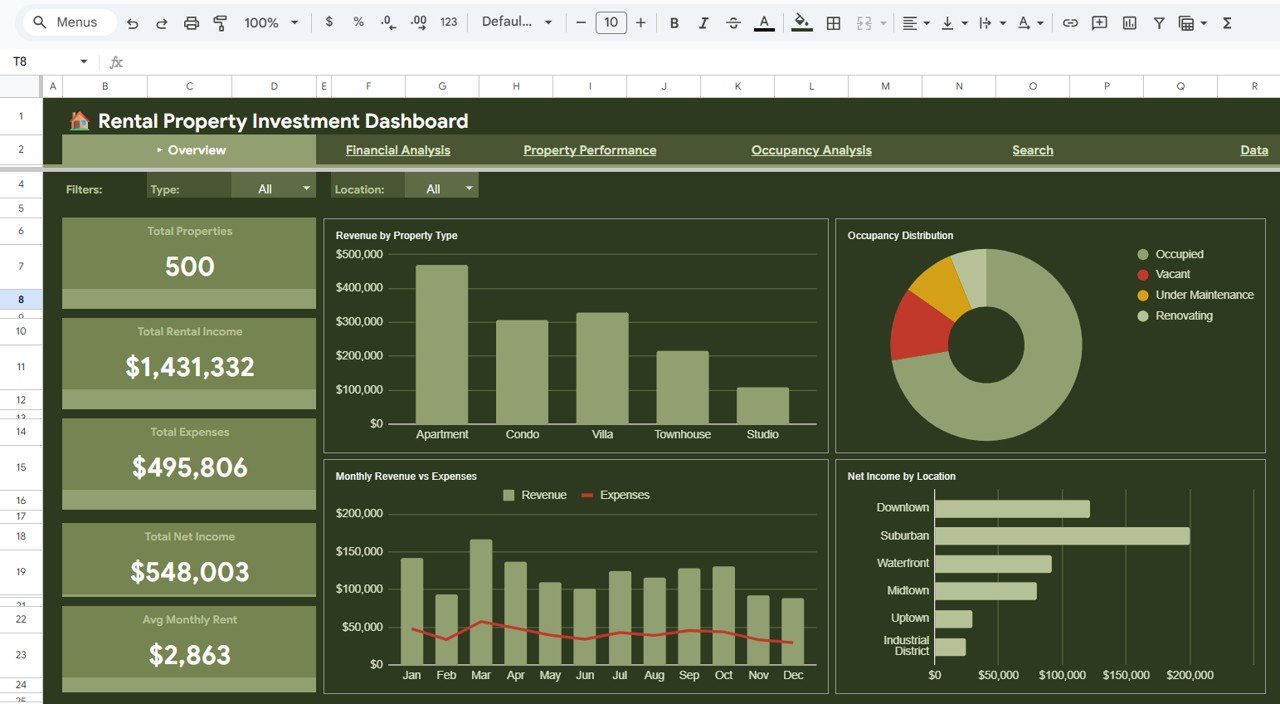 Rental Property Investment Dashboard in Google Sheets
📌 Financial Analysis Page – Provides deep financial insights with Total Revenue, Total Net Income, Expense Ratio, Avg Net/Property cards and charts for Revenue vs Expenses by Bedrooms, Payment Status Distribution, and Monthly Net Income Trend.
 Financial Analysis
📌 Property Performance Page – Highlights Highest Rent, Lowest Rent, Rent Spread, Revenue by Property Manager, Rent vs Expenses sample comparison, and Properties per Manager breakdown.
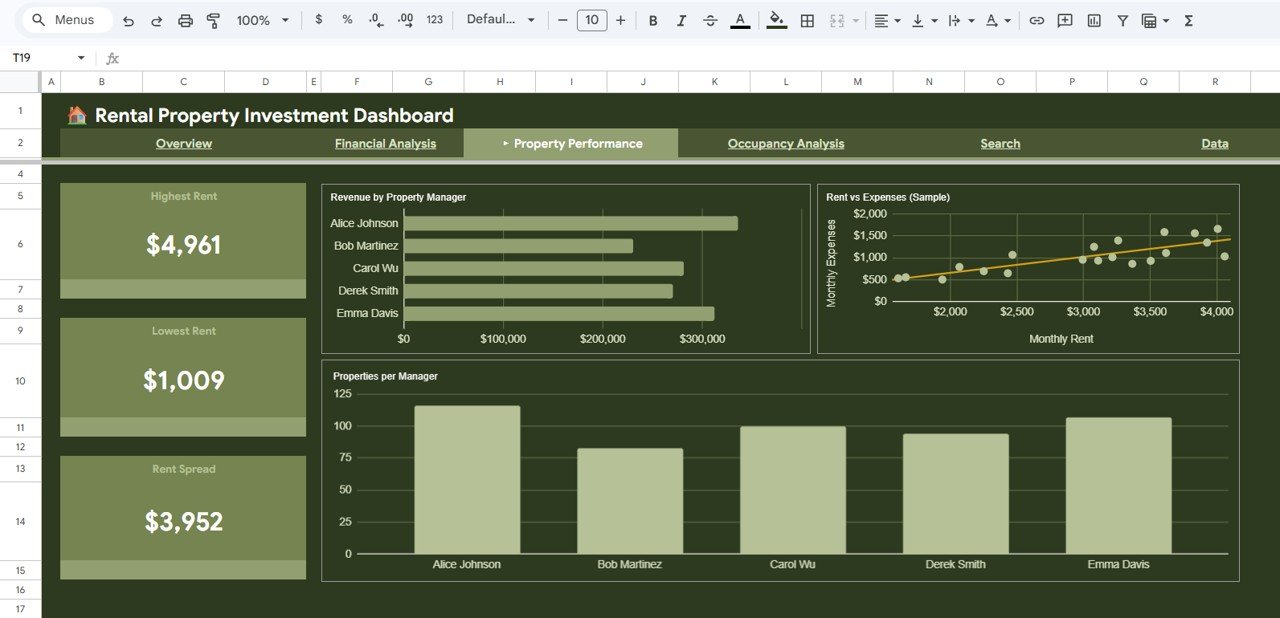 Property Performance
📌 Occupancy Analysis Page – Tracks Occupancy Rate, Vacant Units, Under Maintenance, Occupancy by Property Type, Occupancy Rate by Location, and Monthly Occupancy Trend for complete visibility.
 Occupancy Analysis
📌 Search Page – Select any Property ID to instantly view all property details including Property Name, Type, Location, Bedrooms, Monthly Rent, Occupancy Status, Tenant Name, Lease Start/End, Monthly Expenses, Net Income, Payment Status, and Property Manager.
 Search Sheet Tab
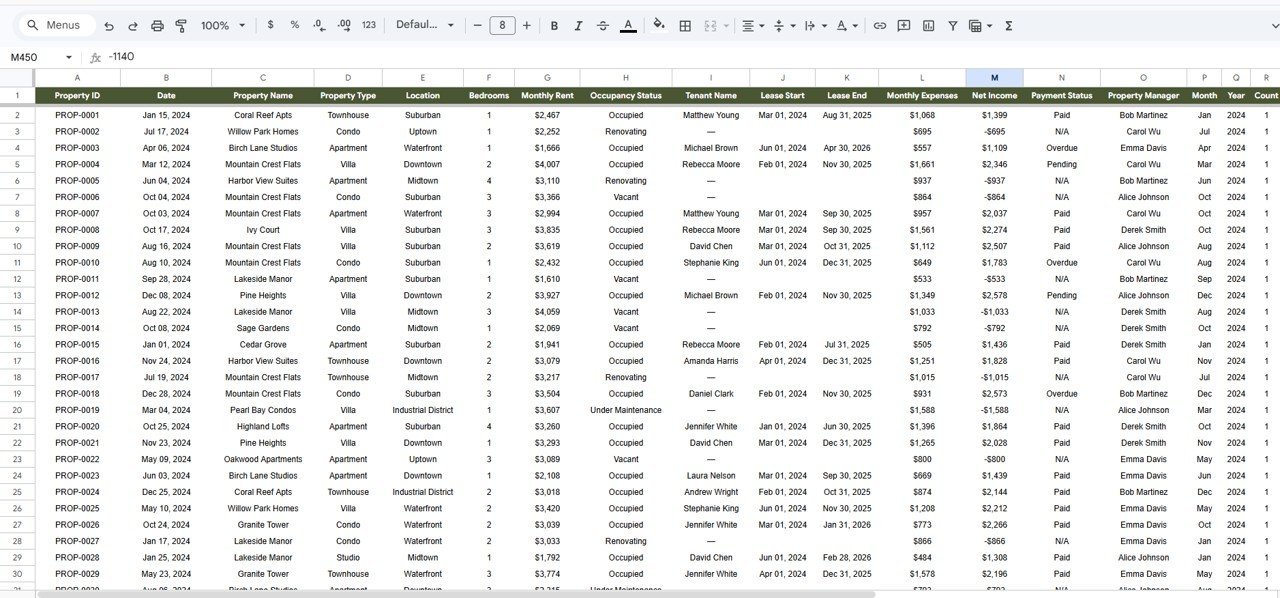
📌 Data Sheet – Enter your rental property data in a structured format and the entire dashboard auto-updates with your information.
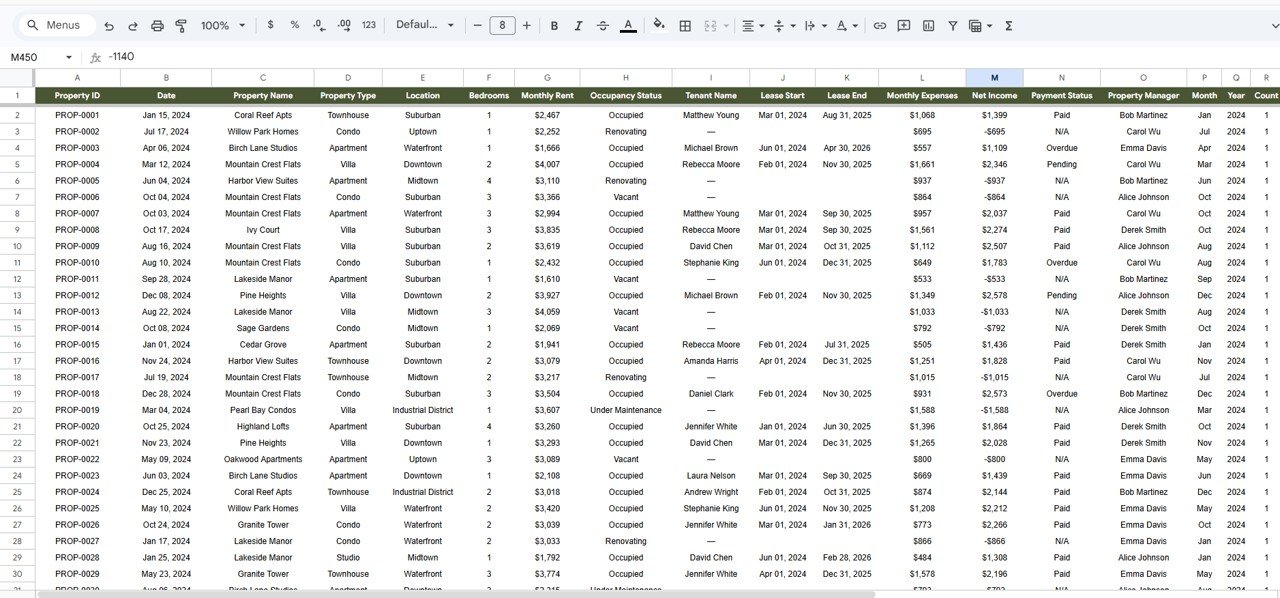 Data Sheet Tab
⚙️ How to Use the Rental Property Investment Dashboard in Google Sheets
1️⃣ After purchase, download the PDF guide and click the Google Sheets copy link to create your own editable copy in Google Drive.
2️⃣ Navigate to the Data sheet tab and replace the sample data with your own rental property records in the same format.
3️⃣ All 5 dashboard pages will auto-update with your data — use slicers and filters to view specific segments instantly.
4️⃣ Use the Search page to quickly look up any individual property by its Property ID.
5️⃣ Share the Google Sheet with your team for real-time collaboration and portfolio management.
👥 Who Can Benefit from This Rental Property Investment Dashboard in Google Sheets
🏢 Property Investors – Track rental income, expenses, net income, and occupancy across your entire portfolio.
🏠 Landlords – Monitor tenant details, lease dates, payment status, and property performance effortlessly.
📊 Real Estate Portfolio Managers – Analyze property manager performance, revenue distribution, and occupancy trends.
💼 Financial Analysts – Evaluate expense ratios, net income trends, and revenue breakdowns for investment decisions.
🏗️ Property Management Companies – Get a complete overview of all managed properties with detailed financial and occupancy analytics.
You may also like our Vacation Rental KPI Dashboard in Google Sheets for short-term rental tracking.
❓ Frequently Asked Questions
What KPIs does the Rental Property Investment Dashboard in Google Sheets track?
The Rental Property Investment Dashboard in Google Sheets tracks Total Properties, Total Rental Income, Total Expenses, Total Net Income, Avg Monthly Rent, Expense Ratio, Occupancy Rate, Vacant Units, Highest Rent, Lowest Rent, and Rent Spread — providing complete visibility into your rental portfolio performance.
Do I need advanced Google Sheets skills to use this dashboard?
No. Simply make a copy in Google Drive, replace the sample data in the Data sheet with your own rental property records, and all charts, KPIs, and dashboard pages update automatically. No formulas or coding knowledge required.
Can I share this dashboard with my property management team?
Yes. Since this is built in Google Sheets, you can share it with any team member via Google Drive sharing. Multiple users can view and collaborate on the dashboard simultaneously in real time.
How many properties can this dashboard handle?
The dashboard is designed to handle hundreds of property records. Simply add your data rows in the Data sheet and all 5 dashboard pages will scale to reflect your full portfolio.
Is this dashboard available in other platforms like Excel or Power BI?
Yes. We also offer the Rental Property Investment Dashboard in Excel, Power BI version, and HTML version of this dashboard.
🔗 Explore Related Templates
📊 Rental Property Investment Dashboard in Excel – The same powerful rental analytics in Microsoft Excel format.
📊 Rental Property Investment Dashboard in Power BI – Advanced interactive rental analytics in Power BI.
📊 Vacation Rental KPI Dashboard in Google Sheets – Specialized dashboard for short-term vacation rental tracking.
Explore all our Google Sheets Dashboard Templates for more solutions.


Reviews
There are no reviews yet.