
In today’s fast-moving global economy, foreign exchange (Forex) services have become essential for international trade, remittances, investments, travel transactions, and digital payments. Financial institutions, forex brokers, and currency exchange companies process thousands of currency conversions daily. However, managing forex operations using manual spreadsheets often results in delayed reporting, limited visibility, and missed revenue opportunities.
The Forex Services Dashboard in Power BI is a powerful, ready-to-use analytics solution designed to transform complex forex transaction data into clear, interactive, and actionable business insights. Built using Microsoft Power BI, this dashboard enables organizations to monitor transactions, analyze service fee revenue, evaluate customer behavior, and track operational performance through dynamic visual reports.
Instead of reviewing multiple disconnected reports, decision-makers can analyze all forex activities from one centralized platform. Consequently, organizations gain real-time visibility into performance metrics, allowing faster decision-making and improved operational efficiency.
Power BI’s advanced visualization capabilities allow users to filter data instantly, drill down into performance details, and identify trends across branches, channels, customer types, and time periods. As soon as data updates, dashboards refresh automatically, ensuring users always work with accurate and up-to-date information.
The dashboard is designed with multiple analytical pages, each focusing on a specific dimension of forex operations. This structured approach helps users move seamlessly from executive-level summaries to detailed operational insights.
Whether managing high transaction volumes, optimizing service fee revenue, or improving customer experience, this dashboard provides a comprehensive view of forex business performance. As a result, organizations reduce operational inefficiencies, identify growth opportunities, and build a data-driven decision-making culture.
📊 Key Feature of Forex Services Dashboard in Power BI
🌍 Real-Time Forex Performance Monitoring
Track transactions, conversions, and operational KPIs instantly.
📈 Interactive KPI Cards
Understand business performance quickly through visual summaries.
🔎 Dynamic Filtering & Drill-Down Analysis
Analyze performance by customer type, branch, channel, or region.
💰 Service Fee Revenue Insights
Identify profitable customers and revenue-driving channels.
🏢 Branch Performance Comparison
Evaluate operational efficiency across multiple locations.
📱 Channel Performance Analysis
Understand digital vs physical transaction behavior.
📅 Monthly Trend Tracking
Monitor seasonal transaction patterns and growth trends.
⚡ Automated Data Refresh
Dashboards update automatically when data changes.
📦 What’s Inside the Forex Services Dashboard in Power BI
The dashboard includes five interactive analytical pages, each delivering focused business insights.
🔹 1. Overview Page – Complete Business Snapshot
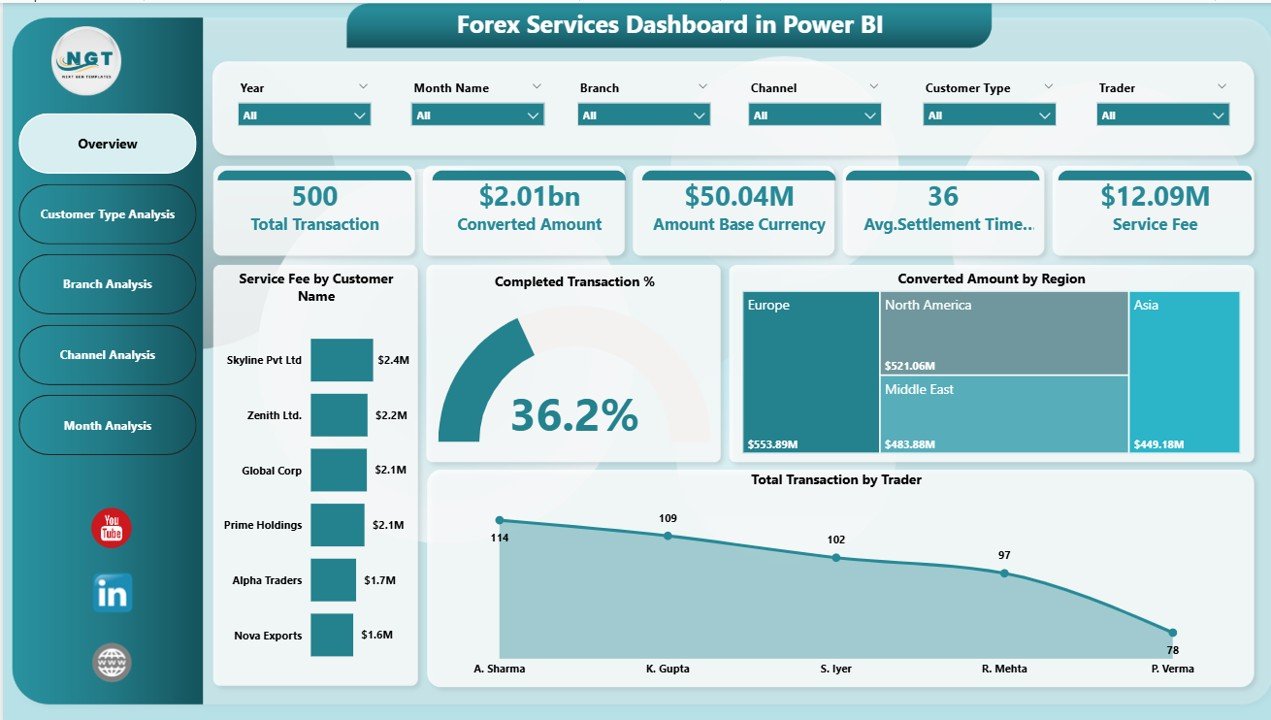
The Overview Page acts as the central monitoring hub.
Key KPI Highlights
-
Service Fee by Customer Name
-
Completed Transaction %
-
Converted Amount by Region
-
Total Transaction by Trader
-
Overall operational performance snapshot
Executives quickly evaluate forex performance without reviewing raw data.
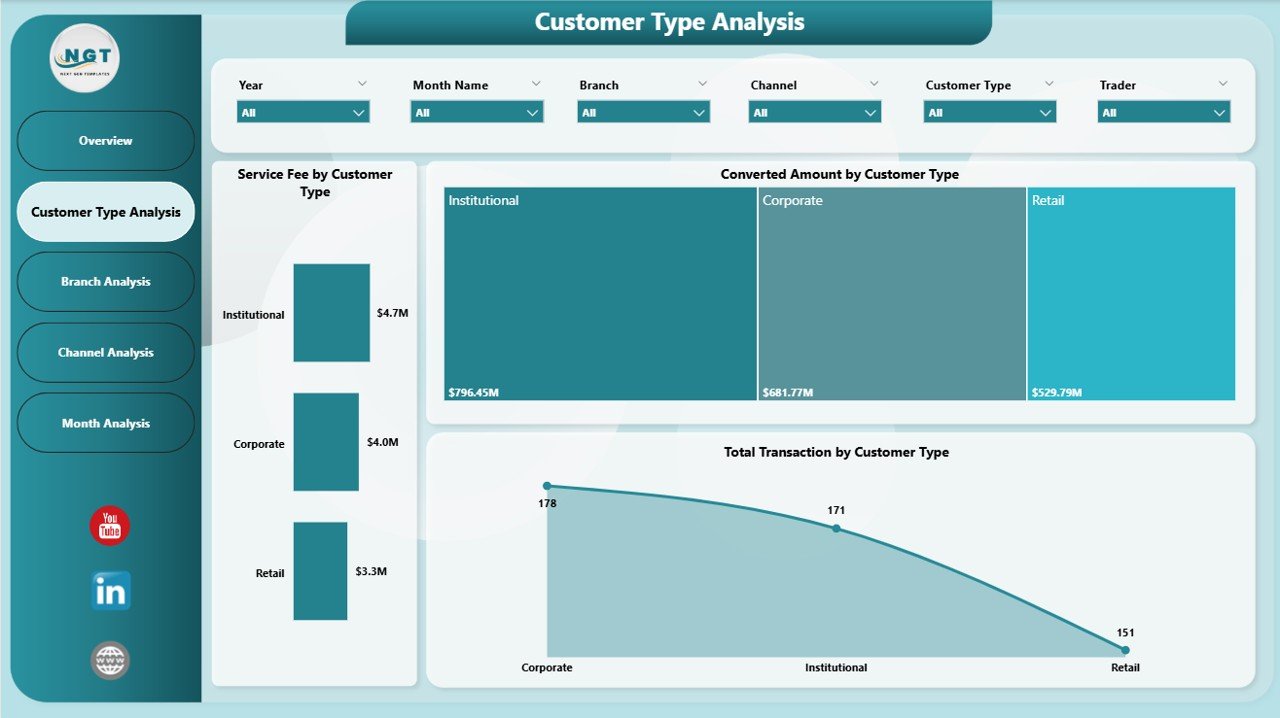
🔹 2. Customer Type Analysis – Customer Behavior Insights
This page analyzes performance across customer segments.
Charts Included
-
Service Fee by Customer Type
-
Converted Amount by Customer Type
-
Total Transaction by Customer Type
Helps organizations identify profitable customer categories and optimize pricing strategies.
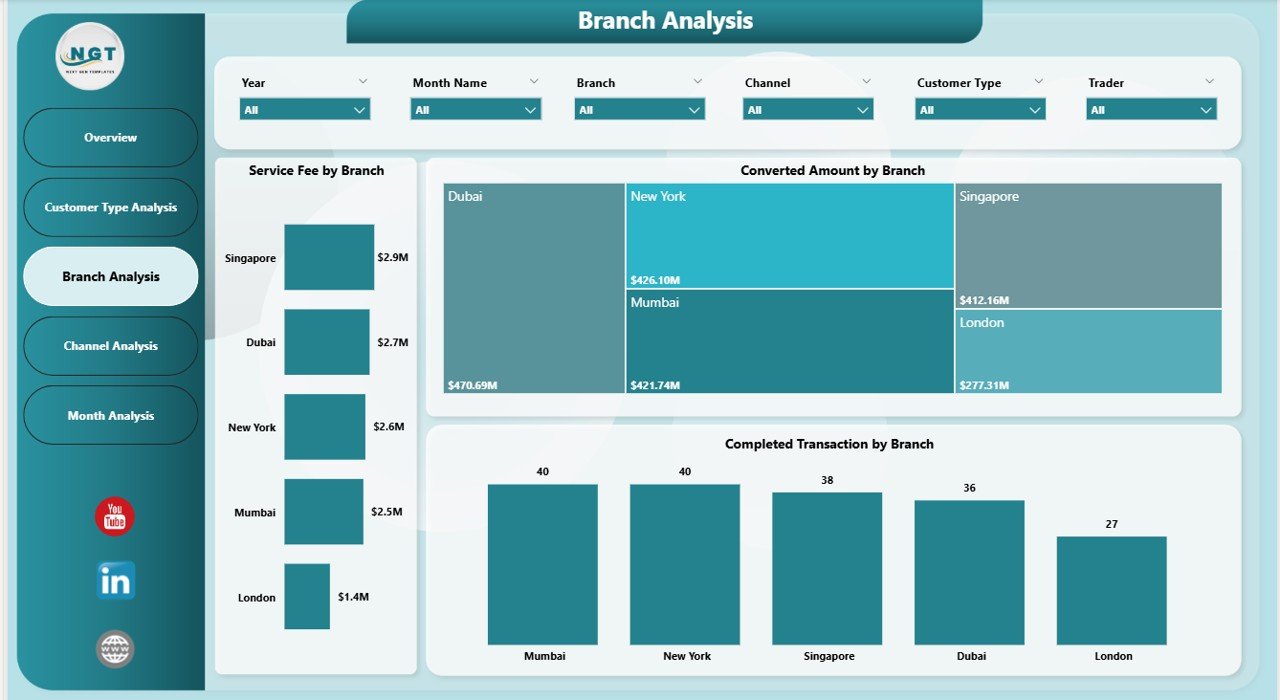
🔹 3. Branch Analysis – Location Performance Monitoring
Branch-wise analytics provide operational clarity.
Visualizations
-
Service Fee by Branch
-
Converted Amount by Branch
-
Completed Transactions by Branch
Enables management to detect underperforming branches and allocate resources effectively.
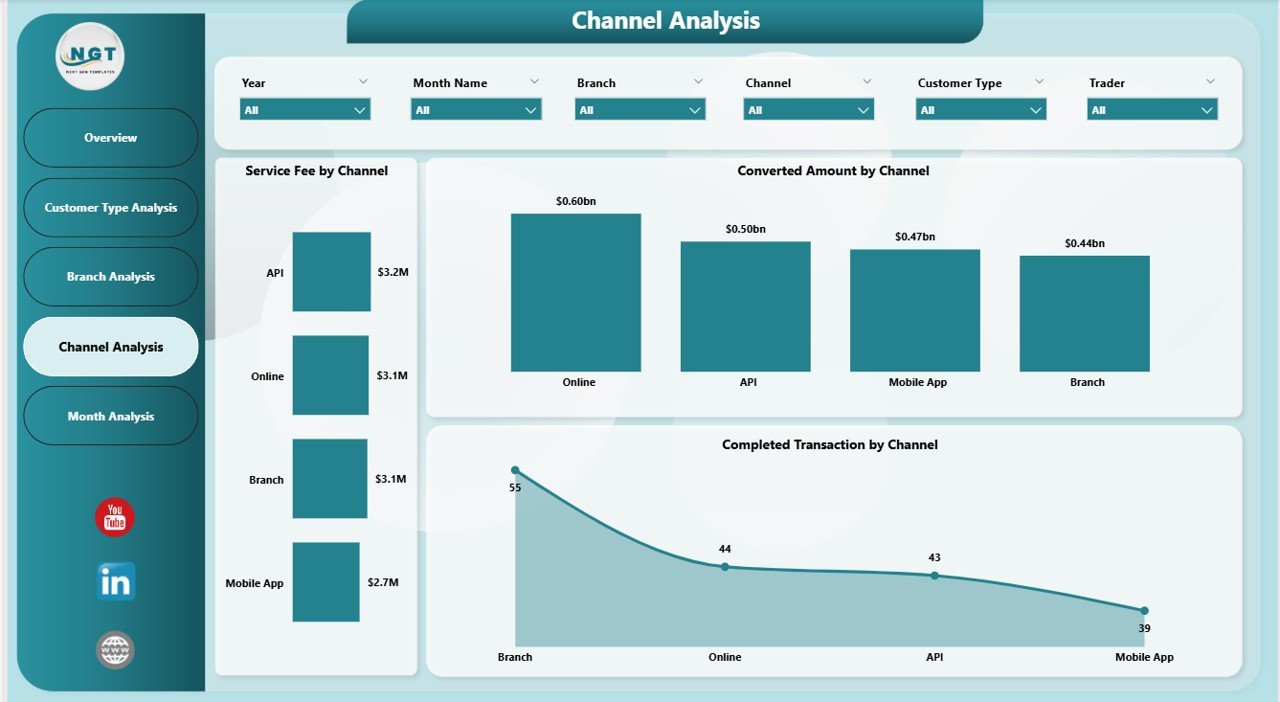
🔹 4. Channel Analysis – Transaction Channel Intelligence
Evaluates performance across transaction channels.
Charts Included
-
Service Fee by Channel
-
Converted Amount by Channel
-
Completed Transactions by Channel
Supports strategic investment in high-performing service channels.
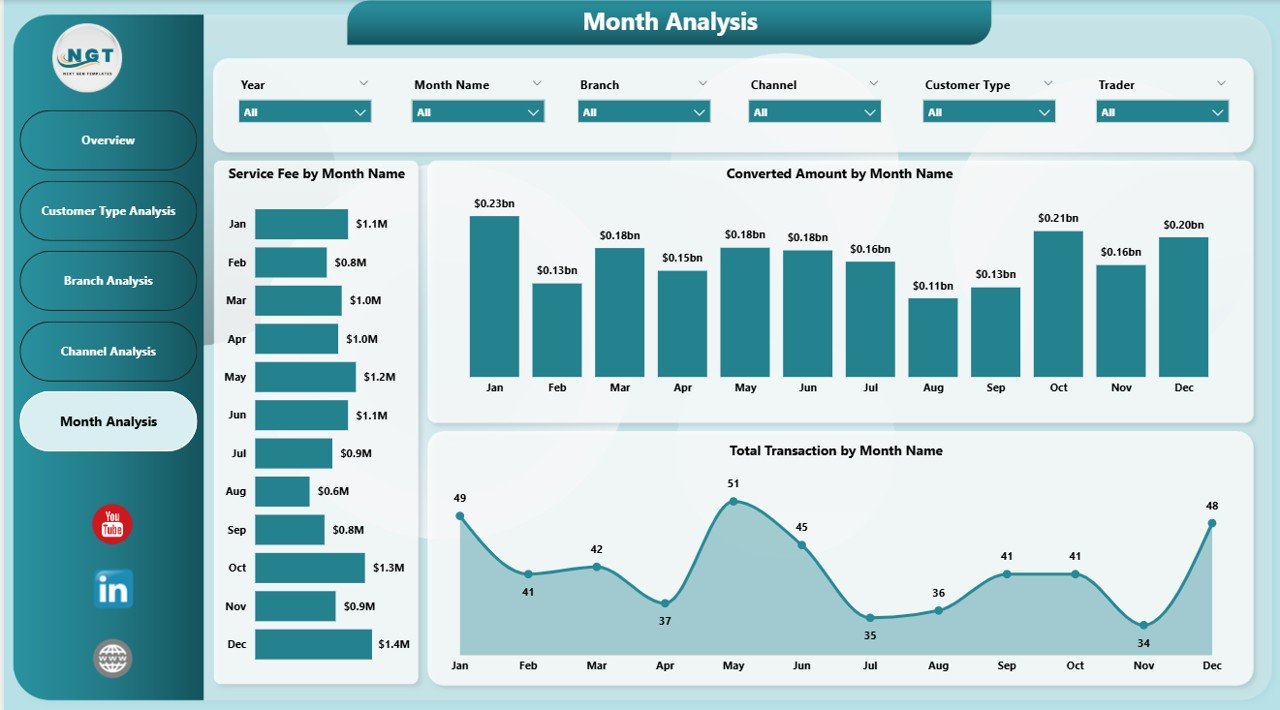
🔹 5. Month Analysis – Time-Based Performance Trends
Tracks forex activity over time.
Metrics Covered
-
Service Fee by Month
-
Converted Amount by Month
-
Total Transactions by Month
Helps forecast demand and plan operational capacity.
⚙️ How to Use the Forex Services Dashboard in Power BI
1️⃣ Import forex transaction datasets into Power BI.
2️⃣ Prepare customer, branch, and channel data.
3️⃣ Refresh dashboard to update visuals automatically.
4️⃣ Use slicers to filter performance dynamically.
5️⃣ Analyze KPIs and charts for actionable insights.
The dashboard is designed for both technical and non-technical users.
👥 Who Can Benefit from This Dashboard
Ideal users include:
✔ Banks & Financial Institutions
✔ Forex Brokers & Exchange Companies
✔ Operations Managers
✔ Financial Analysts
✔ Business Intelligence Teams
✔ Executives & Decision Makers
Because of intuitive visuals, users can analyze performance without advanced analytics knowledge.
🚀 How This Dashboard Improves Forex Operations
Organizations can:
✅ Monitor transaction efficiency in real time
✅ Optimize service fee revenue
✅ Improve customer segmentation strategies
✅ Compare branch and channel performance
✅ Reduce manual reporting workload
✅ Enable faster strategic decision-making
Ultimately, businesses shift from reactive reporting to proactive performance management.
### Click here to read the Detailed blog post
Visit our YouTube channel to learn step-by-step video tutorials
👉 https://youtube.com/@PKAnExcelExpert


